


-
Continuous wave cavity ring down spectroscopy (CW-CRDS) method with using cavity length scanning is ideal for accurately characterizing the low pressure spectra and measuring the small spectral parameters (such as the Dicke narrowing coefficient and the speed dependent collision broadening coefficient). However, the laser of any wavelength can be coupled to the cavity due to the cavity scan, so the spectral noise caused by the laser wavelength fluctuations cannot be ignored. This noise is non-uniformly distributed in the spectrum (especially on both wings on the spectral line) and is difficult to eliminate even with long-term averaging. Unlike the complex laser frequency locking techniques or the optical frequency combs or the better lasers, in this paper, a simple, easy to operate, fast wavelength-scanned CRDS method is proposed based on Fourier transform. The laser wavelength is continuously tuned across the absorption line to measure the periodic ring-down time. A reconstruction algorithm is developed to precisely recover the absorbance by extracting the characteristic frequencies of the periodic ring-down time after the Fourier transform. An etalon, instead of the wavelength meter, is used to calibrate the relative laser wavelength. This method effectively eliminates the non-uniform spectral noise caused by laser wavelength fluctuation in traditional CW-CRDS and significantly improves the measurement accuracy of spectral line parameters (especially line parameters in complex line shapes, such as speed dependent Voigt line shape) at low pressure. In addition, the measuring system, in which no wavelength meter is used, is simpler, more economical than CW-CRDS. The smaller residuals of the Galatry profile fit to the measured CO transitions at R(5) 6371.299 cm–1 and R(6) 6374.406 cm–1 show that the noise on both wings of the spectra, caused by laser wavelength fluctuation, is effectively reduced and the spectral SNR is then improved. The measured N2 perturbed collision broadening coefficient of the Voigt profile fit for CO is consistent with that from the classical CW-CRDS method and is in good agreement with the HITRAN2016 database. The measured N2 perturbed Dicke narrowing coefficient of the Rautian and Galatry profile and speed dependent collision broadening coefficient of the speed dependent Voigt profile have very good linear relationship with pressure, and have smaller uncertainties than the results from the CW-CRDS method.
-
Keywords:
- cavity ring down spectroscopy /
- Fourier transform /
- wavelength scanned /
- collision broadening coefficient
[1] O’Keefe A, Deacon D A G 1988 Rev. Sci. Instrum. 59 2544
 Google Scholar
[2] Lehmann K K, Romanini D 1996 J. Chem. Phys. 105 10263
Google Scholar
[3] Paldus B A, Kachanov A A 2005 Can. J. Phys. 83 975
Google Scholar
[4] Long D A, Fleisher A J, Liu Q, Hodges J T 2016 Opt. Lett. 41 1612
Google Scholar
[5] Karhu J, Lehmann K, Vainio M, Metsälä M, Halonen L 2018 Opt. Express 26 29086
Google Scholar
[6] 胡仁志, 王丹, 谢品华, 凌六一, 秦敏, 李传新, 刘建国 2014 物理学报 63 110707
Google Scholar
Hu R Z, Wang D, Xie P H, Ling L Y, Qin M, Li C X, Liu J G 2014 Acta Phys. Sin. 63 110707
Google Scholar
[7] Romanini D, Kachanov A A, Sadeghi N, Stoeckel F 1997 Chem. Phys. Lett. 264 316
Google Scholar
[8] Bucher C R, Lehmann K K, Plusquellic D F, Fraser G T 2000 Appl. Opt. 39 3154
Google Scholar
[9] Dudek J B, Tarsa P B, Velasquez A, Wladyslawski M, Rabinowitz P, Lehmann K K 2003 Anal. Chem. 75 4599
Google Scholar
[10] Malathy D V, Chris Benner D, Smith M A H, Mantz A W, Sung K, Brown L R, Predoi-Cross A 2012 J. Quant. Spectrosc. Radiat. Transf. 113 1013
Google Scholar
[11] Goldenstein C S, Hanson R K 2015 J. Quant. Spectrosc. Radiat. Transf. 152 127
Google Scholar
[12] Schreier F 2017 J. Quant. Spectrosc. Radiat. Transf. 187 44
Google Scholar
[13] Tan Y, Mikhailenko S N, Wang J, Liu A W, Zhao X Q, Liu G L, Hu S M 2018 J. Quant. Spectrosc. Radiat. Transf. 221 233
Google Scholar
[14] Kassi S, Karlovets E V, Tashkun S A, Perevalov V I, Campargue A 2017 J. Quant. Spectrosc. Radiat. Transf. 187 414
Google Scholar
[15] Mondelain D, Mikhailenko S N, Karlovets E V, Beguier S, Kassi S, Campargue A 2017 J. Quant. Spectrosc. Radiat. Transf. 203 206
Google Scholar
[16] Morville J, Romanini D, Chenevier M, Kachanov A A 2002 Appl. Opt. 41 6980
Google Scholar
[17] Bicer A, Bounds J, Zhu F, Kolomenskii A A, Kaya N, Aluauee E, Amani M, Schuessler H A 2018 Int. J. Thermophys. 39 1572
[18] Cygan A, Wojtewicz S, Domyslawska J, Maslowski P, Bielska K E, Piwinski M, Stec K, Trawinski R S, Ozimek F, Radzewicz C, Abe H, Ido T, Hodges J T, Lisak D, Ciurylo R 2013 Eur. Phys. J. Special Topics 222 2119
Google Scholar
[19] Wójtewicz S, Masłowski P, Cygan A, Wcisło P, Zaborowski M, Piwiński M, Ciuryło R, Lisak D 2015 J. Quant. Spectrosc. Radiat. Transf. 165 68
Google Scholar
[20] Mikhailenko S N, Mondelain D, Karlovets E V, Kassi S, Campargue A 2018 J. Quant. Spectrosc. Radiat. Transf. 206 163
Google Scholar
[21] Gotti R, Prevedelli M, Kassi S, Marangoni M, Romanini D 2018 J. Chem. Phys. 148 054202
Google Scholar
[22] Mondelain D, Sala T, Kassi S, Romanini D, Marangoni M, Campargue A 2015 J. Quant. Spectrosc. Radiat. Transf. 154 35
Google Scholar
[23] Morville J, Romanini D, Kachanov A A, Chenevier M 2004 Appl. Phys. B 78 465
[24] Mazurenka M, Wada R, Shillings A J L, Butler T J A, Beames J M, Orr-Ewing A J 2005 Appl. Phys. B 81 135
Google Scholar
[25] Halmer D, Basum G, Hering P, Mürtz M 2004 Rev. Sci. Instrum. 75 2187
Google Scholar
[26] Du Y J, Peng Z M, Ding Y J 2018 Opt. Express 26 9263
Google Scholar
[27] Peng Z M, Ding Y J, Jia J W, Lan L J, Du Y J, Li Z 2013 Opt. Express 21 23724
Google Scholar
[28] Wójtewicz S, Stec K, Masłowski P, Cygan A, Lisak D, Trawiński R S, Ciuryło R 2013 J. Quant. Spectrosc. Radiat. Transf. 130 191
Google Scholar
[29] Kowzan G, Stec K, Zaborowski M, Wójtewicz S, Cygan A, Lisak D, Masłowski P, Trawiński R S 2017 J. Quant. Spectrosc. Radiat. Transf. 191 46
Google Scholar
[30] Gordon I E, Rothman L S, Hill C, et al. 2017 J. Quant. Spectrosc. Radiat. Transf. 203 3
Google Scholar
-

图 1 FTS-CRDS与CW-CRDS方法的系统原理图 LC, 激光电流和温度控制器; FI, 光纤隔离器; AOM, 声光调制器; APD, 雪崩光电二极管; DDG, 数字延迟发生器; PZT, 压电换能器; DAQ, 数据采集系统; WM, 波长计
Figure 1. The system schematic diagram of FTS-CRDS and CW-CRDS. LC, laser current and temperature controller; FI, fiber isolator; AOM, acousto-optic modulator; APD, avalanche photodiode; DDG, digital delay generator; PZT, piezoelectric transducer; WM, wavelength meter; DAQ, data acquisition system; WM, wavelength meter.
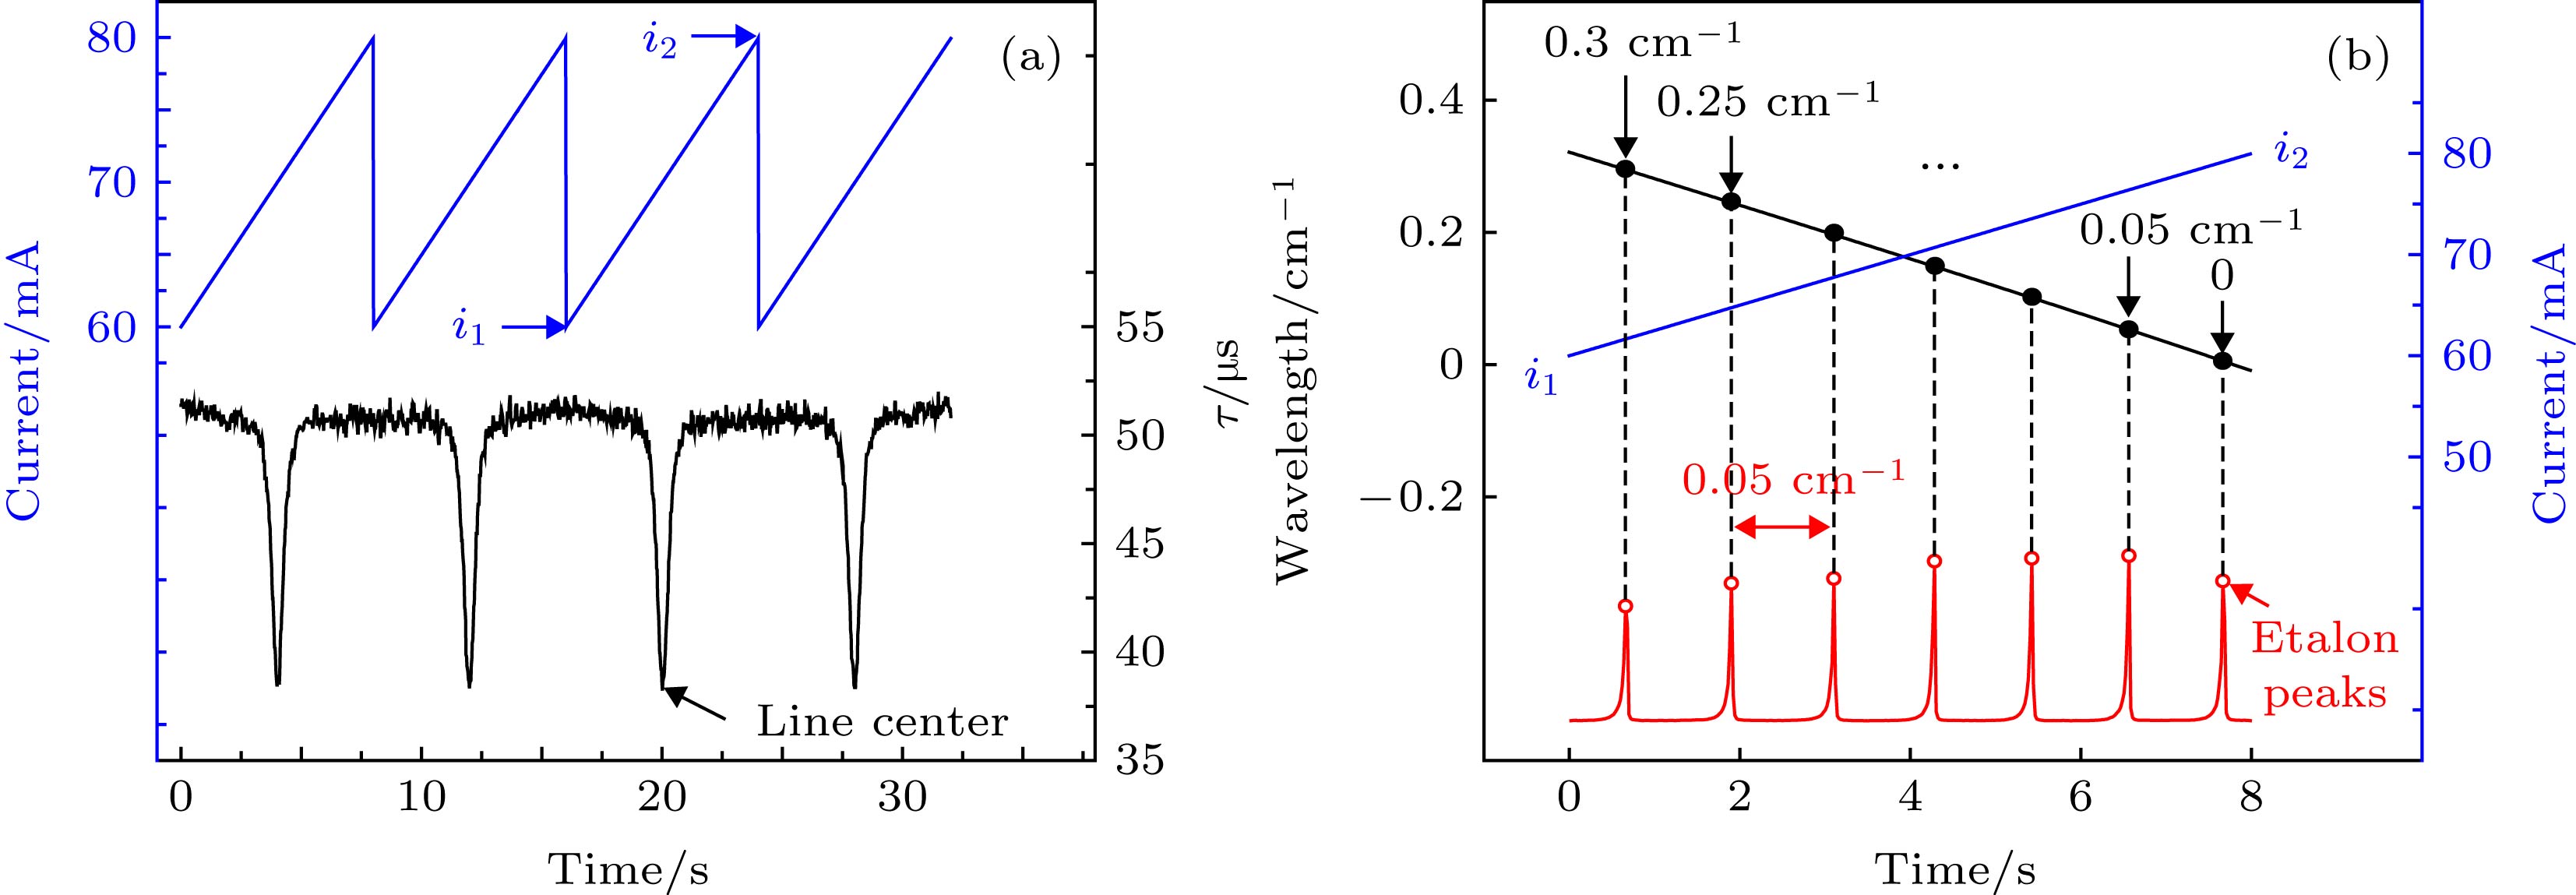
图 2 (a) 激光电流(蓝色)及周期性的衰减常数(黑色); (b) 激光电流(蓝色), 激光波长(黑色), 标准具信号(红色); 图中仅展示了100个周期中的4个
Figure 2. (a) Instantaneous laser current (blue) and instantaneous ring-down time (black), τ(t); (b) wavelength (red) and etalon signal (black). Note that the (a) and (b) figure shows an example with only 4 of 100 the circles.
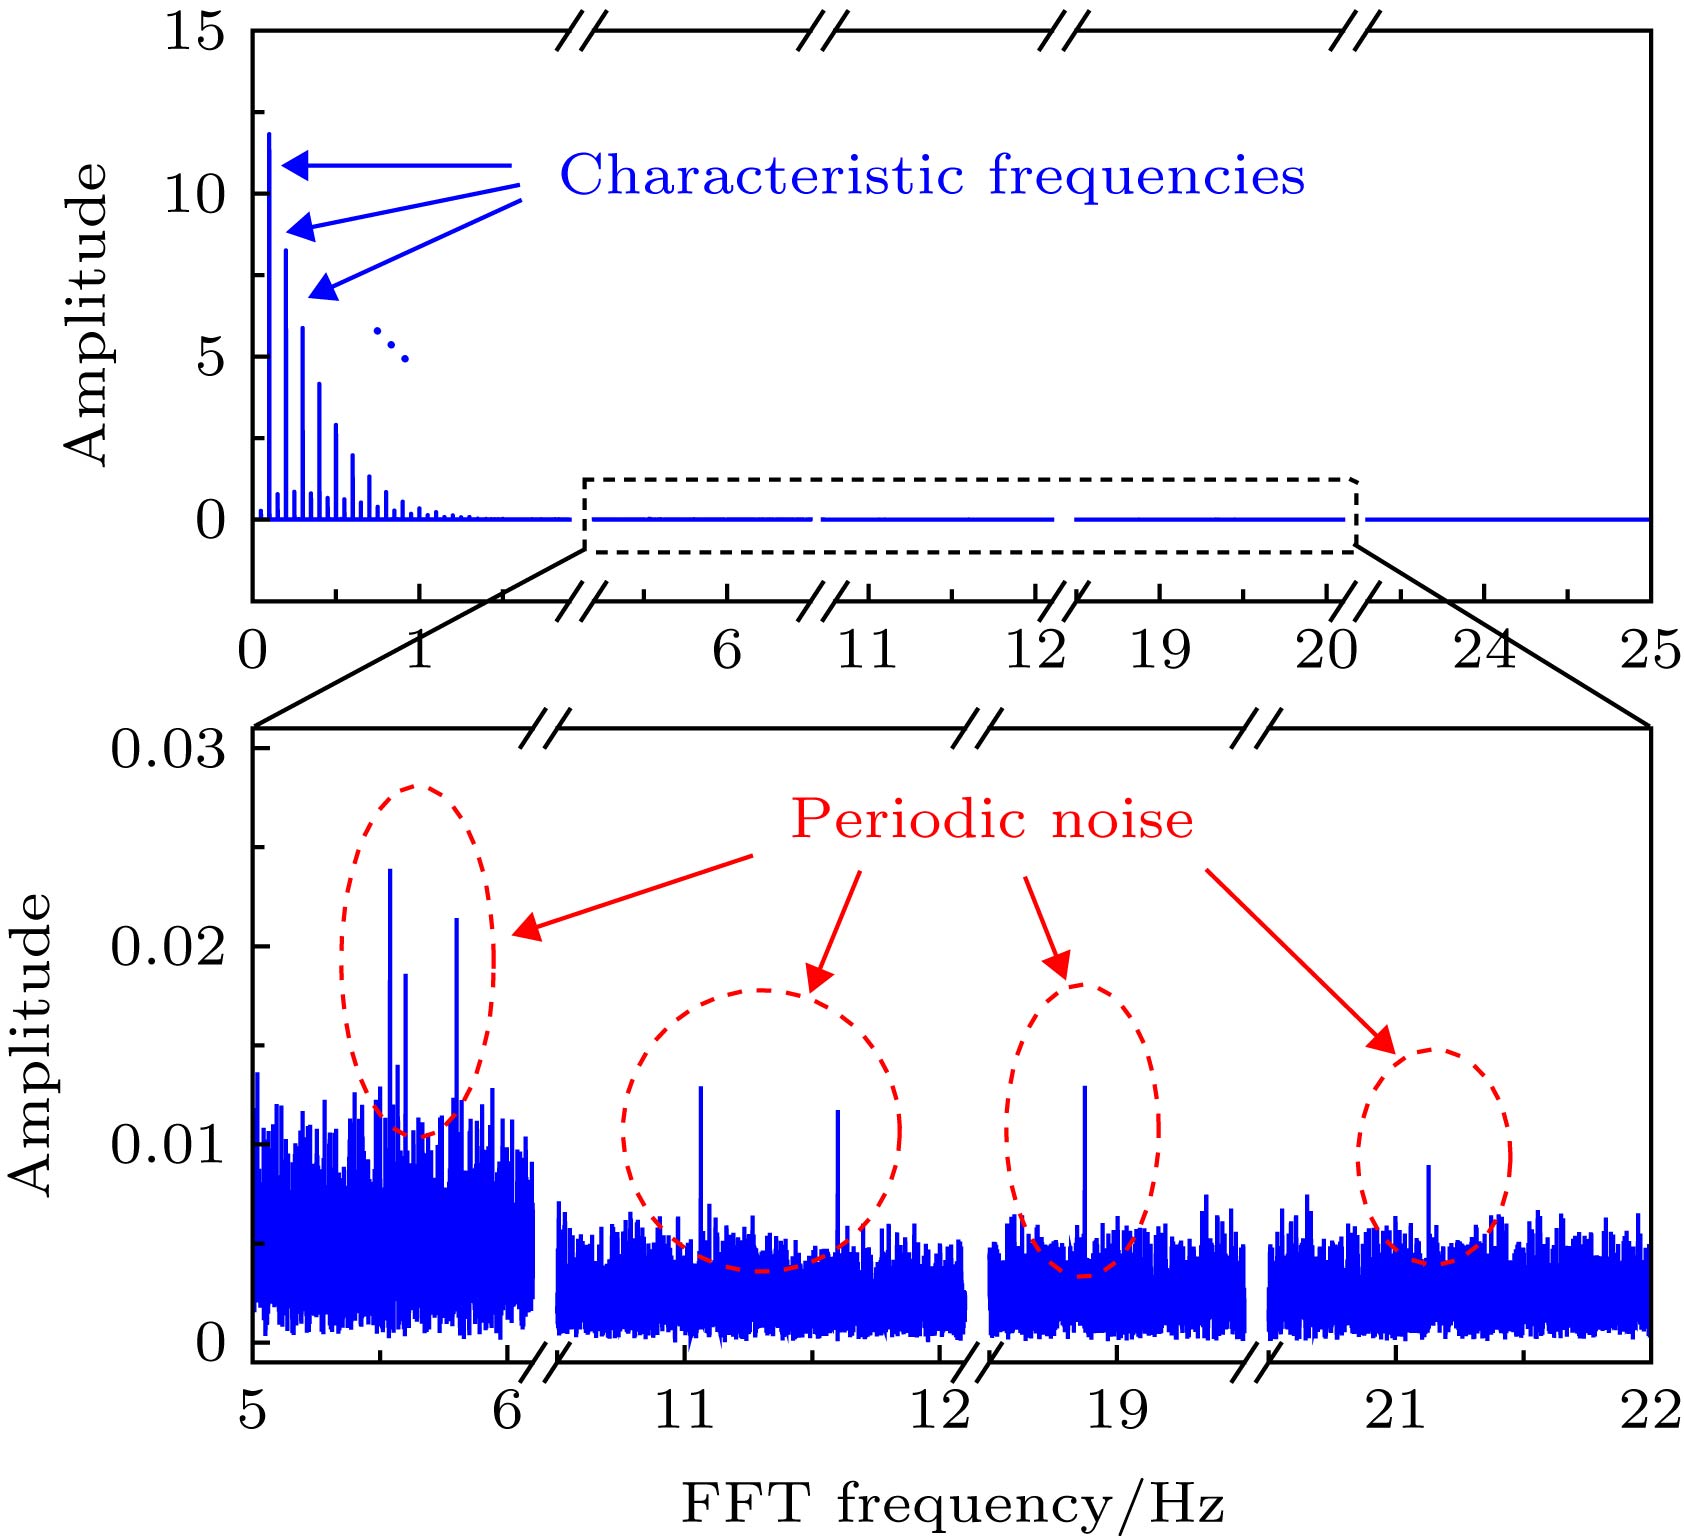
图 3 τ(t)的傅里叶幅值谱及周期性噪声(~5.5, ~11, ~19和~21 Hz)
Figure 3. The amplitude spectrum of τ(t) and the periodic noises (~5.5, ~11, ~19 and ~21 Hz).
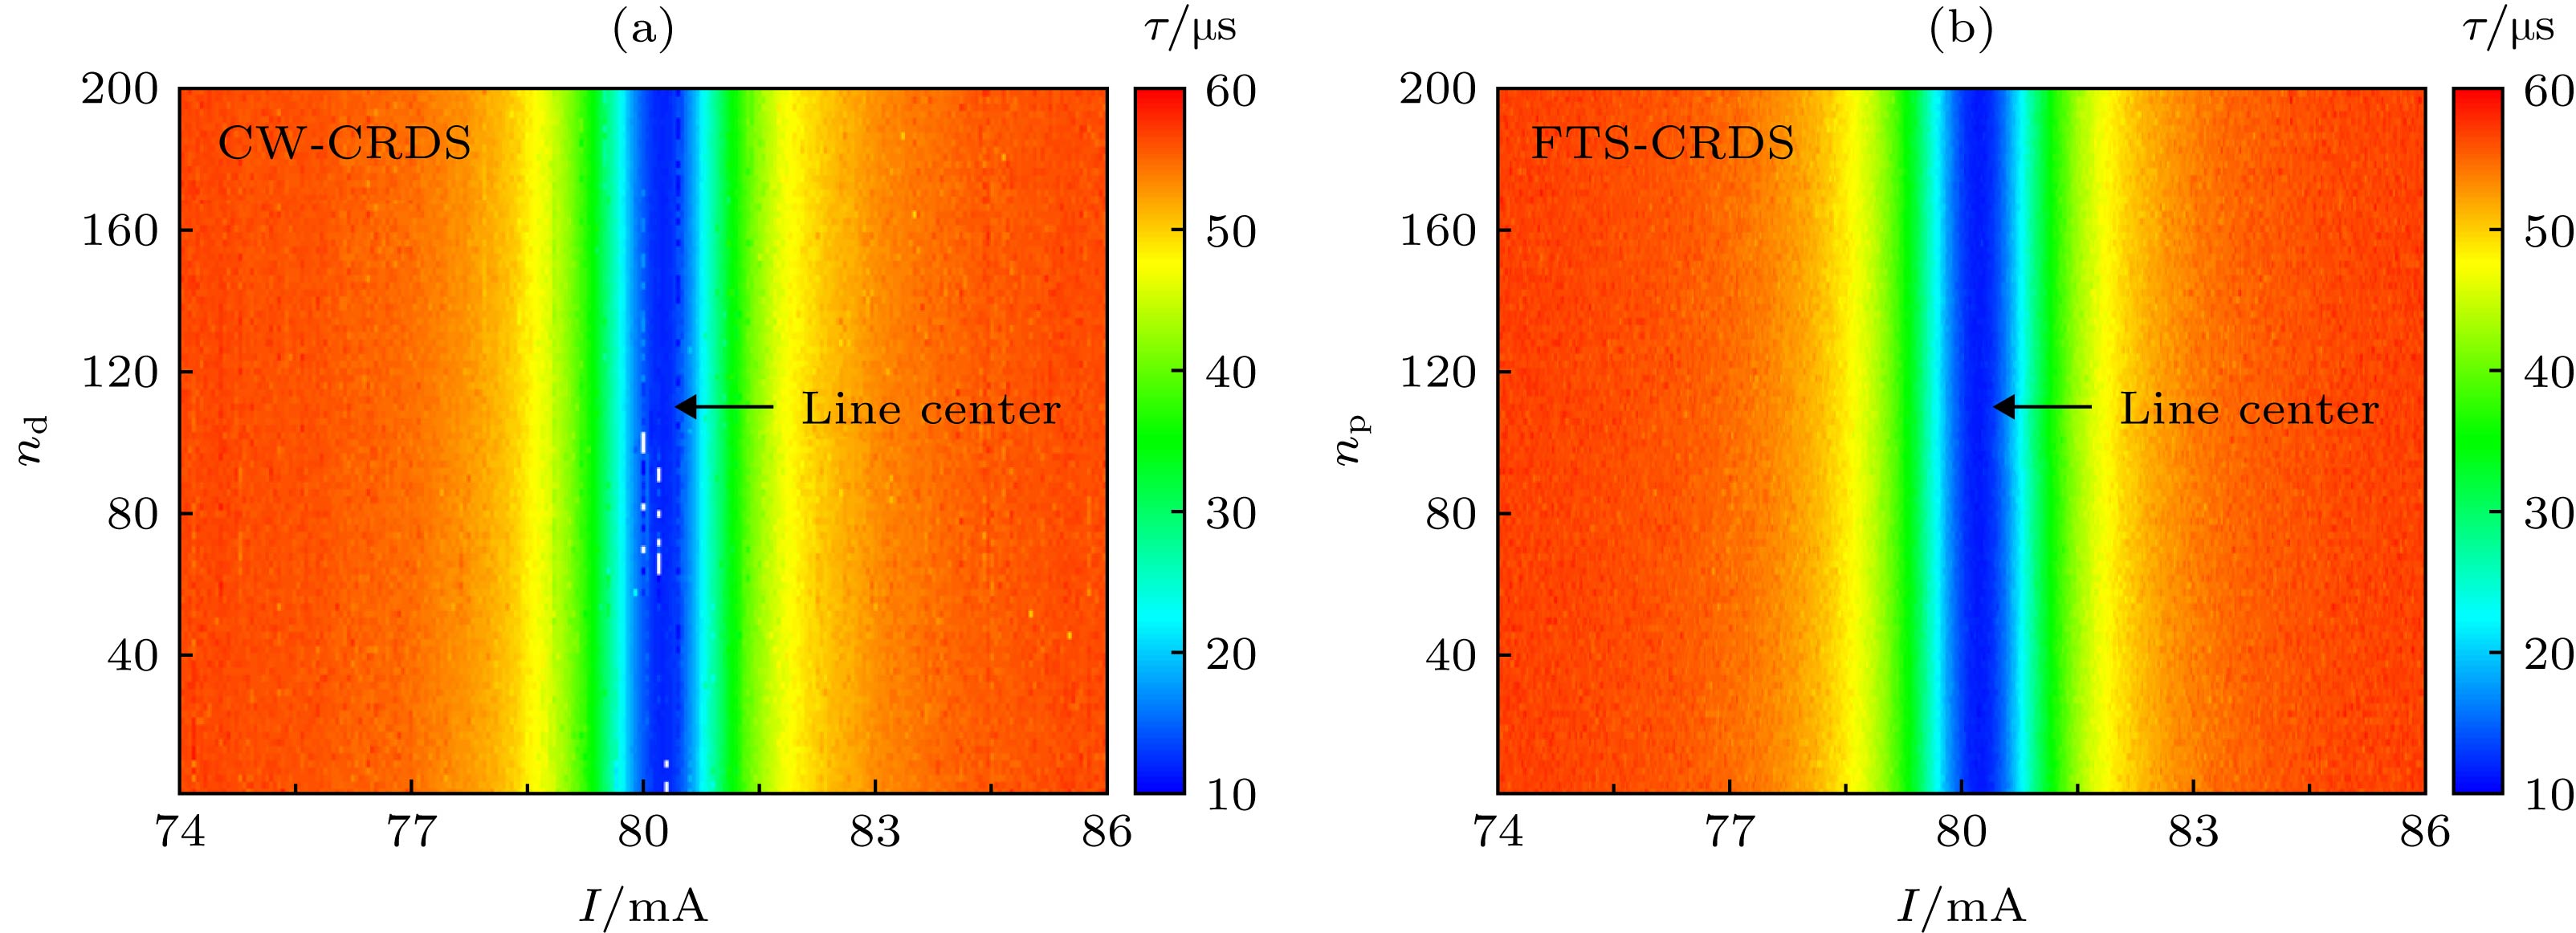
图 4 (a) CW-CRDS测量的衰荡时间, nd为每个电流点的测量次数, 白色点表示超出色阶范围; (b) FTS-CRDS方法测量的衰荡时间, np为所测周期数; 横轴均为激光电流, 为了更清晰地显示谱线中心区域, 这里仅显示了74−86 mA的数据
Figure 4. (a) Ring-down time measured by CW-CRDS, nd is the number of measurements per current, white points represent out-of-range data; (b) ring-down time measured by FTS-CRDS, np is the number of cycles; the x axis represents laser current with the range of 74−86 mA.
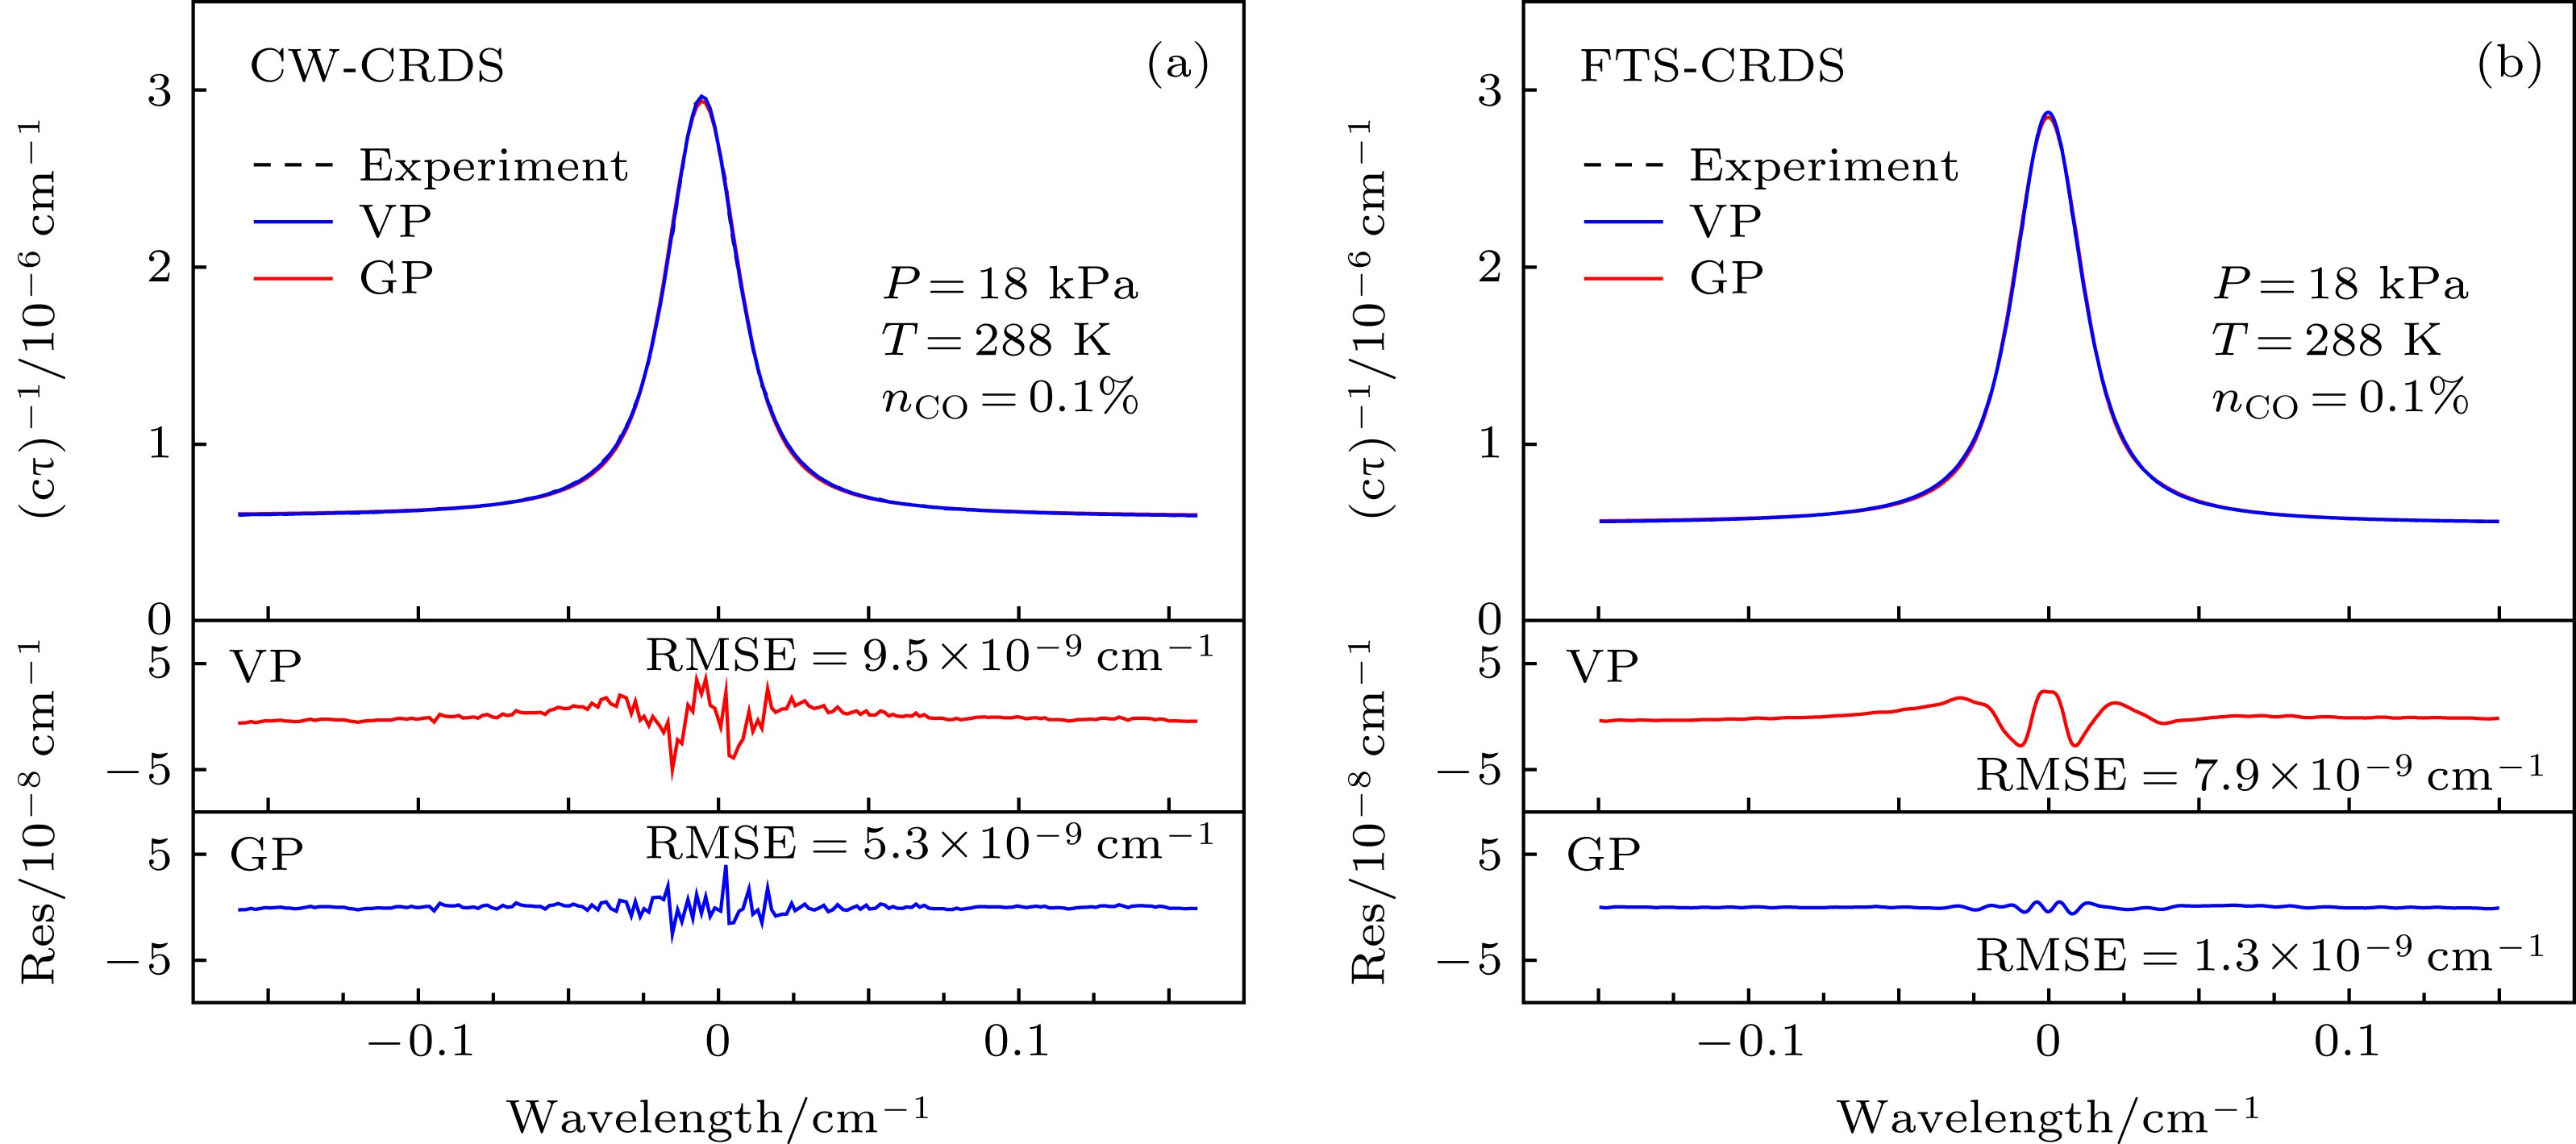
图 5 在相同条件下, 两种方法测量的CO吸收光谱(黑色虚线)及VP(红线)和GP(蓝线)拟合 (a) CW-CRDS; (b) FTS-CRDS; 两幅图的x轴和y轴的尺度相同
Figure 5. The absorption spectra (black dotted line) of CO measured by the two methods and the best fit of Voigt profile (red) and Galatry profile (blue): (a) CW-CRDS; (b) FTS-CRDS; the x and y-axes scales of the residuals obtained by the two methods are the same
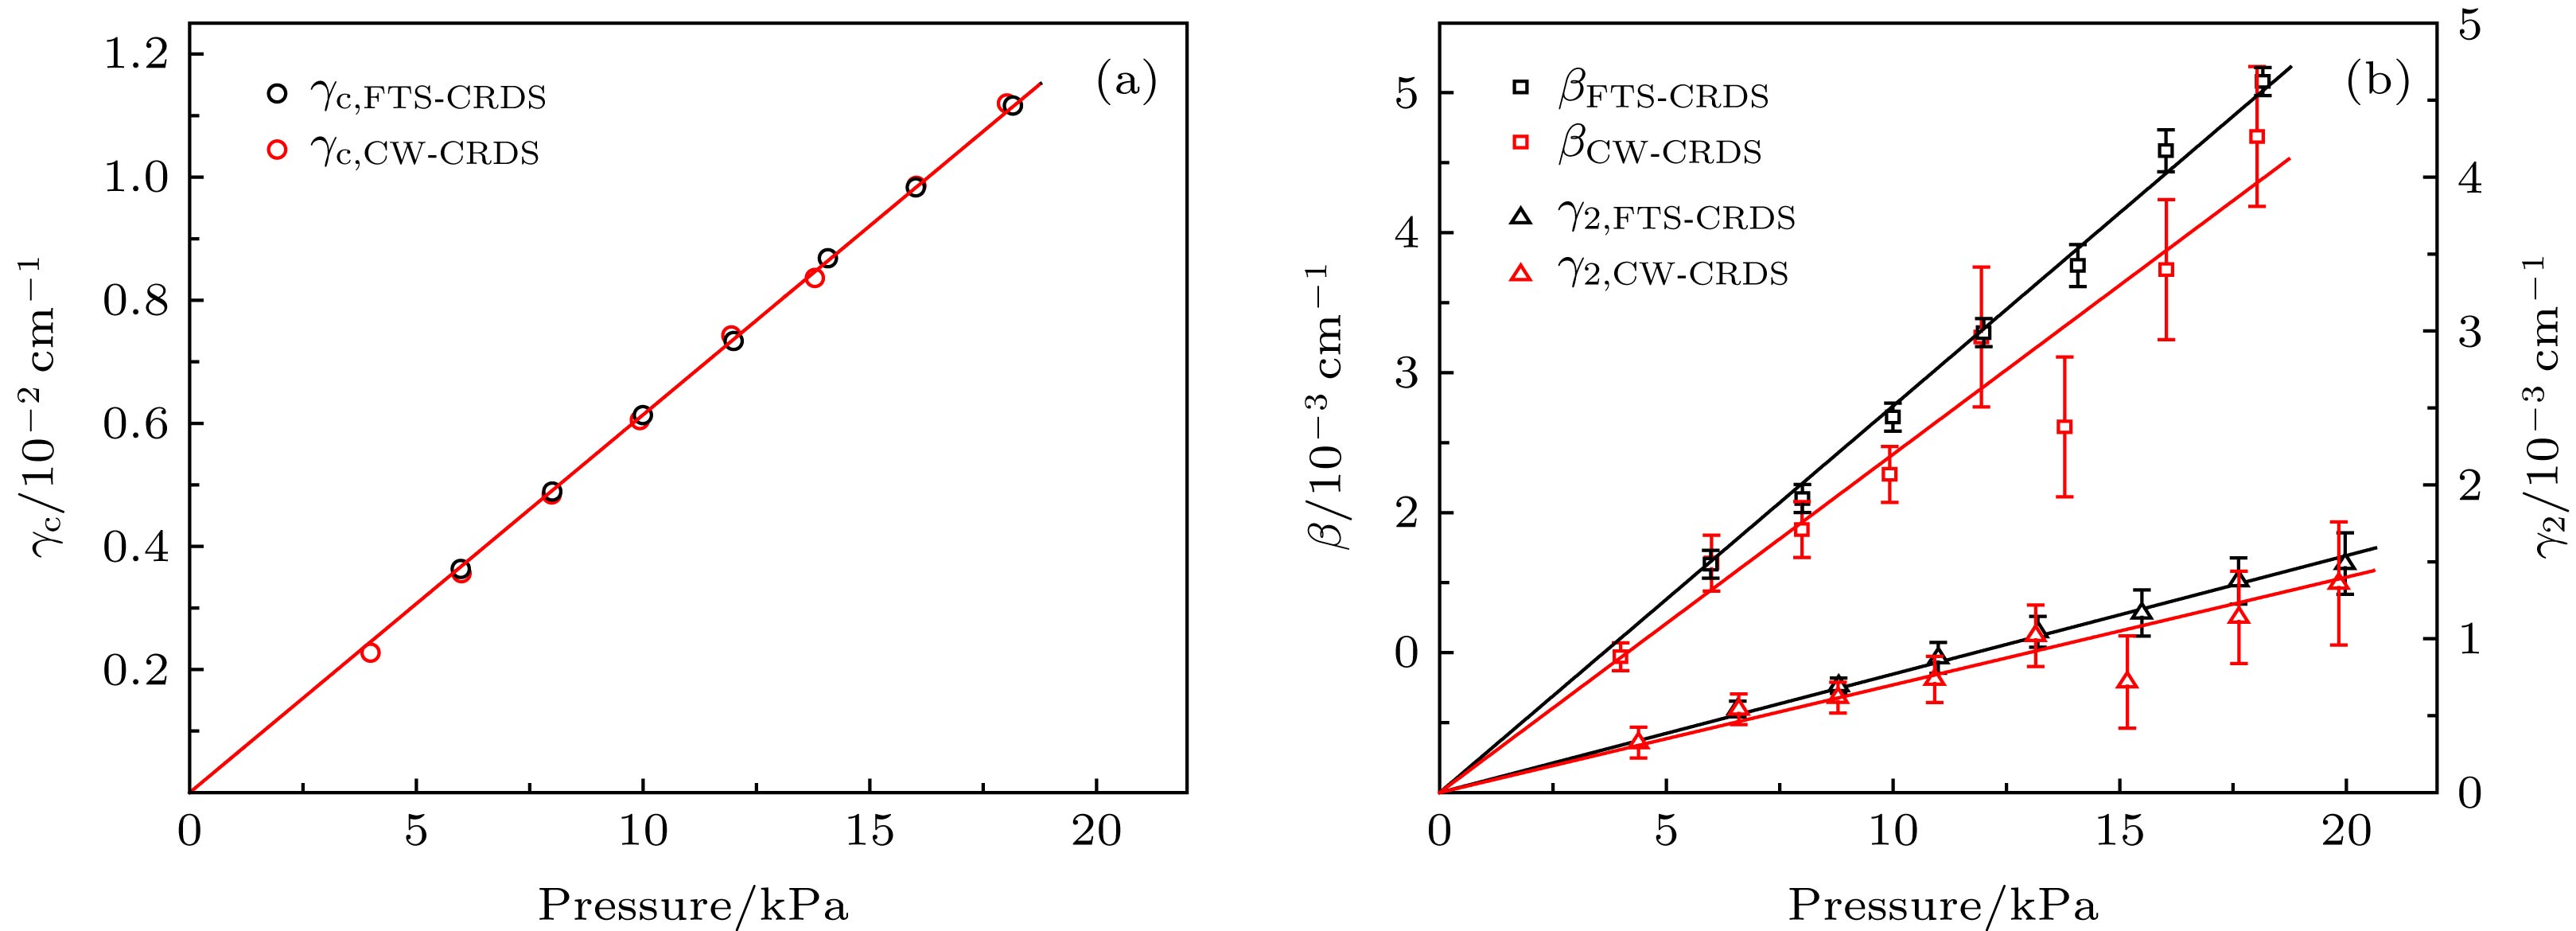
图 6 不同压力下所测得的光谱参数(CW-CRDS所测结果为红色, FTS-CRDS为黑色) (a) γc (空心圆); (b) β (空心方框), γ2 (空心三角)
Figure 6. The measured spectral parameters for various pressures (CW-CRDS (red), FTS-CRDS (black): (a) γc (hollow triangle); (b) β (hollow square), γ2 (hollow triangle).
表 1 FTS-CRDS和CW-CRDS测量的光谱参数及其不确定度
Table 1. Measured spectral parameters and uncertainties by CW-CRDS and FTS-CRDS.
v0/cm–1 E''/cm–1 Transition ϕ γc (T0)/10–2 cm–1·atm–1 β (T0)/10–2 cm–1·atm–1 γ2 (T0)/10–2 cm–1·atm–1 CW FTS HT CW FTS CW FTS 6371.299 57.670 R(5) VP 6.26b 6.29b 6.29a — — — — GP 6.43b 6.51b 2.84d 2.92c — — RP 6.47b 6.54b 2.57d 2.60c — — SDVP 6.50b 6.59b — — 0.87d 0.85c 6374.406 80.735 R(6) VP 6.10b 6.11b 6.12a — — — — GP 6.20b 6.25b 2.65d 2.77c — — RP 6.25b 6.29b 2.38d 2.39c — — SDVP 6.26b 6.33b — — 0.69d 0.79c 注: γc, 碰撞展宽系数; β, Dicke收敛系数; γ2, 速度依赖的碰撞展宽系数; FTS和CW分别代表FTS-CRDS和CW-CRDS, HT表示HITRAN; a表示相同温度(T = 288 K)下HITRAN[30]的数据, 空气为背景气; b不确定度 0%—1%; c不确定度 5%—15%; d不确定度 15%—30%.  DownLoad: CSV
-
[1] O’Keefe A, Deacon D A G 1988 Rev. Sci. Instrum. 59 2544
Google Scholar
[2] Lehmann K K, Romanini D 1996 J. Chem. Phys. 105 10263
Google Scholar
[3] Paldus B A, Kachanov A A 2005 Can. J. Phys. 83 975
Google Scholar
[4] Long D A, Fleisher A J, Liu Q, Hodges J T 2016 Opt. Lett. 41 1612
Google Scholar
[5] Karhu J, Lehmann K, Vainio M, Metsälä M, Halonen L 2018 Opt. Express 26 29086
Google Scholar
[6] 胡仁志, 王丹, 谢品华, 凌六一, 秦敏, 李传新, 刘建国 2014 物理学报 63 110707
Google Scholar
Hu R Z, Wang D, Xie P H, Ling L Y, Qin M, Li C X, Liu J G 2014 Acta Phys. Sin. 63 110707
Google Scholar
[7] Romanini D, Kachanov A A, Sadeghi N, Stoeckel F 1997 Chem. Phys. Lett. 264 316
Google Scholar
[8] Bucher C R, Lehmann K K, Plusquellic D F, Fraser G T 2000 Appl. Opt. 39 3154
Google Scholar
[9] Dudek J B, Tarsa P B, Velasquez A, Wladyslawski M, Rabinowitz P, Lehmann K K 2003 Anal. Chem. 75 4599
Google Scholar
[10] Malathy D V, Chris Benner D, Smith M A H, Mantz A W, Sung K, Brown L R, Predoi-Cross A 2012 J. Quant. Spectrosc. Radiat. Transf. 113 1013
Google Scholar
[11] Goldenstein C S, Hanson R K 2015 J. Quant. Spectrosc. Radiat. Transf. 152 127
Google Scholar
[12] Schreier F 2017 J. Quant. Spectrosc. Radiat. Transf. 187 44
Google Scholar
[13] Tan Y, Mikhailenko S N, Wang J, Liu A W, Zhao X Q, Liu G L, Hu S M 2018 J. Quant. Spectrosc. Radiat. Transf. 221 233
Google Scholar
[14] Kassi S, Karlovets E V, Tashkun S A, Perevalov V I, Campargue A 2017 J. Quant. Spectrosc. Radiat. Transf. 187 414
Google Scholar
[15] Mondelain D, Mikhailenko S N, Karlovets E V, Beguier S, Kassi S, Campargue A 2017 J. Quant. Spectrosc. Radiat. Transf. 203 206
Google Scholar
[16] Morville J, Romanini D, Chenevier M, Kachanov A A 2002 Appl. Opt. 41 6980
Google Scholar
[17] Bicer A, Bounds J, Zhu F, Kolomenskii A A, Kaya N, Aluauee E, Amani M, Schuessler H A 2018 Int. J. Thermophys. 39 1572
[18] Cygan A, Wojtewicz S, Domyslawska J, Maslowski P, Bielska K E, Piwinski M, Stec K, Trawinski R S, Ozimek F, Radzewicz C, Abe H, Ido T, Hodges J T, Lisak D, Ciurylo R 2013 Eur. Phys. J. Special Topics 222 2119
Google Scholar
[19] Wójtewicz S, Masłowski P, Cygan A, Wcisło P, Zaborowski M, Piwiński M, Ciuryło R, Lisak D 2015 J. Quant. Spectrosc. Radiat. Transf. 165 68
Google Scholar
[20] Mikhailenko S N, Mondelain D, Karlovets E V, Kassi S, Campargue A 2018 J. Quant. Spectrosc. Radiat. Transf. 206 163
Google Scholar
[21] Gotti R, Prevedelli M, Kassi S, Marangoni M, Romanini D 2018 J. Chem. Phys. 148 054202
Google Scholar
[22] Mondelain D, Sala T, Kassi S, Romanini D, Marangoni M, Campargue A 2015 J. Quant. Spectrosc. Radiat. Transf. 154 35
Google Scholar
[23] Morville J, Romanini D, Kachanov A A, Chenevier M 2004 Appl. Phys. B 78 465
[24] Mazurenka M, Wada R, Shillings A J L, Butler T J A, Beames J M, Orr-Ewing A J 2005 Appl. Phys. B 81 135
Google Scholar
[25] Halmer D, Basum G, Hering P, Mürtz M 2004 Rev. Sci. Instrum. 75 2187
Google Scholar
[26] Du Y J, Peng Z M, Ding Y J 2018 Opt. Express 26 9263
Google Scholar
[27] Peng Z M, Ding Y J, Jia J W, Lan L J, Du Y J, Li Z 2013 Opt. Express 21 23724
Google Scholar
[28] Wójtewicz S, Stec K, Masłowski P, Cygan A, Lisak D, Trawiński R S, Ciuryło R 2013 J. Quant. Spectrosc. Radiat. Transf. 130 191
Google Scholar
[29] Kowzan G, Stec K, Zaborowski M, Wójtewicz S, Cygan A, Lisak D, Masłowski P, Trawiński R S 2017 J. Quant. Spectrosc. Radiat. Transf. 191 46
Google Scholar
[30] Gordon I E, Rothman L S, Hill C, et al. 2017 J. Quant. Spectrosc. Radiat. Transf. 203 3
Google Scholar

 DownLoad:
Catalog
Metrics
- Abstract views: 7469
- PDF Downloads: 83
- Cited By: 0
