


-
With the rapid development of color image contents and imaging devices in various kinds of multimedia communication systems, conventional grayscale counterparts are replaced by chromatic ones. Under such a transition, the image quality assessment (IQA) model needs to be built by subjective visual measurement, designed in accordance with the results, and applied to the related practical problems. Based on the visual perception characteristics, chromaticity and the structure feature information are quantified, and an objective IQA model combining the color appearance and the gradient image features is proposed in this paper, namely color appearance and gradient similarity(CAGS) model. Two new color appearance indices, vividness and depth, are selected to build the chromatic similarity map. The structure information is characterized by gradient similarity map. Vividness map plays two roles in the proposed model. One is utilized as feature extractor to compute the local quality of distorted image, and the other is as a weight part to reflect the importance of local domain. To quantify the specific parameters of CAGS, Taguchi method is used and four main parameters, i.e., KV, KD, KG and α, of this model are determined based on the statistical correlation indices. The optimal parameters of CAGS are KV = KD = 0.02, KG = 50, and α = 0.1. Furthermore, the CAGS is tested by utilizing 94 reference images and 4830 distorted images from the four open image databases (LIVE, CSIQ, TID2013 and IVC). Additionally, the influences of the 35 distortion types on IQA are analyzed. Massive experiments are performed on four publicly available benchmark databases between CAGS and other 10 state-of-the-art and recently published IQA models, for the accuracy, complexity and generalization performance of IQA. The experimental results show that the accuracy PLCC of the CAGS model can achieve 0.8455 at lowest and 0.9640 at most in the four databases, and the results about commonly evaluation criteria prove that the CAGS performs higher consistency with the subjective evaluations. Among the 35 distortion types, the two distortion types, namely contrast change and change of color saturation, CAGS and mostly IQA models have the worst influence on IQA, and the CAGS yields the highest top three rank number. Moreover, the SROCC values of CAGS for other distortion types are all larger than 0.6 and the number of SROCC value larger than 0.95 is 14 times. Besides, the CAGS maintains a moderate computational complexity. These results of test and comparison above show that the CAGS model is effective and feasible, and the corresponding model has an excellent performance.
-
Keywords:
- image quality assessment /
- human visual perception /
- color appearance /
- gradient
[1] 姚军财, 刘贵忠 2018 物理学报 67 108702
 Google Scholar
Yao J C, Liu G Z 2018 Acta Phys. Sin. 67 108702
Google Scholar
[2] Athar S, Wang Z 2019 IEEE Access 7 140030
Google Scholar
[3] Lin W S, Kuo C C J 2011 J. Vis. Commun. Image R. 22 297
Google Scholar
[4] Chang H W, Zhang Q W, Wu Q G, Gan Y 2015 Neurocomputing 151 1142
Google Scholar
[5] Wang Z, Bovik A C, Sheikh H R, Simoncelli E P 2004 IEEE Trans. Image Process. 13 600
Google Scholar
[6] Sheikh H R, Bovik A C 2006 IEEE Trans. Image Process. 15 430
Google Scholar
[7] Sheikh H R, Bovik A C, de Veciana G 2005 IEEE Trans. Image Process. 14 2117
Google Scholar
[8] Wang Z, Simoncelli E P, Bovik A C 2003 37th Asilomar Conference on Signals, Systems and Computer PacificGrove, CA, November 9−12, 2003 pp1398−1402
[9] Wang Z, Li Q 2011 IEEE Trans. Image Process. 20 1185
Google Scholar
[10] Larson E C, Chandler D M 2010 J. Electron. Imaging 19 011006
Google Scholar
[11] Zhang L, Zhang L, Mou X Q 2010 IEEE International Conference on Image Processing Hong Kong, Peoples of China, September 26−29, 2010 pp321−324
[12] Zhang L, Zhang L, Mou X Q, Zhang D 2011 IEEE Trans. Image Process. 20 2378
Google Scholar
[13] Liu A M, Lin W S, Narwaria M 2012 IEEE Trans. Image Process. 21 1500
Google Scholar
[14] Jia H Z, Zhang L, Wang T H 2018 IEEE Access 6 65885
Google Scholar
[15] 姚军财, 申静 2020 物理学报 69 148702
Google Scholar
Yao J C, Shen J 2020 Acta Phys. Sin. 69 148702
Google Scholar
[16] Robertson A R 1990 Color Res. Appl. 15 167
Google Scholar
[17] Mahny M, Vaneycken L, Oosterlinck A 1994 Color Res. Appl. 19 105
[18] Lee D, Plataniotis K N 2015 IEEE Trans. Image Process. 24 3950
Google Scholar
[19] Lee D, Plataniotis K N 2014 2014 International Conference on Acoustics, Speech and Signal Processing (ICASSP) Florence, Italy, May 4−9, 2014 pp166−170
[20] Berns R S 2014 Color Res. Appl. 39 322
Google Scholar
[21] Zhang L, Shen Y, Li H Y 2014 IEEE Trans. Image Process. 23 4270
Google Scholar
[22] Jain R C, Kasturi R, Schunck B G 1995 Machine Vision (New York: McGraw-Hill) pp140–185
[23] Sonka M, Hlavac V, Boyle R 2008 Image Processing, Analysis and Machine Vision (3rd Ed.) (Stanford: Cengage Learning) p77
[24] Xue W F, Zhang L, Mou X Q, Bovik A C 2014 IEEE Trans. Image Process. 23 684
Google Scholar
[25] Kim D O, Han H S, Park R H 2010 IEEE Trans. Consum. Electr. 56 930
Google Scholar
[26] Nafchi H Z, Shahkolaei A, Hedjam R, Cheriet M 2016 IEEE Access 4 5579
Google Scholar
[27] Taguchi G, Yokoyama Y, Wu Y 1993 Taguchi Methods, Design of experiments (Dearbon, MI: ASI Press) pp59−63
[28] Ponomarenko N, Jin L, Ieremeiev O, Lukin V, Egiazarian K, Astola J, Vozel B, Chehdi K, Carli M, Battisti F, Kuo C C J 2015 Signal Process. Image Commun. 30 57
Google Scholar
[29] Larson E C, Chandler D M http://vision.eng.shizuoka.ac.jp/mod/page/view.php?id=23[2020-7-13]
[30] Sheikh H R, Sabir M F, Bovik A C 2006 IEEE Trans. Image Process. 15 3440
Google Scholar
[31] Ninassi A, Le Callet P, Autrusseau F 2006 Conference on Human Vision and Electronic Imaging Ⅺ San Jose, CA, USA, January 16–18, 2006 p1
[32] Wang S Q, Gu K, Zeng K, Wang Z, Lin W S 2016 Proc. SPIE 6057 Comput. Graph. Appl. 38 47
Google Scholar
[33] Lin C H, Wu C C, Yang P H, Kuo T Y 2009 J. Disp. Technol. 5 323
Google Scholar
[34] Preiss J, Fernandes F, Urban P 2014 IEEE Trans. Image Process. 23 1366
Google Scholar
-
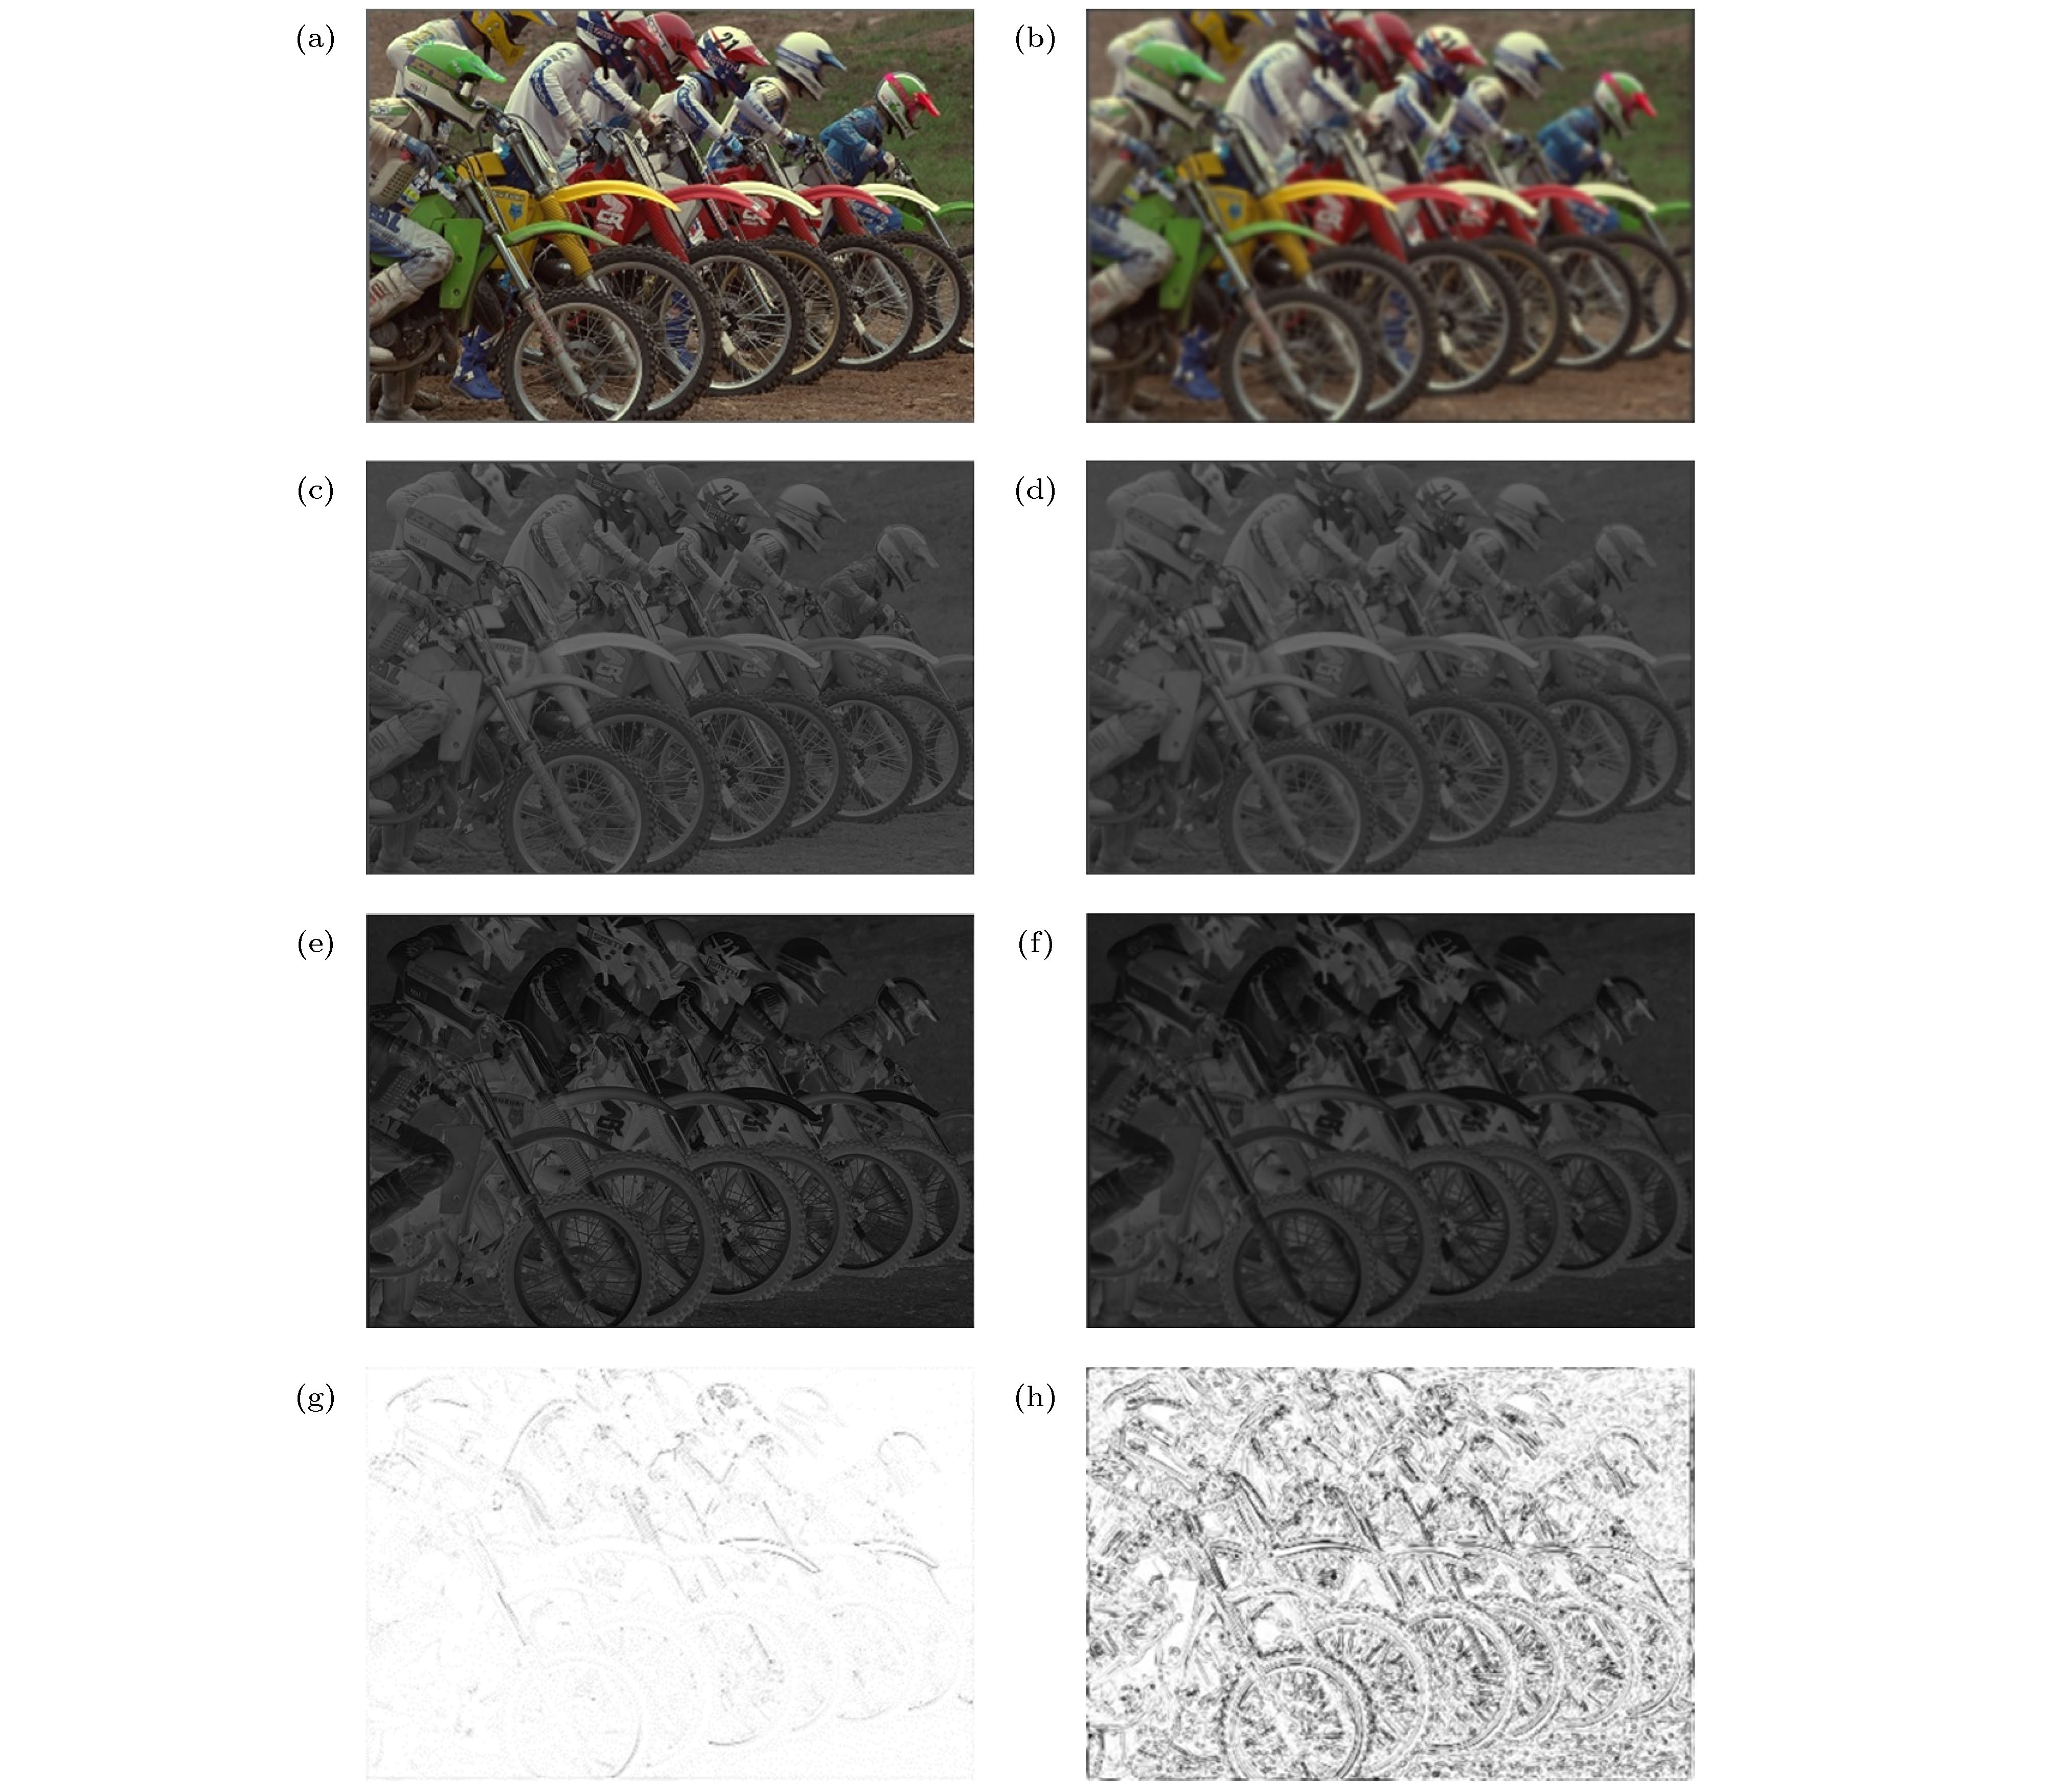
图 2 从LIVE数据库中提取的典型图像 (a)为参考图像; (b)为高斯模糊畸变类型的失真图像; (c)和(e)分别是参考图像的Vividness和Depth图; (d)和(f)分别是失真图像的Vividness和Depth图; (g)是色貌相似图; (h)为梯度相似图
Figure 2. Typical images extracted from LIVE: (a) The reference image;(b) the distorted vision of it by Gaussian blur distortion type; (c) and (e) are the vividness and depth map of the reference image, respectively; (d) and (f) are the vividness and depth map of the distorted image; (g) the color appearance similarity map by connecting the vividness and depth similarity map; (h) the gradient similarity map.
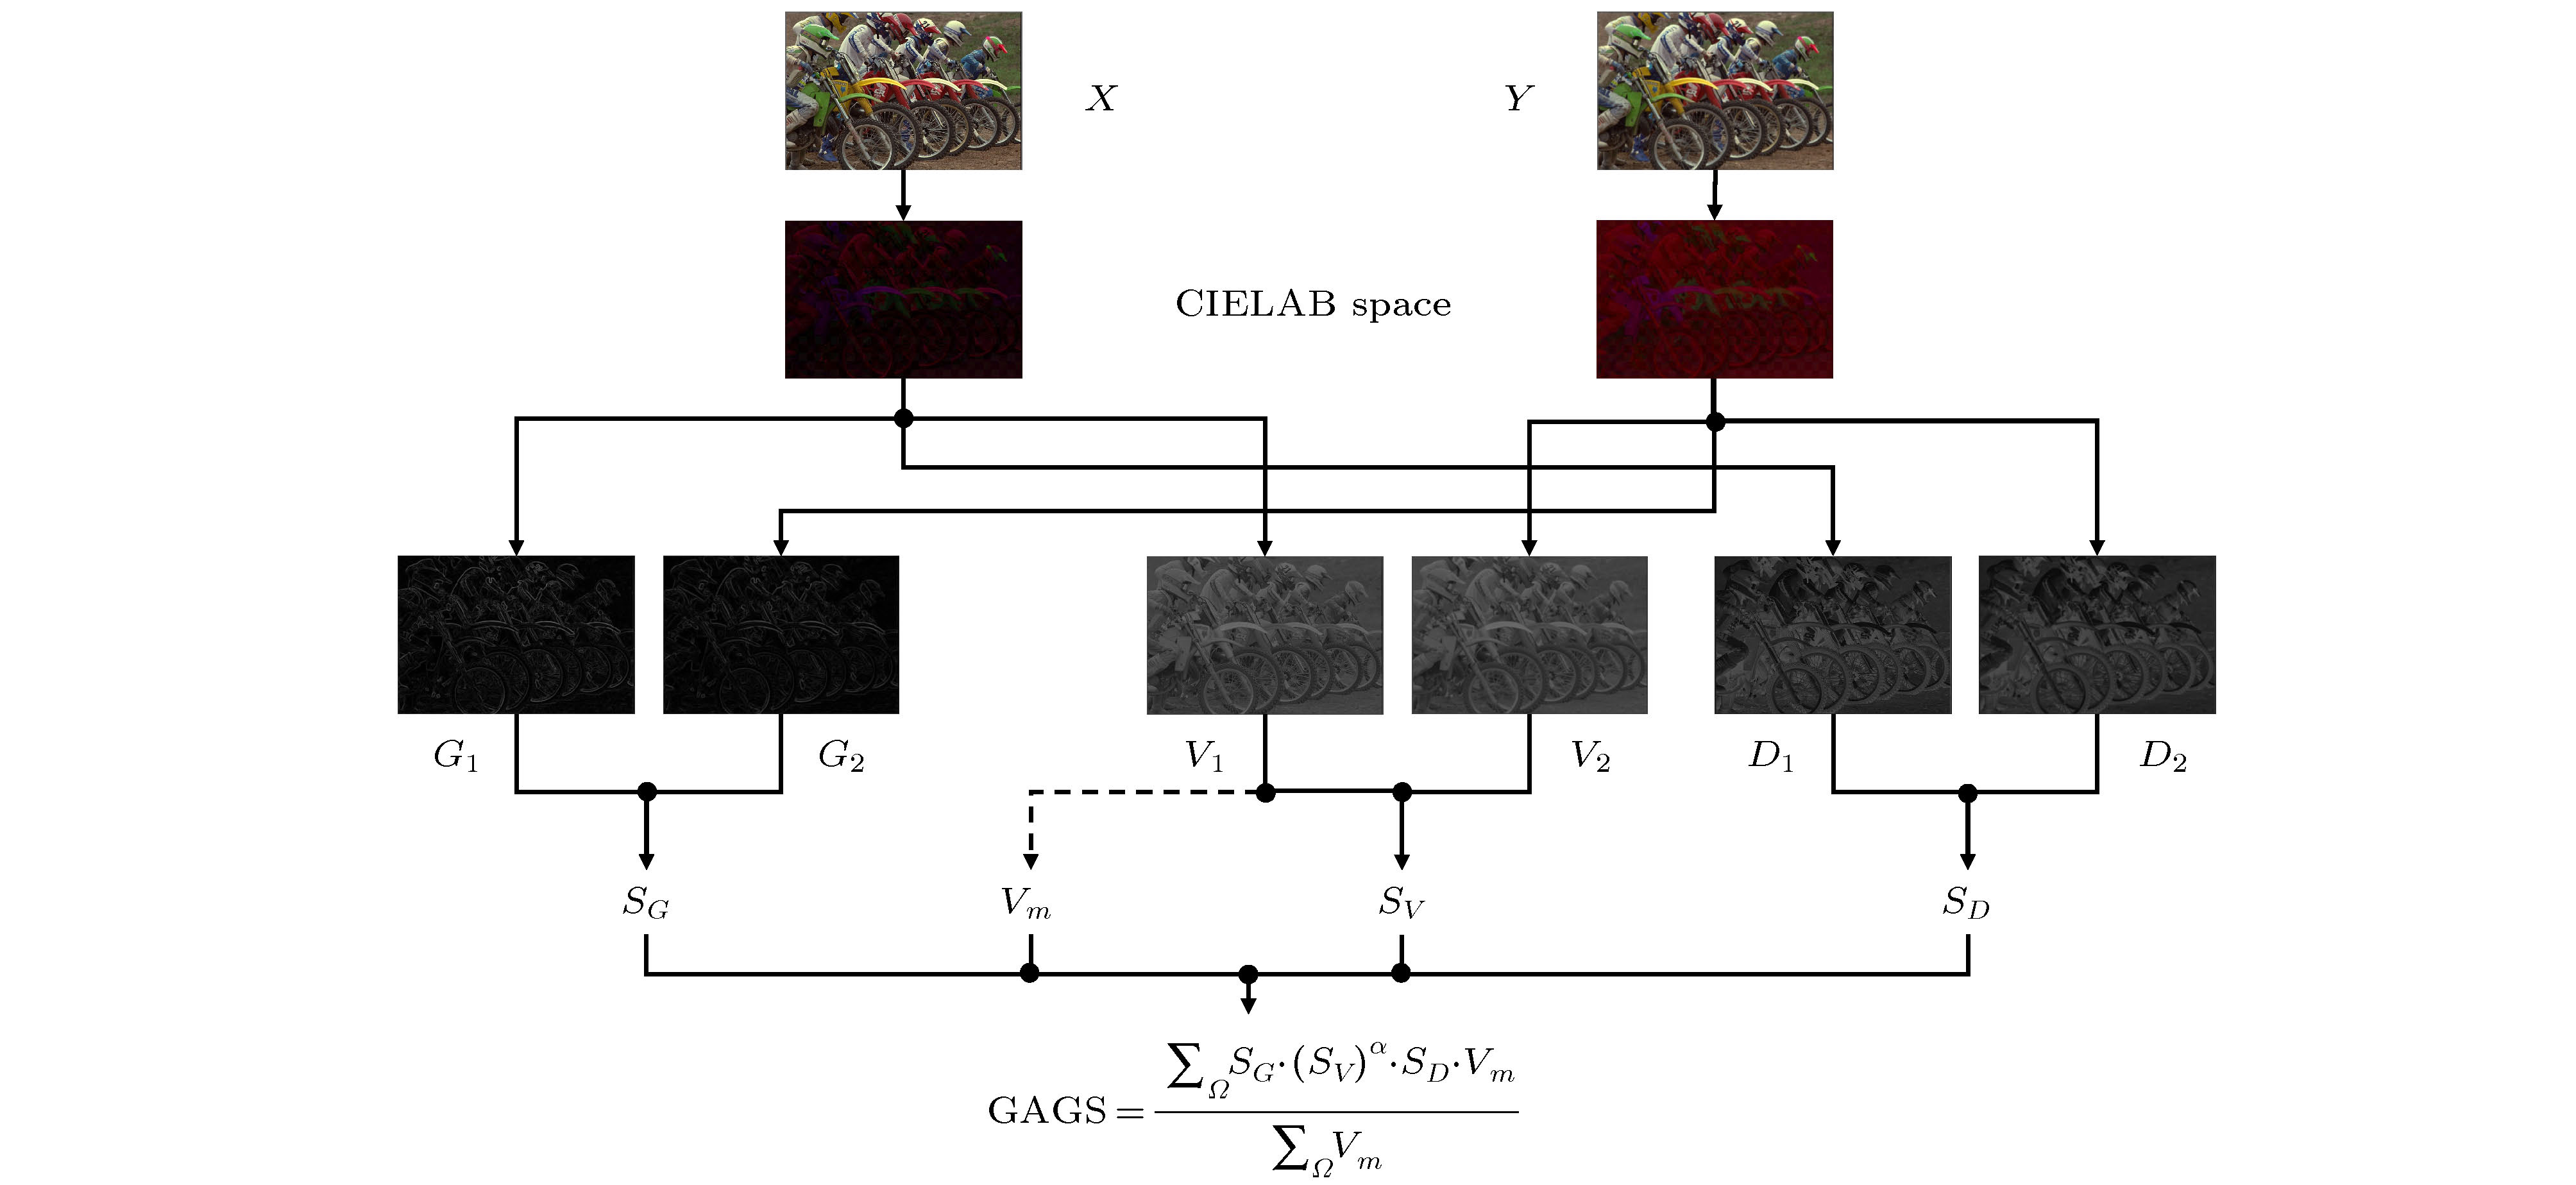
图 3 本文提出的IQA模型CAGS的计算过程
Figure 3. Illustration for the computational process of the proposed IQA model CAGS.
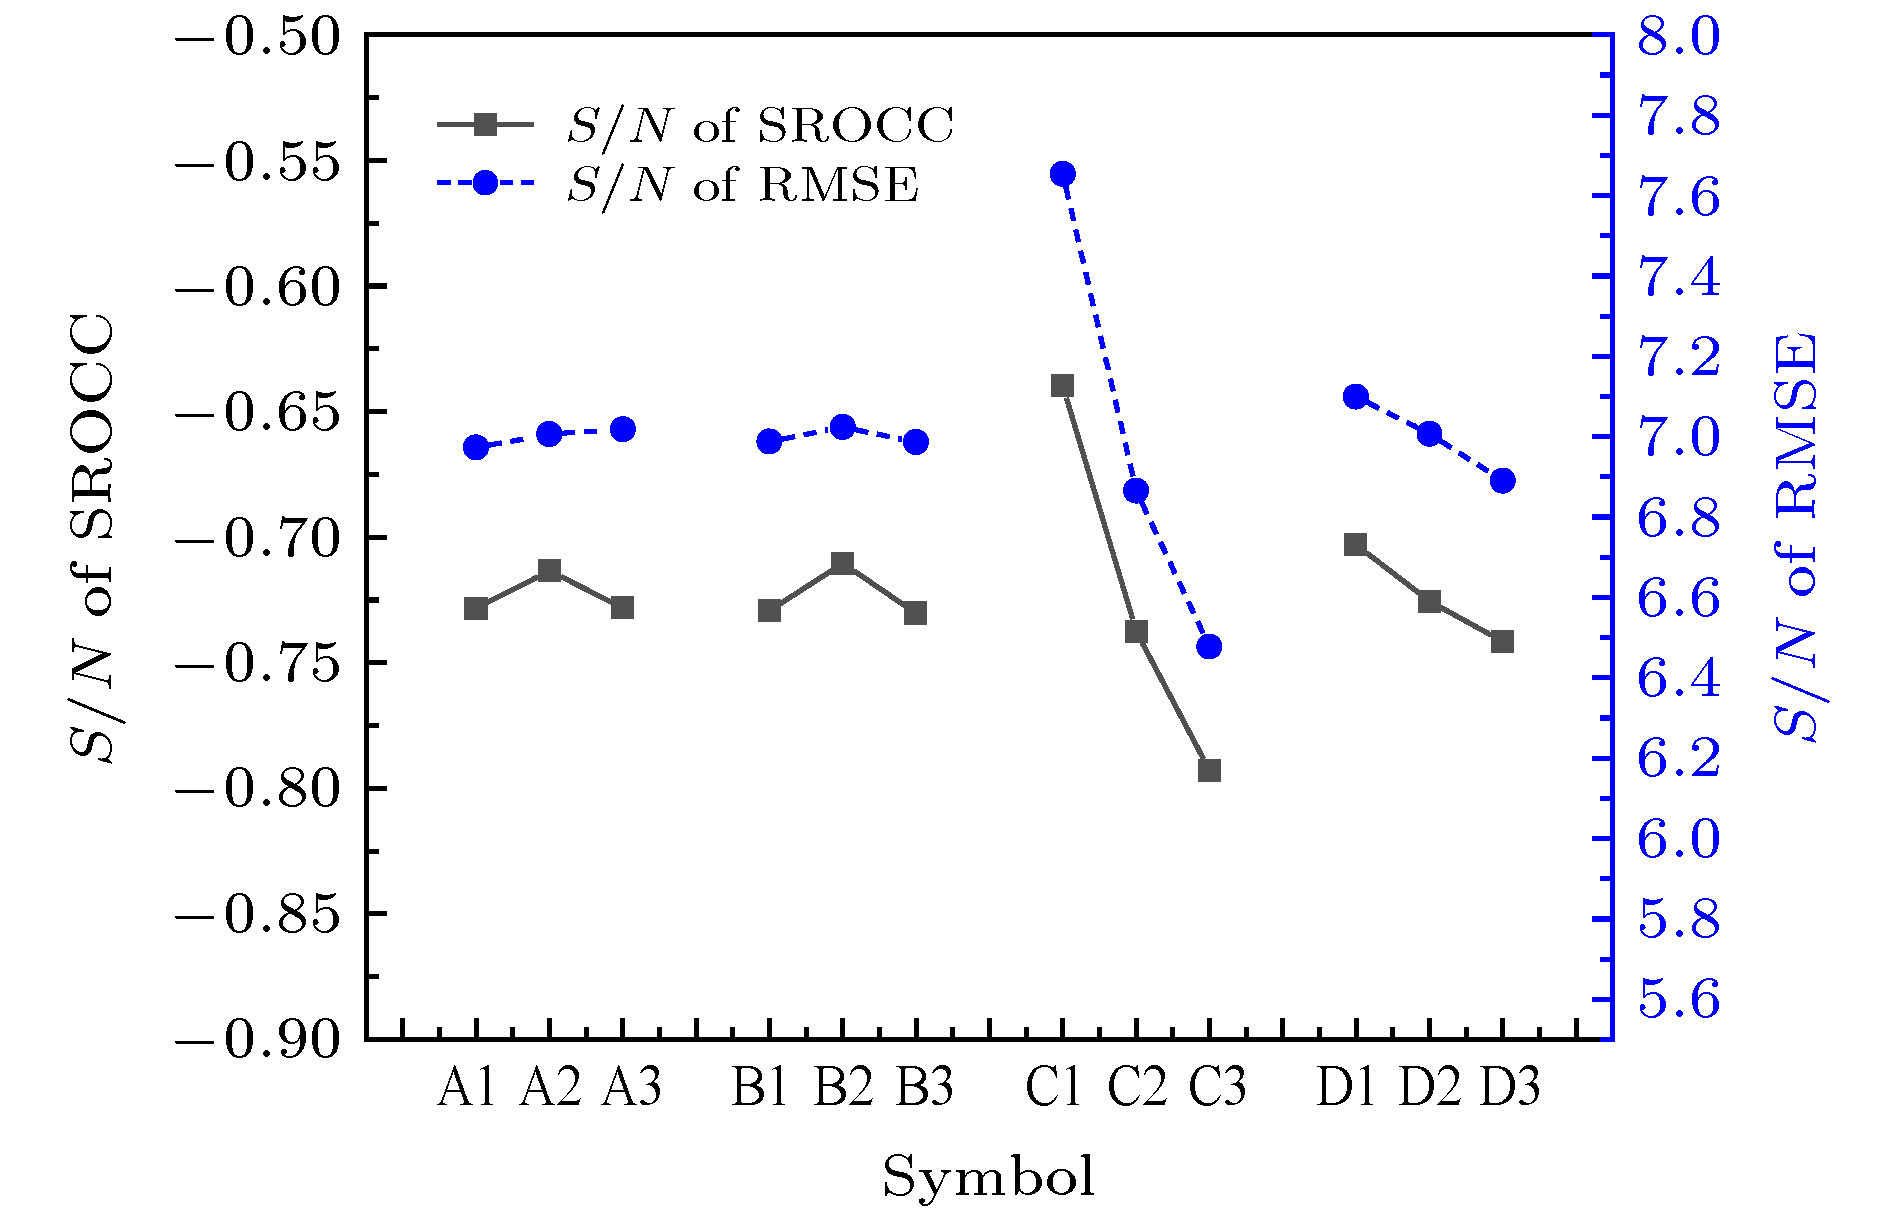
图 4 SROCC和RMSE对应的不同水准的S/N值
Figure 4. S/N ratio of different levels for SROCC and RMSE.

图 5 不同KG值对模型性能的影响
Figure 5. Performance of different KG values.

图 6 基于TID2013数据库的主观MOS与IQA模型计算结果拟合对比 (a) IW-SSIM; (b) IFC; (c) VIF; (d) MAD; (e) RFSIM; (f) FSIMc; (g) GSM; (h) CVSS; (i) CAGS
Figure 6. Scatter plots of subjective MOS against scores calculated by IQA models’ prediction for TID2013 databases: (a) IW-SSIM; (b) IFC; (c) VIF; (d) MAD; (e) RFSIM; (f) FSIMc; (g) GSM; (h) CVSS; (i) CAGS.
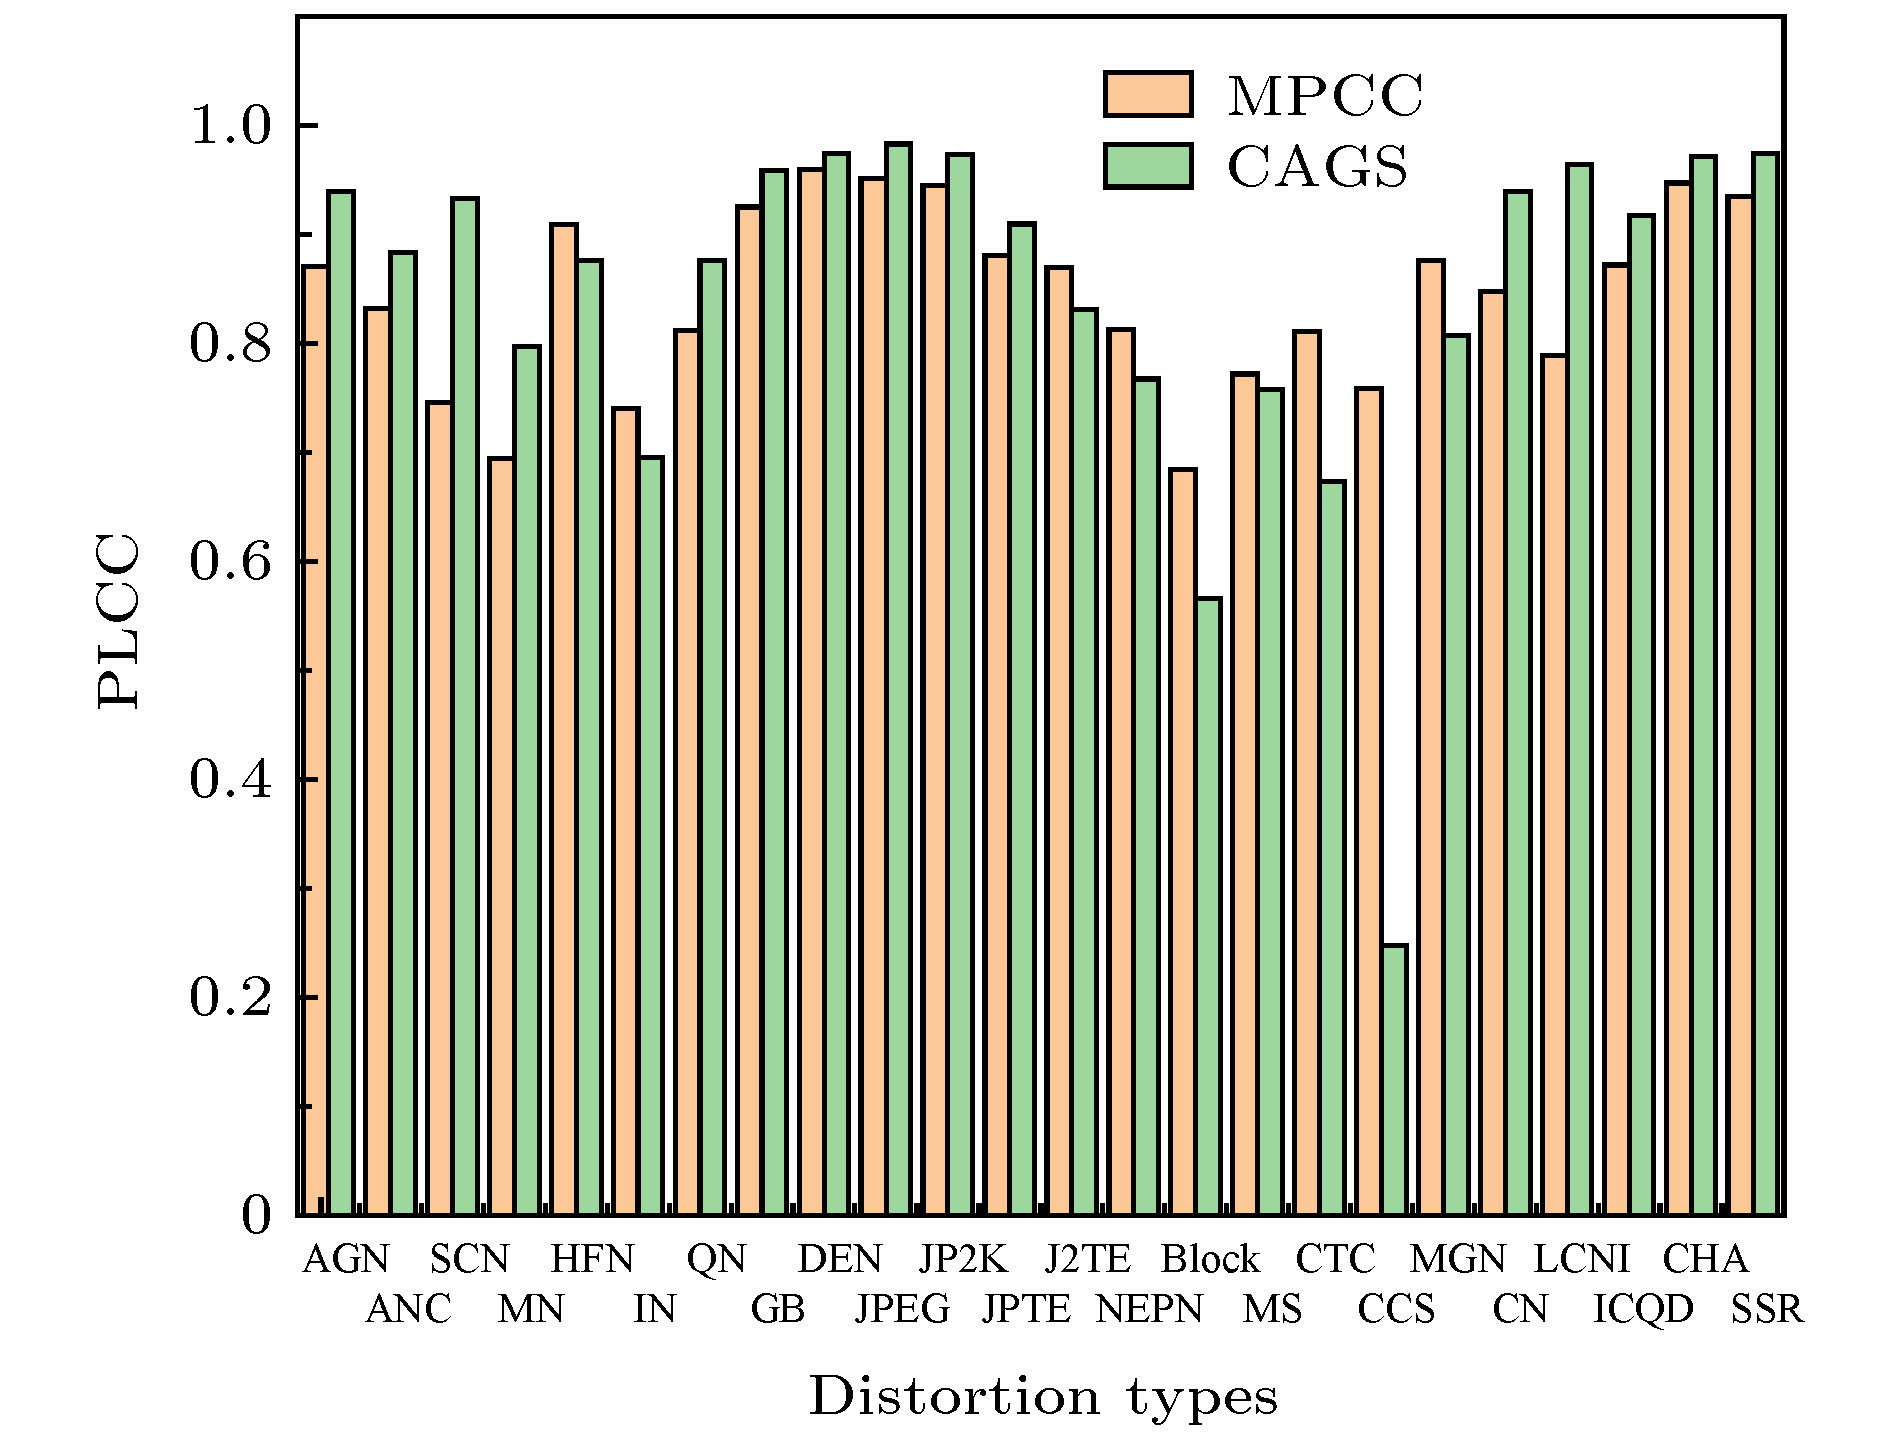
图 7 CAGS与MPCC在TID2013数据库种不同失真类型PLCC值对比
Figure 7. PLCC comparison of different distortion types between CAGS and MPCC on TID2013.
表 1 IQA数据库基本信息
Table 1. Benchmark test databases for IQA.
数据库 原始图像数量 失真图像数量 失真类型 观察者 TID2013 25 3000 24 971 CSIQ 30 866 6 35 LIVE 29 779 5 161 IVC 10 185 4 15  DownLoad: CSV
表 2 变量参数及其控制水准
Table 2. Influence factors and level setting for CAGS.
代号 参数表述 水准数 水准一 水准二 水准三 A KV 3 0.002 0.02 0.2 B KD 3 0.002 0.02 0.2 C KG 3 10 50 100 D α 3 0.1 0.5 1
DownLoad: CSV
表 3 采用L9(34)直交表的实验设计及IVC数据库测试结果
Table 3. Design with a L9(34) orthogonal array for IVC database.
实验序号 A B C D SROCC SROCC的S/N RMSE RMSE的S/N 1 1 1 1 1 0.9300 –0.6303 0.4113 7.7168 2 1 2 2 2 0.9192 –0.7318 0.4533 6.8723 3 1 3 3 3 0.9096 –0.8230 0.4825 6.3301 4 2 1 2 3 0.9171 –0.7517 0.4596 6.7524 5 2 2 3 1 0.9173 –0.7498 0.4672 6.6099 6 2 3 1 2 0.9291 –0.6388 0.4142 7.6558 7 3 1 3 2 0.9114 –0.8058 0.4735 6.4936 8 3 2 1 3 0.9279 –0.6500 0.4174 7.5890 9 3 3 2 1 0.9195 –0.7290 0.4481 6.9725
DownLoad: CSV
表 4 对比不同IQA模型的4个数据库性能
Table 4. Performance comparison of IQA models on four databases.
数据库 SSIM IW-SSIM IFC VIF MAD RFSIM FSIMC GSM CVSS MPCC Proposed TID2013 SROCC 0.7417 0.7779 0.5389 0.6769 0.7807 0.7744 0.8510 0.7946 0.8069 0.8452 0.8316 PLCC 0.7895 0.8319 0.5538 0.7720 0.8267 0.8333 0.8769 0.8464 0.8406 0.8616 0.8445 RMSE 0.7608 0.6880 1.0322 0.7880 0.6975 0.6852 0.5959 0.6603 0.6715 0.6293 0.6639 KROCC 0.5588 0.5977 0.3939 0.5147 0.6035 0.5951 0.6665 0.6255 0.6331 — 0.6469 CSIQ SROCC 0.8756 0.9213 0.7671 0.9195 0.9466 0.9295 0.9310 0.9108 0.9580 0.9569 0.9198 PLCC 0.8613 0.9144 0.8384 0.9277 0.9502 0.9179 0.9192 0.8964 0.9589 0.9586 0.9014 RMSE 0.1334 0.1063 0.1431 0.0980 0.0818 0.1042 0.1034 0.1164 0.0745 0.0747 0.1137 KROCC 0.6907 0.7529 0.5897 0.7537 0.7970 0.7645 0.7690 0.7374 0.8171 — 0.7487 LIVE SROCC 0.9479 0.9567 0.9259 0.9636 0.9669 0.9401 0.9599 0.9561 0.9672 0.9660 0.9734 PLCC 0.9449 0.9522 0.9268 0.9604 0.9675 0.9354 0.9503 0.9512 0.9651 0.9622 0.9640 RMSE 8.9455 8.3473 10.2643 7.6137 6.9073 9.6642 7.1997 8.4327 7.1573 7.4397 8.3251 KROCC 0.7963 0.8175 0.7579 0.8282 0.8421 0.7816 0.8366 0.8150 0.8406 — 0.8658 IVC SROCC 0.9018 0.9125 0.8993 0.8964 0.9146 0.8192 0.9293 0.8560 0.8836 — 0.9195 PLCC 0.9119 0.9231 0.9093 0.9028 0.9210 0.8361 0.9392 0.8662 0.8438 — 0.9298 RMSE 0.4999 0.4686 0.5069 0.5239 0.4746 0.6684 0.4183 0.6088 0.6538 — 0.4483 KROCC 0.7223 0.7339 0.7202 0.7158 0.7406 0.6452 0.7636 0.6609 0.6957 — 0.7488 权重平均 SROCC 0.8051 0.8376 0.6560 0.7750 0.8456 0.8306 0.8859 0.8438 0.8628 — 0.8737 PLCC 0.8321 0.8696 0.6786 0.8353 0.8752 0.8650 0.8987 0.8730 0.8820 — 0.8772 KROCC 0.6270 0.6662 0.5002 0.6158 0.6819 0.6575 0.7160 0.6775 0.7020 — 0.7044 直接平均 SROCC 0.8668 0.8921 0.7828 0.8641 0.9022 0.8658 0.9178 0.8794 0.9039 — 0.9111 PLCC 0.8769 0.9054 0.8071 0.8907 0.9164 0.8807 0.9214 0.8901 0.9021 — 0.9099 KROCC 0.6920 0.7255 0.6154 0.7031 0.7458 0.6966 0.7589 0.7097 0.7466 — 0.7526
DownLoad: CSV
表 5 IQA模型的不同失真类型SROCC值对比
Table 5. SROCC values of IQA models for different types of distortions.
数据库 失真类型 SSIM IW-SSIM IFC VIF MAD RFSIM FSIMC GSM CVSS MPCC Proposed TID2013 AGN 0.8671 0.8438 0.6612 0.8994 0.8843 0.8878 0.9101 0.9064 0.9401 0.8666 0.9359 ANC 0.7726 0.7515 0.5352 0.8299 0.8019 0.8476 0.8537 0.8175 0.8639 0.8187 0.8653 SCN 0.8515 0.8167 0.6601 0.8835 0.8911 0.8825 0.8900 0.9158 0.9077 0.7396 0.9276 MN 0.7767 0.8020 0.6932 0.8450 0.7380 0.8368 0.8094 0.7293 0.7715 0.7032 0.7526 HFN 0.8634 0.8553 0.7406 0.8972 0.8876 0.9145 0.9094 0.8869 0.9097 0.8957 0.9159 IN 0.7503 0.7281 0.6208 0.8537 0.2769 0.9062 0.8251 0.7965 0.7457 0.6747 0.8361 QN 0.8657 0.8468 0.6282 0.7854 0.8514 0.8968 0.8807 0.8841 0.8869 0.7931 0.8718 GB 0.9668 0.9701 0.8907 0.9650 0.9319 0.9698 0.9551 0.9689 0.9348 0.9218 0.9614 DEN 0.9254 0.9152 0.7779 0.8911 0.9252 0.9359 0.9330 0.9432 0.9427 0.9510 0.9466 JPEG 0.9200 0.9187 0.8357 0.9192 0.9217 0.9398 0.9339 0.9284 0.9521 0.8964 0.9585 JP2 K 0.9468 0.9506 0.9078 0.9516 0.9511 0.9518 0.9589 0.9602 0.9587 0.9160 0.9620 JPTE 0.8493 0.8388 0.7425 0.8409 0.8283 0.8312 0.8610 0.8512 0.8613 0.8571 0.8644 J2 TE 0.8828 0.8656 0.7769 0.8761 0.8788 0.9061 0.8919 0.9182 0.8851 0.8409 0.9250 NEPN 0.7821 0.8011 0.5737 0.7720 0.8315 0.7705 0.7937 0.8130 0.8201 0.7753 0.7833 Block 0.5720 0.3717 0.2414 0.5306 0.2812 0.0339 0.5532 0.6418 0.5152 0.5396 0.6015 MS 0.7752 0.7833 0.5522 0.6276 0.6450 0.5547 0.7487 0.7875 0.7150 0.7520 0.7441 CTC 0.3775 0.4593 0.1798 0.8386 0.1972 0.3989 0.4679 0.4857 0.2940 0.7814 0.4514 CCS 0.4141 0.4196 0.4029 0.3009 0.0575 0.0204 0.8359 0.3578 0.2614 0.7054 0.3711 MGN 0.7803 0.7728 0.6143 0.8486 0.8409 0.8464 0.8569 0.8348 0.8799 0.8766 0.8700 CN 0.8566 0.8762 0.8160 0.8946 0.9064 0.8917 0.9135 0.9124 0.9351 0.8174 0.9168 LCNI 0.9057 0.9037 0.8160 0.9204 0.9443 0.9010 0.9485 0.9563 0.9629 0.8095 0.9574 ICQD 0.8542 0.8401 0.6006 0.8414 0.8745 0.8959 0.8815 0.8973 0.9108 0.8596 0.9060 CHA 0.8775 0.8682 0.8210 0.8848 0.8310 0.8990 0.8925 0.8823 0.8523 0.8094 0.8768 SSR 0.9461 0.9474 0.8885 0.9353 0.9567 0.9326 0.9576 0.9668 0.9605 0.9178 0.9580 CSIQ AWGN 0.8974 0.9380 0.8431 0.9575 0.9541 0.9441 0.9359 0.9440 0.9670 0.9329 0.9652 JPEG 0.9543 0.9662 0.9412 0.9705 0.9615 0.9502 0.9664 0.9632 0.9689 0.9564 0.9573 JP2 K 0.9605 0.9683 0.9252 0.9672 0.9752 0.9643 0.9704 0.9648 0.9777 0.9630 0.9545 AGPN 0.8924 0.9059 0.8261 0.9511 0.9570 0.9357 0.9370 0.9387 0.9516 0.9517 0.9492 GB 0.9608 0.9782 0.9527 0.9745 0.9602 0.9643 0.9729 0.9589 0.9789 0.9664 0.9574 CTC 0.7925 0.9539 0.4873 0.9345 0.9207 0.9527 0.9438 0.9354 0.9324 0.9399 0.9273 LIVE JP2 K 0.9614 0.9649 0.9113 0.9696 0.9676 0.9323 0.9724 0.9700 0.9719 0.9608 0.9822 JPEG 0.9764 0.9808 0.9468 0.9846 0.9764 0.9584 0.9840 0.9778 0.9836 0.9674 0.9836 AWGN 0.9694 0.9667 0.9382 0.9858 0.9844 0.9799 0.9716 0.9774 0.9809 0.9457 0.9837 GB 0.9517 0.9720 0.9584 0.9728 0.9465 0.9066 0.9708 0.9518 0.9662 0.9561 0.9641 FF 0.9556 0.9442 0.9629 0.9650 0.9569 0.9237 0.9519 0.9402 0.9592 0.9627 0.9633
DownLoad: CSV
表 6 计算复杂度对比
Table 6. Time cost comparisons.
IQA模型 运行时间/s IQA模型 运行时间/s PSNR 0.0186 RFSIM 0.1043 SSIM 0.0892 FSIMc 0.3505 IW-SSIM 0.6424 GSM 0.1018 IFC 1.1554 CVSS 0.0558 VIF 1.1825 MPCC — MAD 2.7711 CAGS 0.4814
DownLoad: CSV
-
[1] 姚军财, 刘贵忠 2018 物理学报 67 108702
Google Scholar
Yao J C, Liu G Z 2018 Acta Phys. Sin. 67 108702
Google Scholar
[2] Athar S, Wang Z 2019 IEEE Access 7 140030
Google Scholar
[3] Lin W S, Kuo C C J 2011 J. Vis. Commun. Image R. 22 297
Google Scholar
[4] Chang H W, Zhang Q W, Wu Q G, Gan Y 2015 Neurocomputing 151 1142
Google Scholar
[5] Wang Z, Bovik A C, Sheikh H R, Simoncelli E P 2004 IEEE Trans. Image Process. 13 600
Google Scholar
[6] Sheikh H R, Bovik A C 2006 IEEE Trans. Image Process. 15 430
Google Scholar
[7] Sheikh H R, Bovik A C, de Veciana G 2005 IEEE Trans. Image Process. 14 2117
Google Scholar
[8] Wang Z, Simoncelli E P, Bovik A C 2003 37th Asilomar Conference on Signals, Systems and Computer PacificGrove, CA, November 9−12, 2003 pp1398−1402
[9] Wang Z, Li Q 2011 IEEE Trans. Image Process. 20 1185
Google Scholar
[10] Larson E C, Chandler D M 2010 J. Electron. Imaging 19 011006
Google Scholar
[11] Zhang L, Zhang L, Mou X Q 2010 IEEE International Conference on Image Processing Hong Kong, Peoples of China, September 26−29, 2010 pp321−324
[12] Zhang L, Zhang L, Mou X Q, Zhang D 2011 IEEE Trans. Image Process. 20 2378
Google Scholar
[13] Liu A M, Lin W S, Narwaria M 2012 IEEE Trans. Image Process. 21 1500
Google Scholar
[14] Jia H Z, Zhang L, Wang T H 2018 IEEE Access 6 65885
Google Scholar
[15] 姚军财, 申静 2020 物理学报 69 148702
Google Scholar
Yao J C, Shen J 2020 Acta Phys. Sin. 69 148702
Google Scholar
[16] Robertson A R 1990 Color Res. Appl. 15 167
Google Scholar
[17] Mahny M, Vaneycken L, Oosterlinck A 1994 Color Res. Appl. 19 105
[18] Lee D, Plataniotis K N 2015 IEEE Trans. Image Process. 24 3950
Google Scholar
[19] Lee D, Plataniotis K N 2014 2014 International Conference on Acoustics, Speech and Signal Processing (ICASSP) Florence, Italy, May 4−9, 2014 pp166−170
[20] Berns R S 2014 Color Res. Appl. 39 322
Google Scholar
[21] Zhang L, Shen Y, Li H Y 2014 IEEE Trans. Image Process. 23 4270
Google Scholar
[22] Jain R C, Kasturi R, Schunck B G 1995 Machine Vision (New York: McGraw-Hill) pp140–185
[23] Sonka M, Hlavac V, Boyle R 2008 Image Processing, Analysis and Machine Vision (3rd Ed.) (Stanford: Cengage Learning) p77
[24] Xue W F, Zhang L, Mou X Q, Bovik A C 2014 IEEE Trans. Image Process. 23 684
Google Scholar
[25] Kim D O, Han H S, Park R H 2010 IEEE Trans. Consum. Electr. 56 930
Google Scholar
[26] Nafchi H Z, Shahkolaei A, Hedjam R, Cheriet M 2016 IEEE Access 4 5579
Google Scholar
[27] Taguchi G, Yokoyama Y, Wu Y 1993 Taguchi Methods, Design of experiments (Dearbon, MI: ASI Press) pp59−63
[28] Ponomarenko N, Jin L, Ieremeiev O, Lukin V, Egiazarian K, Astola J, Vozel B, Chehdi K, Carli M, Battisti F, Kuo C C J 2015 Signal Process. Image Commun. 30 57
Google Scholar
[29] Larson E C, Chandler D M http://vision.eng.shizuoka.ac.jp/mod/page/view.php?id=23[2020-7-13]
[30] Sheikh H R, Sabir M F, Bovik A C 2006 IEEE Trans. Image Process. 15 3440
Google Scholar
[31] Ninassi A, Le Callet P, Autrusseau F 2006 Conference on Human Vision and Electronic Imaging Ⅺ San Jose, CA, USA, January 16–18, 2006 p1
[32] Wang S Q, Gu K, Zeng K, Wang Z, Lin W S 2016 Proc. SPIE 6057 Comput. Graph. Appl. 38 47
Google Scholar
[33] Lin C H, Wu C C, Yang P H, Kuo T Y 2009 J. Disp. Technol. 5 323
Google Scholar
[34] Preiss J, Fernandes F, Urban P 2014 IEEE Trans. Image Process. 23 1366
Google Scholar


 DownLoad:
Catalog
Metrics
- Abstract views: 5891
- PDF Downloads: 116
- Cited By: 0
