


-
The ground level enhancement (GLE) event energy spectrum provides important information about the acceleration and propagation of cosmic ray. In this paper, we analyze the proton flux peak energy spectrum of recent GLE event (2017.09 GLE72) by using GOES15 satellite and neutron monitor experiment data. The method of adjacent averaging smoothing and weighted average are applied to study GOES15 satellite data, and obtain the flux peak and flux peak time. By fitting, the energy spectrum index of proton flux peak is 1.88 in the satellite observation energy range. Again, the energy spectrum index of the neutron monitor observation energy range, 4.86, is obtained by using the new neutron monitor yield function. It can be seen that the peak energy spectrum index given by satellites in the lower energy range (5–433 MeV) is much smaller than that given by the neutron monitor in the higher energy range (0.44–19 GeV). This means that, the energy spectrum in the lower energy range is harder than that in the higher energy range. Hence, the results of the energy spectrum could be explained qualitatively by the re-acceleration mechanism of high energy solar particles. In the low corona region, first, the particles released by the solar flare are accelerated, and the energy spectrum index of the high-energy range is twice that of the low-energy range. Then part of the solar high energy particles from the low corona enter into the CME, where they will be re-acceleration by the shock wave. The GLE72 event high energy range energy spectrum index given by the neutron monitor experiment is 4.86, so the energy spectrum index in low energy range should be 4.86/2 = 2.43. However, the low energy range energy spectrum index is 1.88 (lower than 2.43 in low energy range). The reason may be that the energy spectrum index is further reduced due to the re-acceleration effect in the shock wave generated by the CME. The observation of GLE event is one of the main research subjects of the Large High Altitude Air Shower Observatory (LHAASO). Also, the GLE72 proton peak energy spectrum results provide important information to observe solar high energy particles in the LHAASO experiment.
-
Keywords:
- solar cosmic rays /
- energy spectrum /
- GLE event
[1] Hess V F 1912 Phys. Z. 13 1084
[2] Simpson J A 1990 Proceedings of the 21th International Cosmic Ray Conference Adelaide, Australia, January 6–19, 1990 p187
[3] Auger P, Ehrenfest P, Maze R 1939 Rev. Mod. Phys. 11 288
 Google Scholar
[4] Karpov S N, Miroshnichenko L I, Vashenyuk E V 1998 Nuovo Cimento C 21 551
[5] Shea M A, Smart D F 1990 Sol. Phys. 127 297
[6] Forbush S E 1946 Phys. Rev. 70 771
[7] Oh S Y, Yi Y, Bieber J W 2010 J. Geophys. Res. Space Phys. 115 A10107
[8] Vashenyuk E V, Balabin Y V, Perez-Peraza J, Gallegos-Cruz A, Miroshnichenko L I 2006 Adv. Space Res. 38 411
[9] Mottl D, Nymmik R 2007 Adv. Space Res. 39 1355
Google Scholar
[10] Bruno A, Christian E R, De Nolfo G A, Richardson I G, Ryan J M 2019 Space Weather 17 419
Google Scholar
[11] Gopalswamy N, Yashiro S, Mäkelä P, Xie H, Akiyama S, Monstein C 2018 Astrophys. J. Lett. 863 L39
Google Scholar
[12] Mishev A, Usoskin I, Raukunen O, Paassilta M, Valtonen E, Kocharov L, Vainio R 2018 Sol. Phys. 293 136
Google Scholar
[13] Mishev A L, Usoskin I G, Kovaltsov G A 2013 J. Geophys. Res. Space Phys. 118 2783
Google Scholar
[14] Dorman L, Tassev Y, Velinov P I Y, Mishev A, Tomova D, Mateev L 2019 J. Phys. Conf. Ser. 1181 012070
Google Scholar
[15] Mavromichalaki H, Gerontidou M, Paschalis P 2018 Space Weather 16 1797
Google Scholar
[16] Shea M A, Smart D F 2012 Space Sci. Rev. 171 161
Google Scholar
[17] Abbasi R, Ackermann M, Adams J 2008 Astrophys. J. 689 L65
Google Scholar
[18] Mishev A L, Kocharov L G, Usoskin I G 2014 J. Geophys. Res. Space Phys. 119 670
Google Scholar
[19] Lockwood J A, Webber W R, Hsieh L 1974 J. Geophys. Res. 79 4149
Google Scholar
[20] Aguilar M, Aisa D, Alpat B 2015 Phys. Rev. Lett. 114 171103
Google Scholar
[21] Aguilar M, Aisa D, Alpat B 2015 Phys. Rev. Lett. 15 211101
Google Scholar
[22] Petrosian V 2016 Astrophys. J. 830 28
Google Scholar
[23] Ramaty R, Forman M A 1987 NASA Conference Publication 2464 47
[24] Dröege W, Schlickeiser R 1986 Astrophys. J. 305 909
Google Scholar
[25] Tassev Y, Velinov P I Y, Tomova D, Mateev L 2017 C.R. Acad. Bulg. Sci. 70 1437
[26] Ellison D C, Ramaty R 1985 Astrophys. J. 298 400
Google Scholar
-
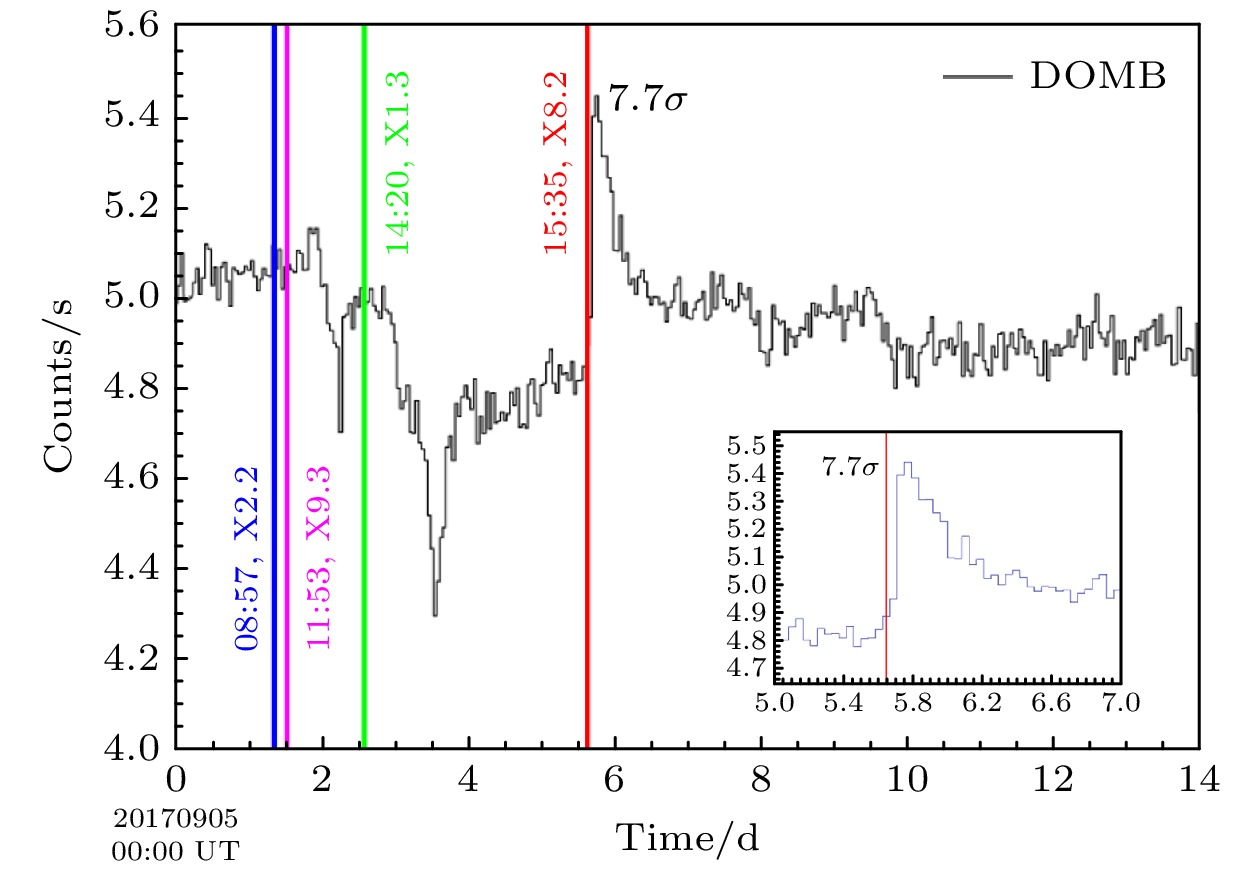
图 1 地面中子堆DOMB站点在2017年9月5—18日的计数率(1小时平均)随时间的变化. X2.2级耀斑爆发于2017年9月6日08:57 UT (蓝色竖线), X9.3级耀斑爆发于2017年9月6日11:53 UT (粉色竖线), X1.3级耀斑爆发于2017年9月7日14:20 UT (绿色竖线), X8.2级耀斑爆发于2017年9月9日15:35 UT (红色竖线). GLE72事件的显著性为
$ 7.7\sigma $ Figure 1. Count-rate (hour averaged) variation of the DOMB on September 5–18, 2017. X2.2 flares erupt at 08:57 UT (blue) on September 6, 2017, X9.3 flares break out at 11:53 UT (pink) on September 6, 2017, X1.3 flares explode at 14:20 UT (green) on September 7, 2017, and X8.2 flare burst out at 15:35 UT (red) on September 9, 2017. The significance of GLE72 event is
$ 7.7\sigma $ .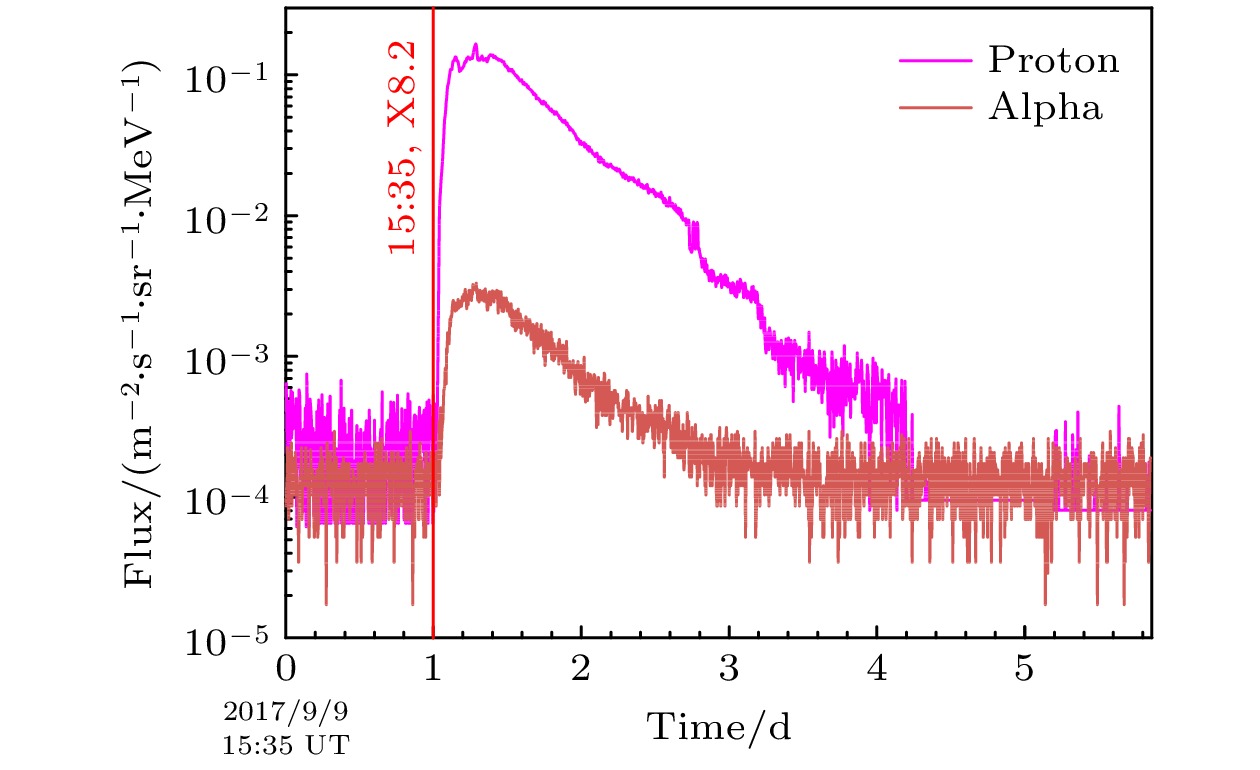
图 2 GOES15卫星的EPEAD-A记录的能量为433 MeV的Proton (紫色)和Alpha (土红色)流强(5 min)随时间变化. 红色竖线表示2017年9月10日15:35 UT X8.2级耀斑爆发时刻
Figure 2. Profile of the time of Proton (purple) and Alpha (earth red) flux (433 MeV, 5 min) recorded by the EPEAD-A of GOES15 satellite. The red line indicates the X8.2 flare at 15:35 UT on September 10, 2017.
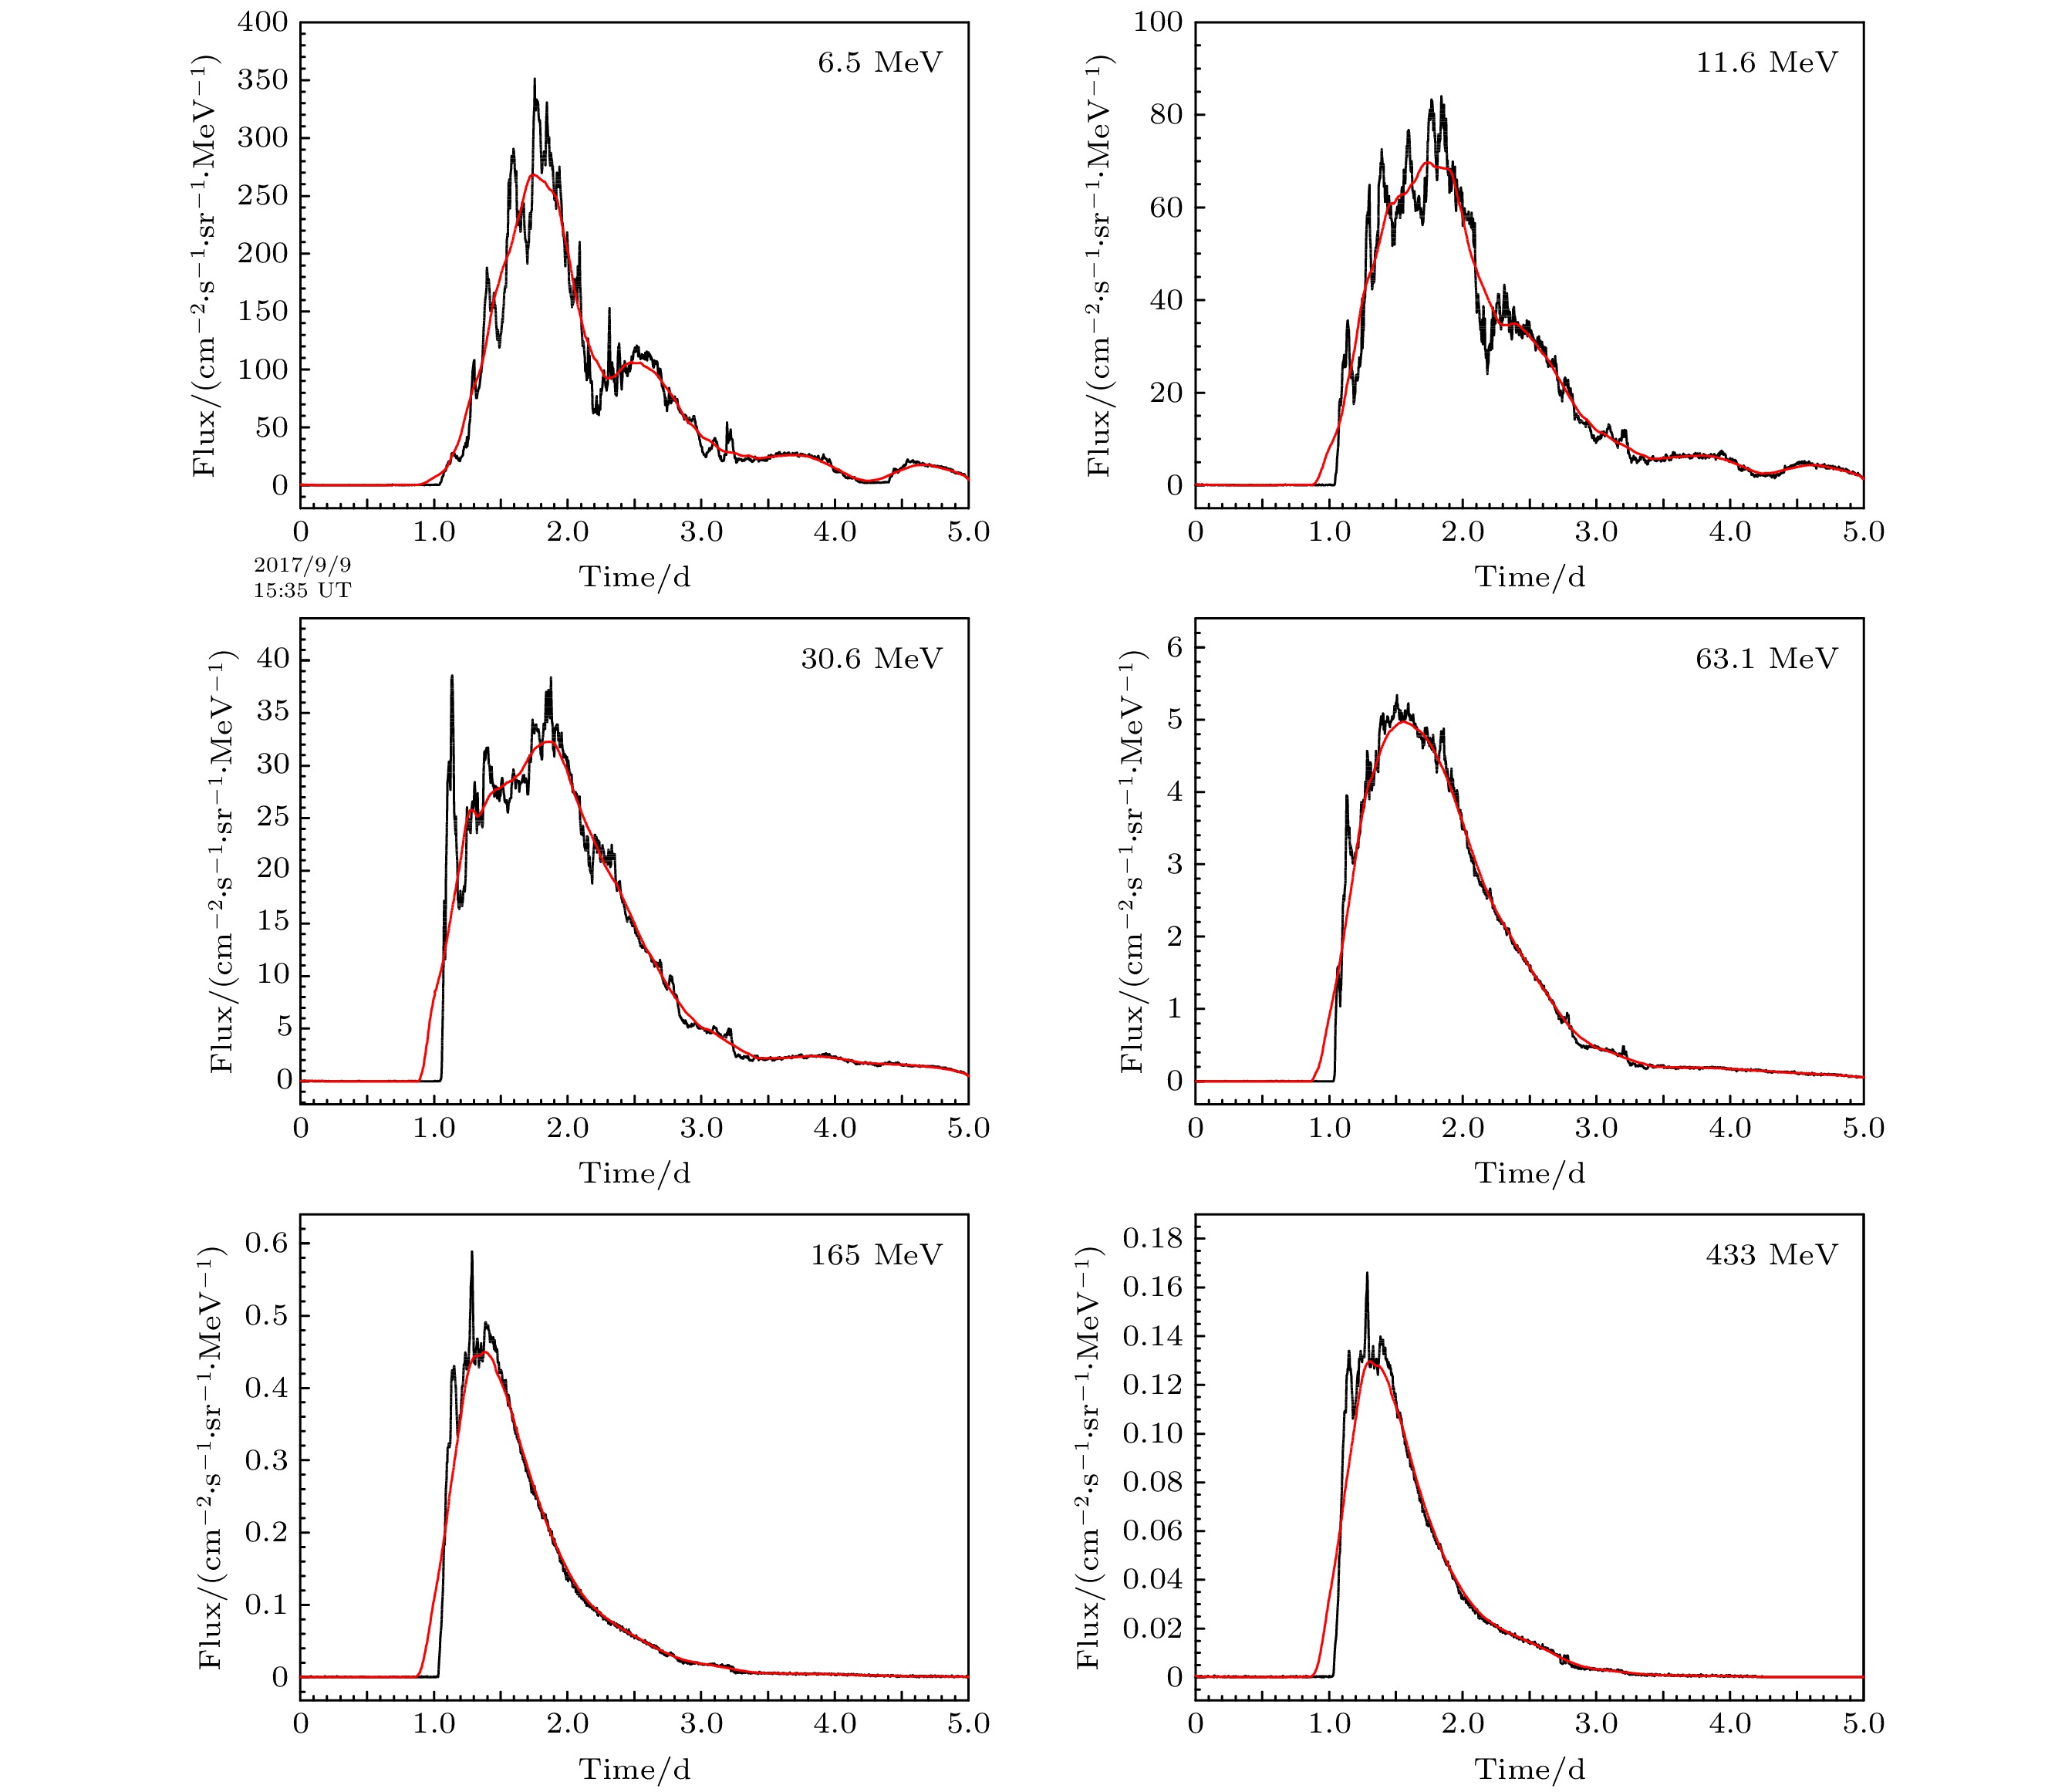
图 3 GOES15卫星的EPEAD-A仪器测量的6个粒子能量通道(6.5, 11.6, 30.6, 63.1, 165, 433 MeV)的质子的流强随时间变化(黑色), 红色为平滑结果
Figure 3. Profile of the time of proton flux (black) in the six channels (6.5, 11.6, 30.6, 63.1 165, 433 MeV). The red line is the result obtained by Smoothing.
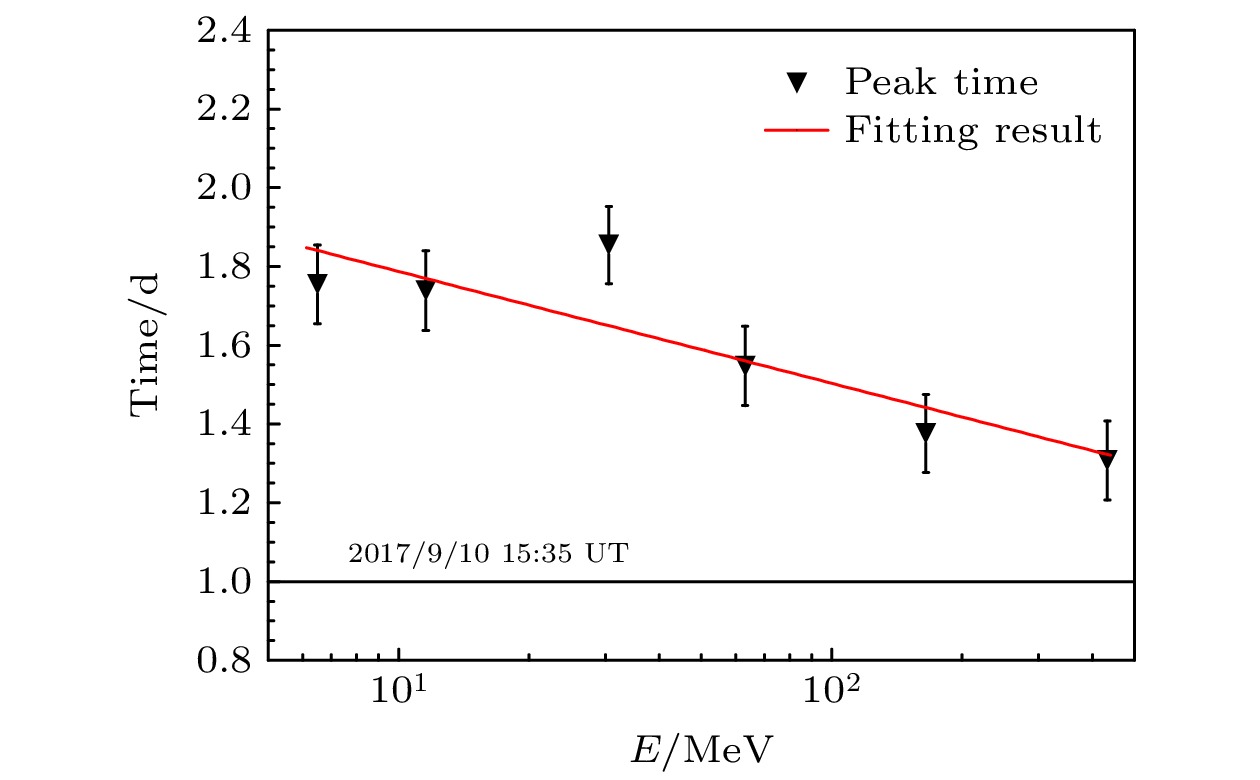
图 4 各能量点峰值时间随能量的变化. 其中纵坐标1表示2017年9月10日15:35 UT耀斑爆发的时刻(黑色实线). 下三角为加权平均法得到的GOES15卫星各能量点流强到达峰值的时刻, 红色实线为下三角数据点拟合结果
Figure 4. Peak time as a function of the energy. The black solid line indicates the X8.2 flare at 15:35 UT on September 10, 2017. The lower triangle refers to the time of flux peak in different energies, which is obtained by the weighted average method. The red solid line is the fitting result.
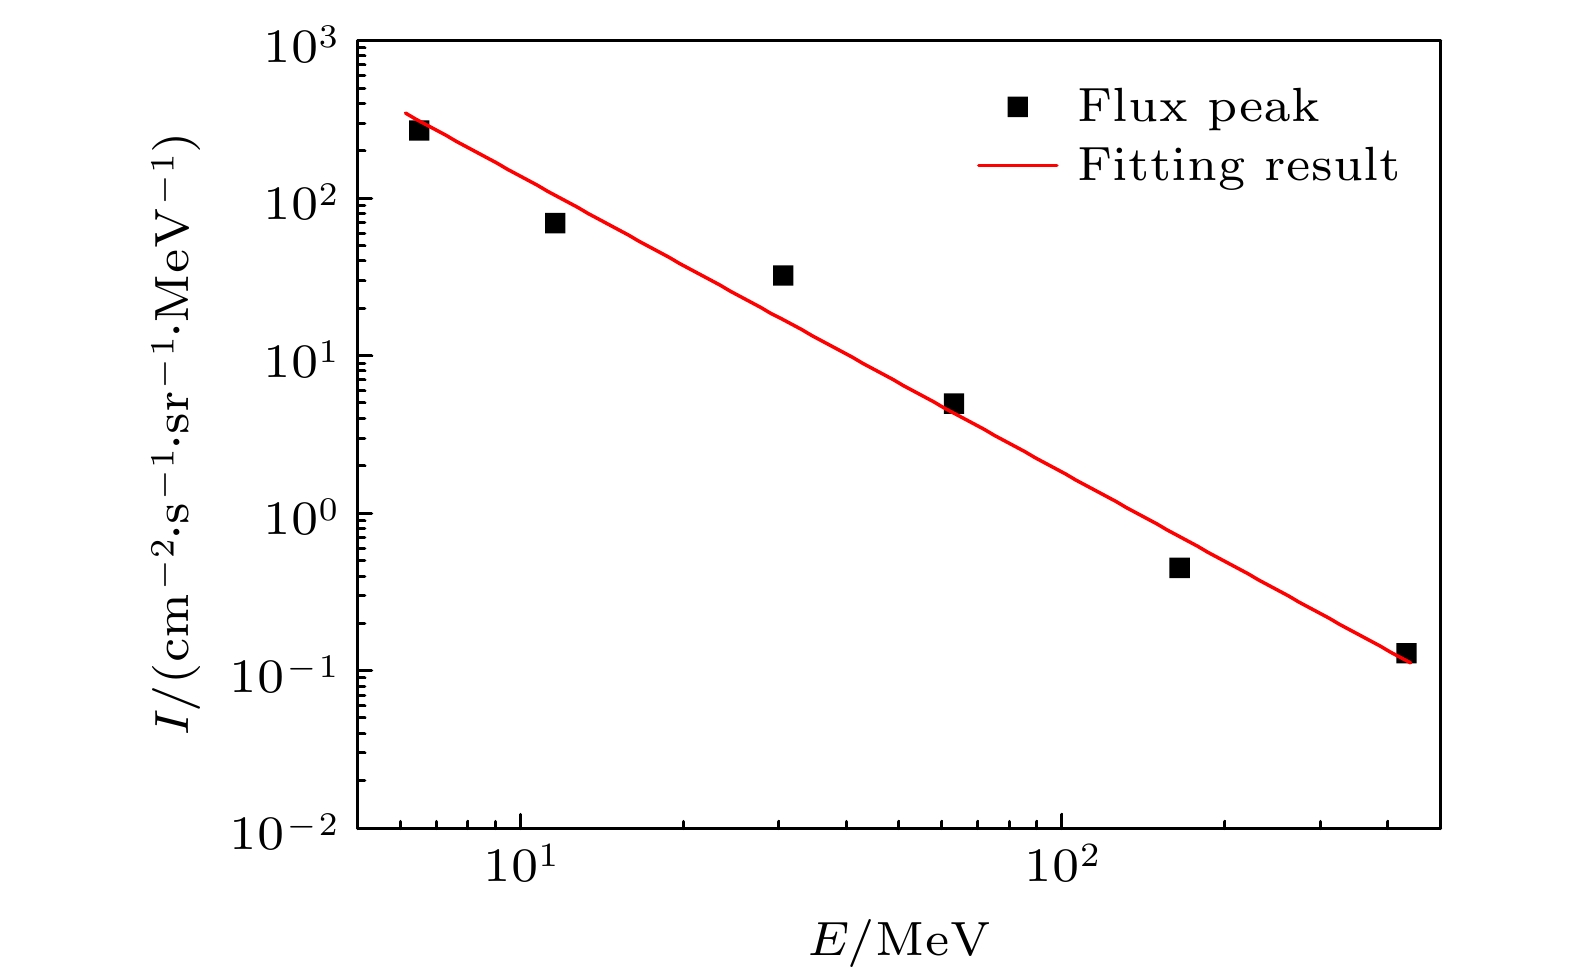
图 5 各能量点流强峰值随能量的变化. 黑正方形为平滑得到的GOES15卫星各能量点的流强峰值, 红色实线为黑正方形数据点(带有误差)拟合结果
Figure 5. Flux peak as a function of energy. The black square refers to flux peak in different energies obtained by Smoothing. The red solid line is the fitting result (with error).

图 6 GLE72事件质子峰值能谱. GOES15卫星各能点(6.5, 11.6, 30.6, 63.1, 165, 433 MeV)的流强峰值(黑色方块), GOES15卫星各能量点流强峰值随能量变化的拟合结果(红色实线), GOES15卫星峰值能谱延长至100 GeV的流强随能量变化(红色实线段). GOES15卫星在各个能量点的各个时间17:00 UT(上三角)、17:30 UT(下三角)、18:00 UT(圆形)、18:30 UT(五角形)、19:00 UT(十字架)的流强. 中子堆实验数据计算得到的峰值能谱(粉色实线), 中子堆峰值能谱延长到100 GeV流强随能量的变化(粉色线段). Mashev等[12]给出的不同时间(17:00, 17:30, 18:00, 18:30, 19:00 UT) 的能谱(虚线). AMS02卫星测量银河宇宙线H[20]和He[21]的能谱(黑色实线)
Figure 6. Proton peak energy spectrum of GLE72 event. The flux peak (black block) of GOES15 satellite in different energies (6.5, 11.6, 30.6, 63.1, 165, 433 MeV). Fitting results of flux peak in different energies (red solid line). The flux of GOES15 satellite with the peak energy spectrum extending to 100 GeV as a function of energy (red line segment). The flux of GOES15 satellite in different energies and times [17:00 UT (upper triangle), 17:30 UT (lower triangle), 18:00 UT (circle), 18:30 UT (pentagonal), 19:00 UT (cross)]. The peak energy spectrum obtained from the experimental data of the neutron monitor (pink solid line). The flux of neutron monitor with the peak energy spectrum extending to 100 GeV as a function of energy (pink line segment). Energy spectra (dashed lines) at different times given by Mashev et al.[12]. The result of the energy spectrum of the galactic cosmic rays H[20] and He[21] measured by AMS02 satellite (black).
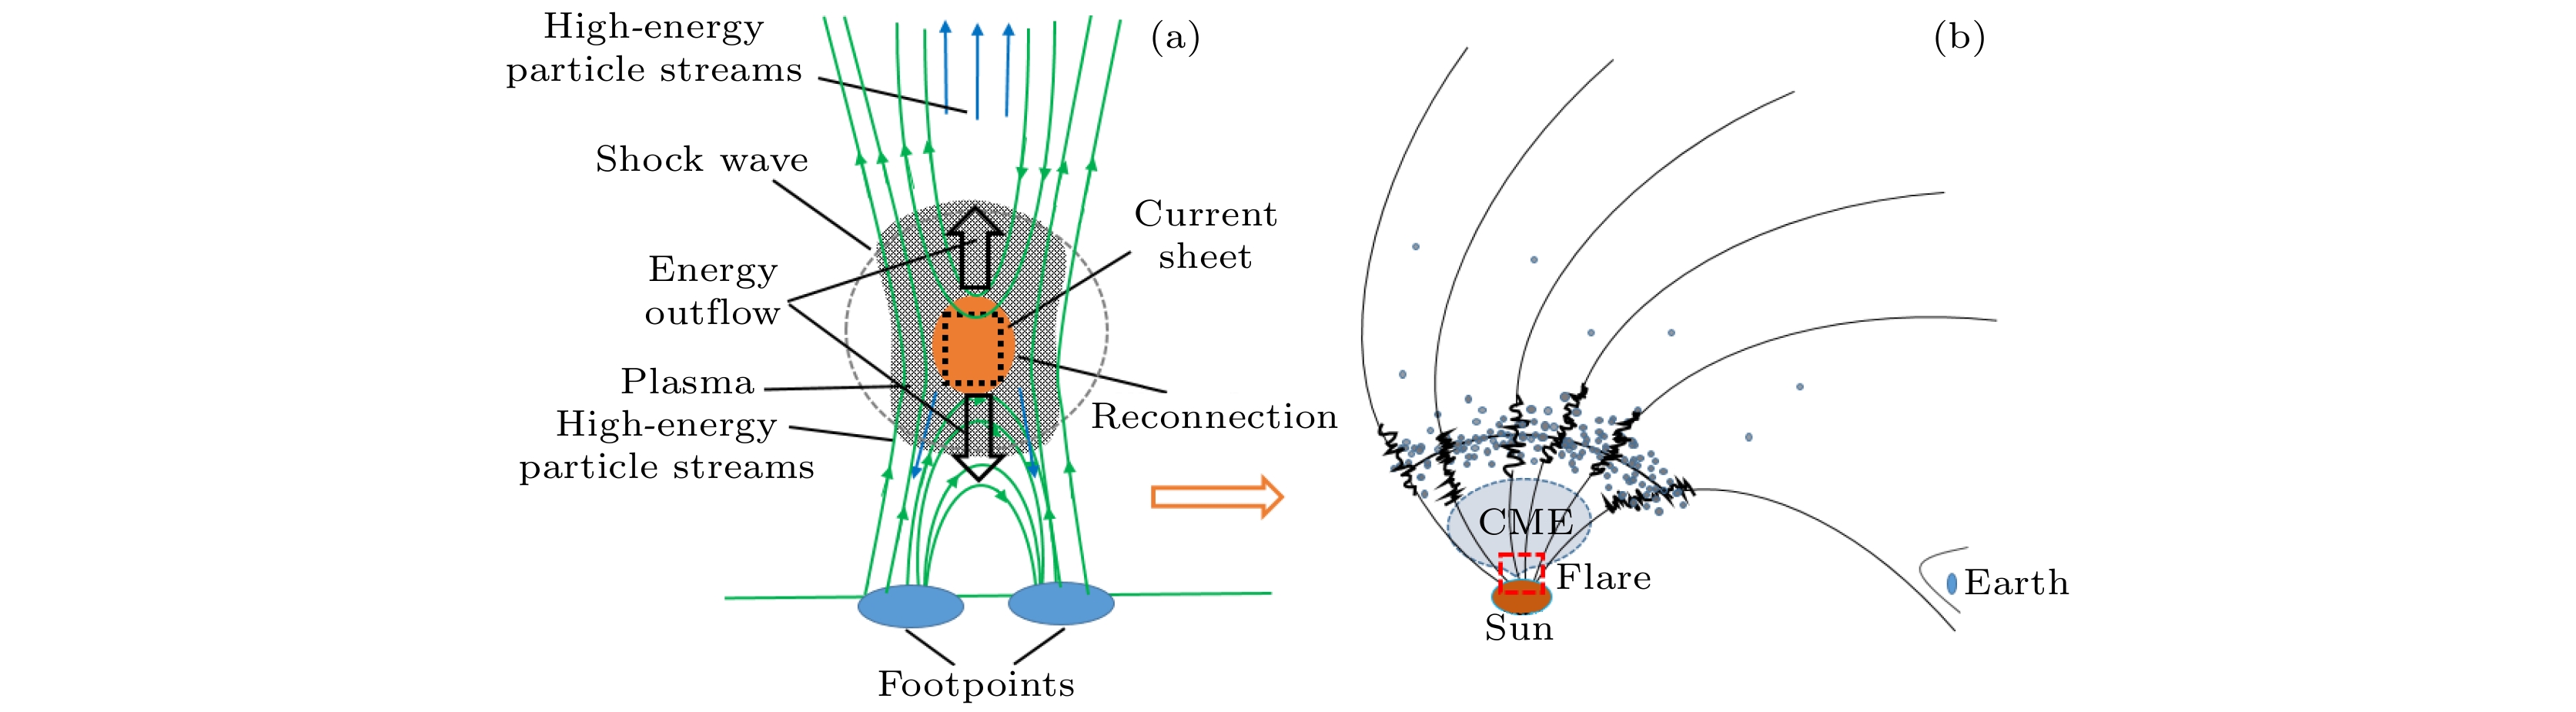
图 7 太阳高能粒子加速示意图, 左边表示在低日冕层区加速的太阳高能粒子, 右边表示从低日冕区加速出来的一部分太阳高能粒子向上传播进入CME 进行重加速 [22,24,25]
Figure 7. A schematic representation of the acceleration of solar energetic particles. The acceleration in the low corona region (left). Part of the solar high-energy particles from the low corona enter into the CME, and be re-accelerated (right)[22,24,25].
-
[1] Hess V F 1912 Phys. Z. 13 1084
[2] Simpson J A 1990 Proceedings of the 21th International Cosmic Ray Conference Adelaide, Australia, January 6–19, 1990 p187
[3] Auger P, Ehrenfest P, Maze R 1939 Rev. Mod. Phys. 11 288
Google Scholar
[4] Karpov S N, Miroshnichenko L I, Vashenyuk E V 1998 Nuovo Cimento C 21 551
[5] Shea M A, Smart D F 1990 Sol. Phys. 127 297
[6] Forbush S E 1946 Phys. Rev. 70 771
[7] Oh S Y, Yi Y, Bieber J W 2010 J. Geophys. Res. Space Phys. 115 A10107
[8] Vashenyuk E V, Balabin Y V, Perez-Peraza J, Gallegos-Cruz A, Miroshnichenko L I 2006 Adv. Space Res. 38 411
[9] Mottl D, Nymmik R 2007 Adv. Space Res. 39 1355
Google Scholar
[10] Bruno A, Christian E R, De Nolfo G A, Richardson I G, Ryan J M 2019 Space Weather 17 419
Google Scholar
[11] Gopalswamy N, Yashiro S, Mäkelä P, Xie H, Akiyama S, Monstein C 2018 Astrophys. J. Lett. 863 L39
Google Scholar
[12] Mishev A, Usoskin I, Raukunen O, Paassilta M, Valtonen E, Kocharov L, Vainio R 2018 Sol. Phys. 293 136
Google Scholar
[13] Mishev A L, Usoskin I G, Kovaltsov G A 2013 J. Geophys. Res. Space Phys. 118 2783
Google Scholar
[14] Dorman L, Tassev Y, Velinov P I Y, Mishev A, Tomova D, Mateev L 2019 J. Phys. Conf. Ser. 1181 012070
Google Scholar
[15] Mavromichalaki H, Gerontidou M, Paschalis P 2018 Space Weather 16 1797
Google Scholar
[16] Shea M A, Smart D F 2012 Space Sci. Rev. 171 161
Google Scholar
[17] Abbasi R, Ackermann M, Adams J 2008 Astrophys. J. 689 L65
Google Scholar
[18] Mishev A L, Kocharov L G, Usoskin I G 2014 J. Geophys. Res. Space Phys. 119 670
Google Scholar
[19] Lockwood J A, Webber W R, Hsieh L 1974 J. Geophys. Res. 79 4149
Google Scholar
[20] Aguilar M, Aisa D, Alpat B 2015 Phys. Rev. Lett. 114 171103
Google Scholar
[21] Aguilar M, Aisa D, Alpat B 2015 Phys. Rev. Lett. 15 211101
Google Scholar
[22] Petrosian V 2016 Astrophys. J. 830 28
Google Scholar
[23] Ramaty R, Forman M A 1987 NASA Conference Publication 2464 47
[24] Dröege W, Schlickeiser R 1986 Astrophys. J. 305 909
Google Scholar
[25] Tassev Y, Velinov P I Y, Tomova D, Mateev L 2017 C.R. Acad. Bulg. Sci. 70 1437
[26] Ellison D C, Ramaty R 1985 Astrophys. J. 298 400
Google Scholar


 DownLoad:
Catalog
Metrics
- Abstract views: 4031
- PDF Downloads: 55
- Cited By: 0
