


-
The ability to detect atoms in high spatiotemporal resolution provides a powerful tool for us to investigate the quantum properties of ultracold quantum gases. Plenty of useful imaging methods, including absorption imaging, phase contrast imaging and fluorescence imaging, have been implemented in detecting atoms. Among them, absorption imaging is the most widely used method in cold atoms laboratory. However, the traditional absorption imaging method is affected by perturbations such as interference between optical elements, fluctuation of laser power, frequency, and spatial position, resulting in residual spatially structured noise and degradation of imaging quality. Especially for regions with lower density or for longer time-of-flight, a large number of repetitions are often required to obtain better signal-to-noise ratio, which would increase the time cost and induce other noise. One must reduce the time between two imaging pulses to suppress the spatial noise. A better charge coupled device (CCD) with higher frame transfer rate or other method like fast-kinetic mode will be used to improve the imaging quality. In this paper, a single-shot cold atom imaging method based on machine learning is proposed, in which only one absorption imaging of cold atoms is required, and the corresponding background image can be generated through the neural network of an autoencoder. This effectively reduces the spatial striped noise in imaging, significantly improves the imaging quality, and makes it possible for cold atoms to be imaged multiple times in a single cycle.
-
Keywords:
- machine learning /
- cold atoms imaging /
- streak noise suppression
[1] Bhushan S, Chauhan V S, Easwaran R K 2018 Phys. Lett. A 382 3500
 Google Scholar
[2] Jones M P, Marcassa L G, Shaffer J P 2017 J. Phys. B 50 060202
Google Scholar
[3] Lee W, Kim H, Ahn J 2017 Phys. Rev. A 95 053424
Google Scholar
[4] Sutherland R T, Robicheaux F 2016 Phys. Rev. A 94 013847
Google Scholar
[5] Altman E, Brown K R, Carleo G, et al. 2021 PRX Quantum 2 017003
Google Scholar
[6] Childs A M, Preskill J, Renes J 2000 J. Mod. Opt. 47 155
Google Scholar
[7] Thomas P N, Smith B J, Datta A, Zhang L, Dorner U, Walmsley I A 2011 Phys. Rev. Lett. 107 113603
Google Scholar
[8] Li R, Wu Y, Rui Y, Li B, Jiang Y, Ma L, Wu H 2020 Phys. Rev. Lett. 124 063002
Google Scholar
[9] Ketterle W, Zwierlein M 2008 La Rivista del Nuovo Cimento 31 247
[10] Woo S, Park J, Lee J Y, Kweon I S 2018 Proceedings of the European conference on computer vision (ECCV) Munich, Germany, September 8–14, 2018 p3
[11] Hu J, Shen L, Sun G 2018 Proceedings of the IEEE Conference on Computer Vision and Pattern Recognition Salt Lake City, June 18–21, 2018 p7132
[12] LeCun Y, Bengio Y, Hinton G 2015 Nature 521 436
Google Scholar
[13] Biamonte J, Wittek P, Pancotti N, Rebentrost P, Wiebe N, Lloyd S 2017 Nature 549 195
Google Scholar
[14] Mehta P, Bukov M, Wang C H, Day A G, Richardson C, Fisher C K, Schwab D J 2019 Phys. Rep. 810 1
Google Scholar
[15] Nakamura I, Kanemura A, Nakaso T, Yamamoto R, Fukuhara T 2019 Opt. Express 27 20435
Google Scholar
[16] Barker A J, Style H, Luksch K, Sunami S, Garrick D, Hill F, Foot C J, Bentine E 2020 Mach. Learn.-Sci. Technol. 1 015007
Google Scholar
[17] Ness G, Vainbaum A, Shkedrov C, Florshaim Y, Sagi Y 2020 Phys. Rev. Appl. 14 014011
Google Scholar
[18] Shkedrov C, Florshaim Y, Ness G, Gandman A, Sagi Y 2018 Phys. Rev. Lett. 121 093402
Google Scholar
[19] Ness G, Shkedrov C, Florshaim Y, Sagi Y 2018 New J. Phys. 20 095002
Google Scholar
[20] Deng S, Shi Z Y, Diao P, Yu Q, Zhai H, Qi R, Wu H 2016 Science 353 371
Google Scholar
[21] Deng S, Chenu A, Diao P, Li F, Yu S, Coulamy I, Wu H 2018 Sci. Adv. 4 5909
Google Scholar
[22] Ronneberger O, Fischer P, Brox T 2015 International Conference on Medical Image Computing and Computer-Assisted Intervention Munich, Germany, October 5–9, 2015 p234
[23] Spall J C 2012 Handbook of Computational Statistics: Concepts and methods (Vol. 1) (Berlin: Springer) p173
[24] He K, Zhang X, Ren S, Sun J 2015 Proceedings of the IEEE International Conference on Computer Vision Washington DC, December 7–13, 2015 p1026
[25] Jacobs R A 1988 Neural Networks 1 295
Google Scholar
[26] Ioffe S, Szegedy C 2015 International Conference on Machine Learning Lille, France, July 6–11, 2015 p448
[27] Taylor L, Nitschke G 2018 IEEE Symposium Series on Computational Intelligence (SSCI) Bangalore, India, November 18–21, 2018 p1542
-

图 1 U-net 神经网络架构
Figure 1. U-net neural network architecture.
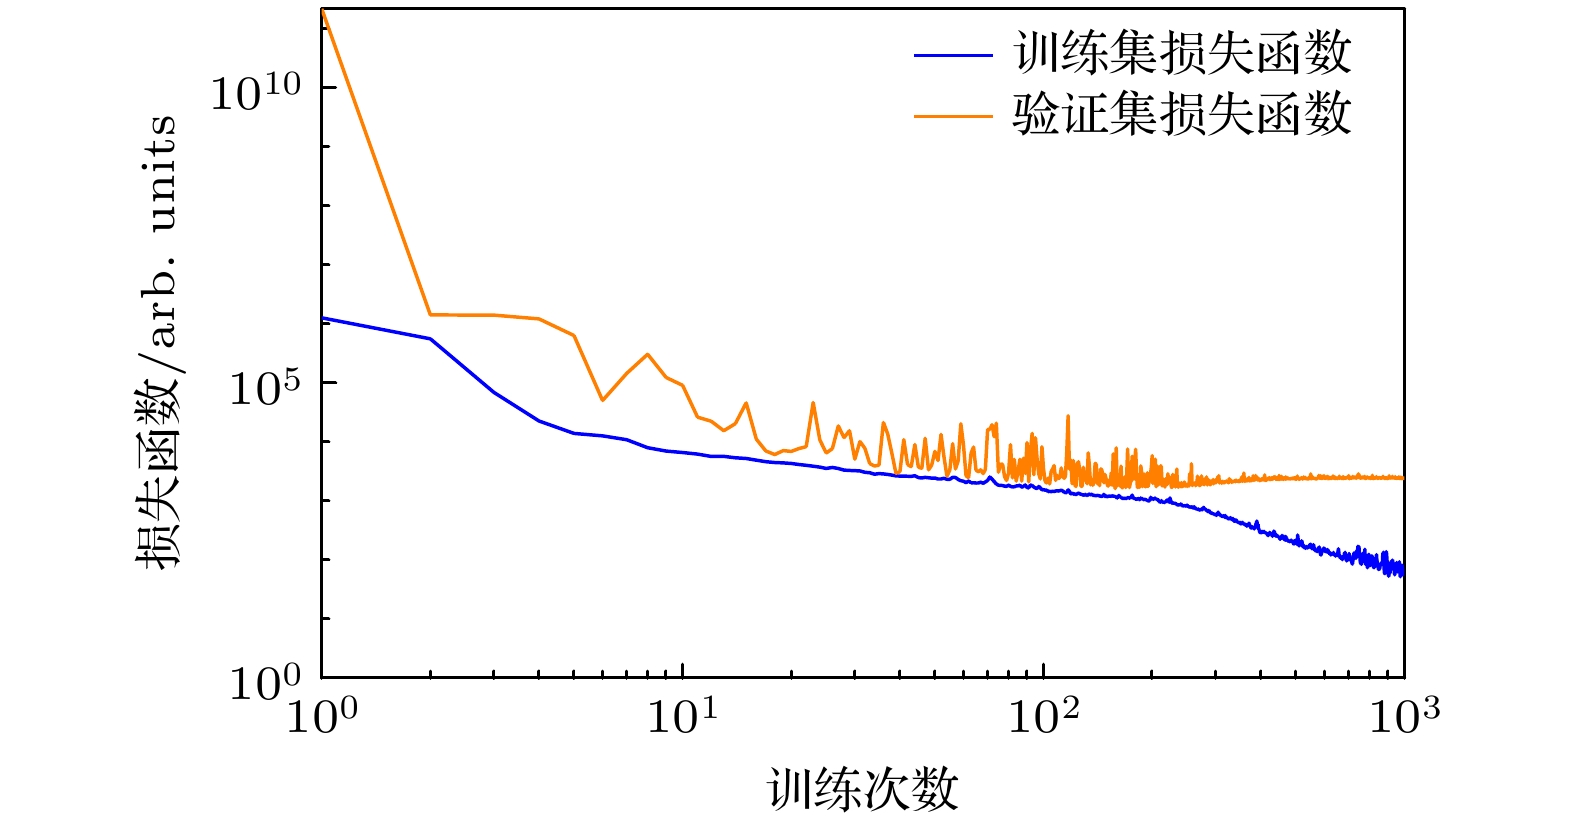
图 2 损失函数随着DNN训练次数的变化过程, 即模型预测和真实值之间的均方误差作为训练迭代次数的函数, 较低的值意味着更好的预测性能. 黄色的曲线表示验证集的损失函数, 蓝色曲线是训练集上的损失函数
Figure 2. The loss function varies with the training iterations of the DNN, which is the mean square error between model predictions and true values as a function of training iterations(epochs), and a lower value indicates better prediction performance. The yellow line represents the loss function on the validation set, and the blue line represents the loss function on the training set.
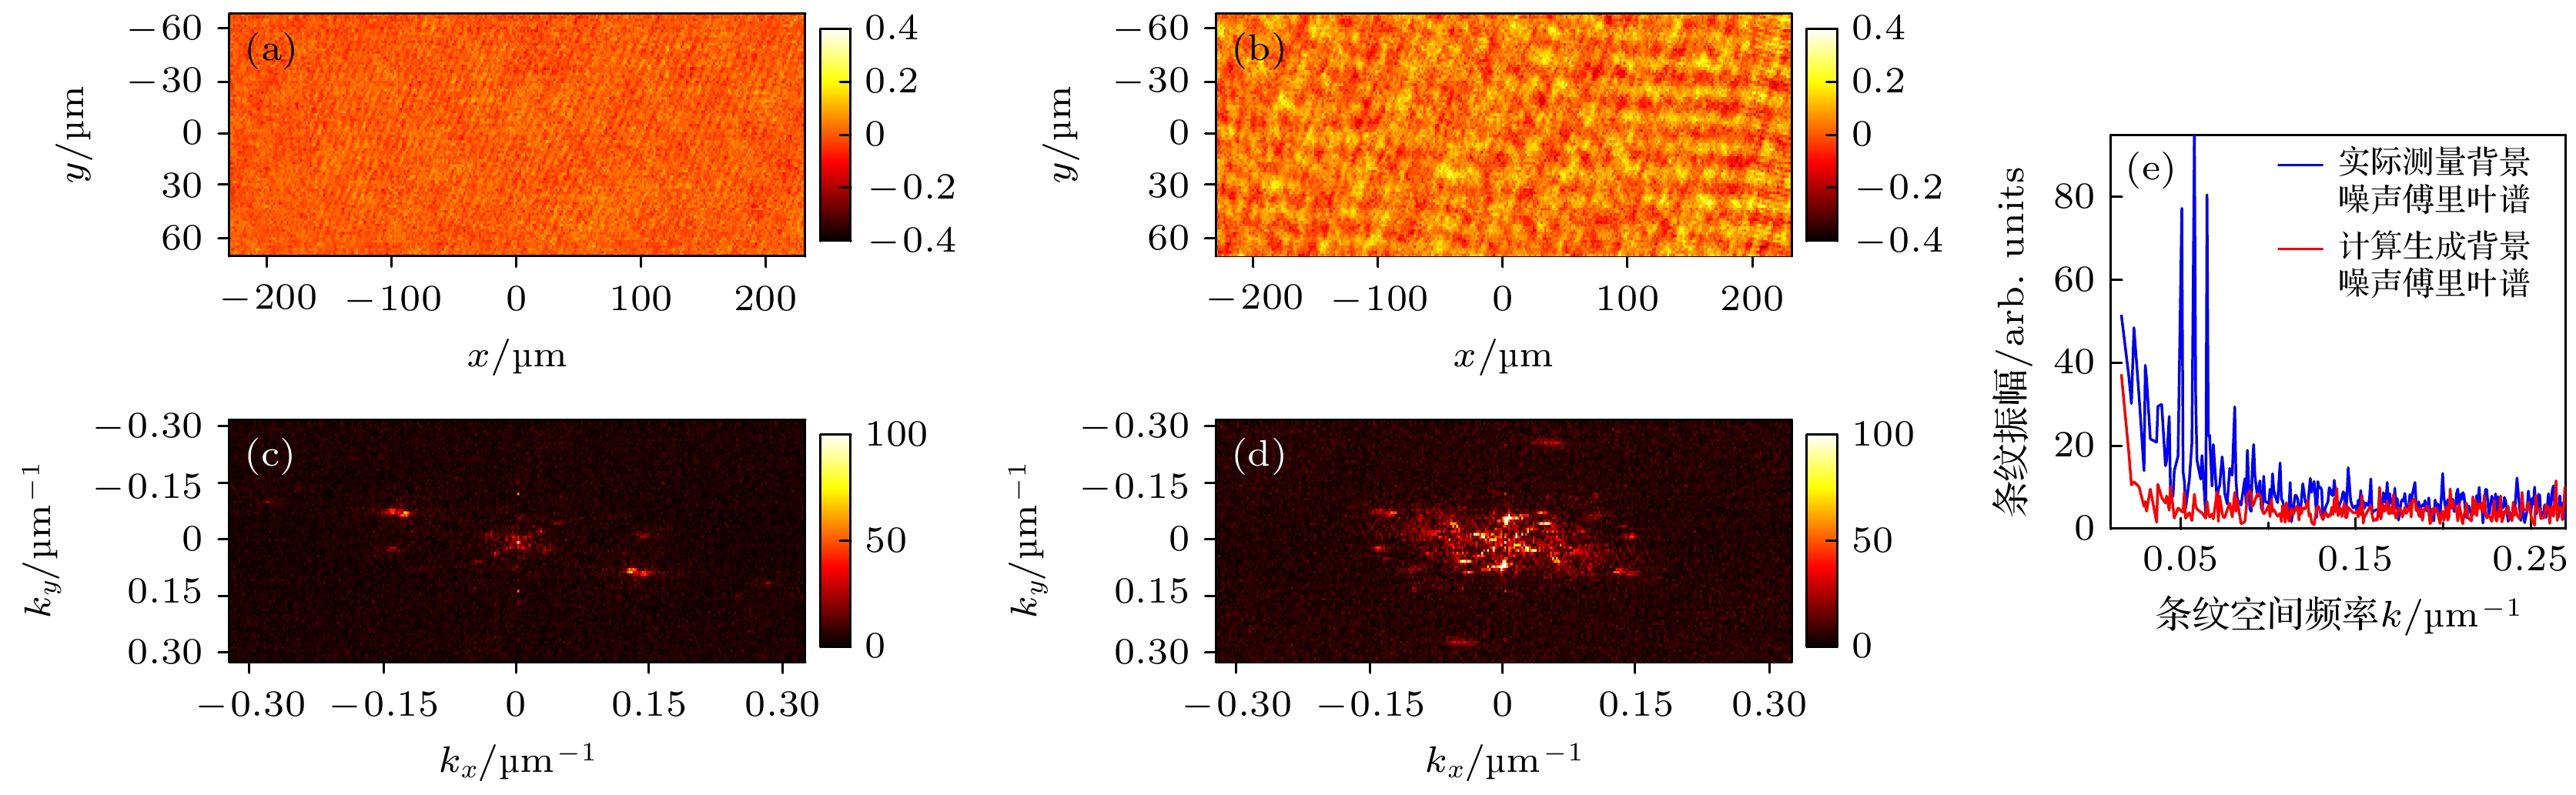
图 3 神经网络预测的成像信息和实际拍摄的结果对比图(无原子信息部分) (a), (c) 神经网络预测的光学密度图及其傅里叶空间分布; (b), (d) 实际双拍成像的光学密度图及其傅里叶空间分布; (e) 频谱空间的噪声对比图
Figure 3. Comparison of images predicted by neural networks and actual captured results (excluding atomic information): (a), (c) The optical density and Fourier space distribution of images generated by neural networks; (b), (d) the optical density and Fourier space distribution of actual double-shot imaging; (e) comparison of noise in frequency space.
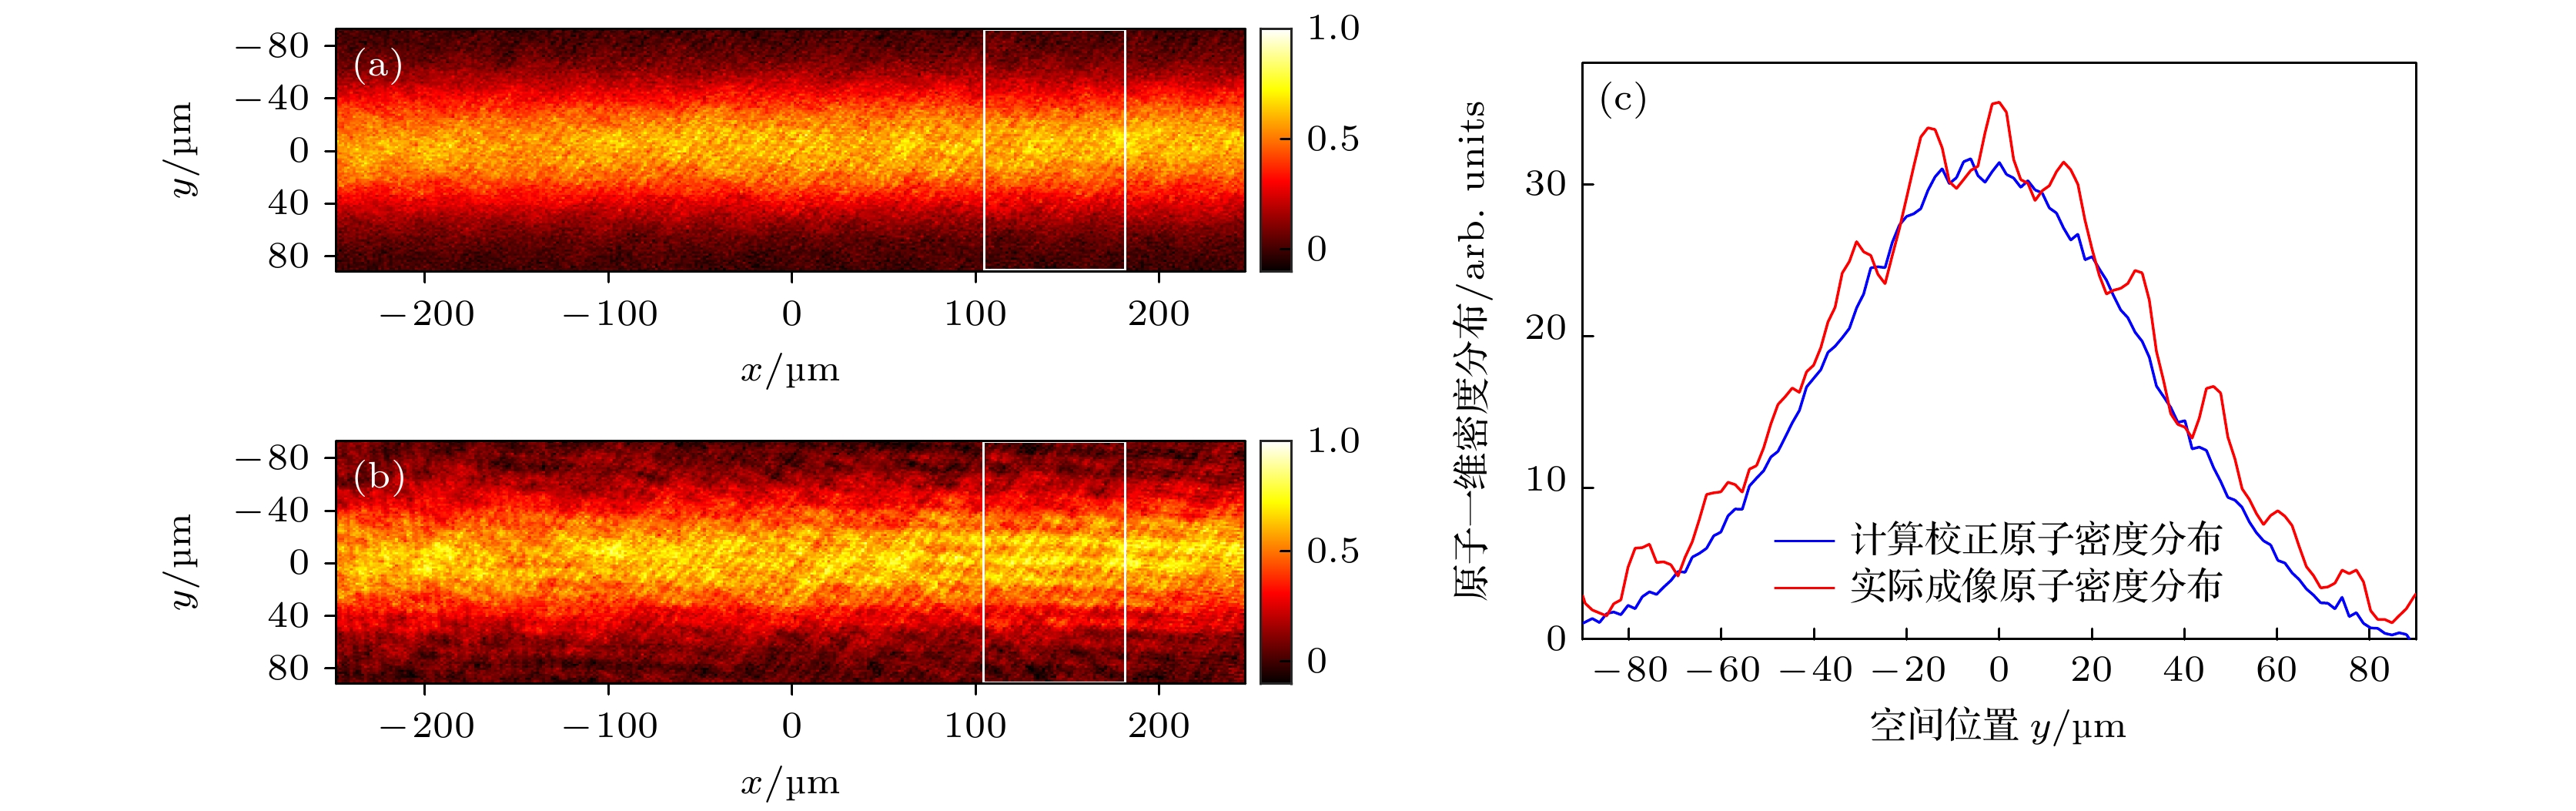
图 4 神经网络预测的成像信息和实际拍摄的结果对比图(原子信息部分) (a) 经网络预测生成的无条纹的原子密度分布图; (b) 使用传统双拍成像得到的原子密度分布; (c) 白框中原子沿x方向积分后的一维密度分布图
Figure 4. Comparison of images predicted by neural networks and actual captured results (atomic information included): (a) Stripe-free atomic density distribution map generated by neural networks; (b) atomic density distribution obtained using traditional double-shot imaging; (c) one-dimensional density distribution in the white square (integrated along x direction).
-
[1] Bhushan S, Chauhan V S, Easwaran R K 2018 Phys. Lett. A 382 3500
Google Scholar
[2] Jones M P, Marcassa L G, Shaffer J P 2017 J. Phys. B 50 060202
Google Scholar
[3] Lee W, Kim H, Ahn J 2017 Phys. Rev. A 95 053424
Google Scholar
[4] Sutherland R T, Robicheaux F 2016 Phys. Rev. A 94 013847
Google Scholar
[5] Altman E, Brown K R, Carleo G, et al. 2021 PRX Quantum 2 017003
Google Scholar
[6] Childs A M, Preskill J, Renes J 2000 J. Mod. Opt. 47 155
Google Scholar
[7] Thomas P N, Smith B J, Datta A, Zhang L, Dorner U, Walmsley I A 2011 Phys. Rev. Lett. 107 113603
Google Scholar
[8] Li R, Wu Y, Rui Y, Li B, Jiang Y, Ma L, Wu H 2020 Phys. Rev. Lett. 124 063002
Google Scholar
[9] Ketterle W, Zwierlein M 2008 La Rivista del Nuovo Cimento 31 247
[10] Woo S, Park J, Lee J Y, Kweon I S 2018 Proceedings of the European conference on computer vision (ECCV) Munich, Germany, September 8–14, 2018 p3
[11] Hu J, Shen L, Sun G 2018 Proceedings of the IEEE Conference on Computer Vision and Pattern Recognition Salt Lake City, June 18–21, 2018 p7132
[12] LeCun Y, Bengio Y, Hinton G 2015 Nature 521 436
Google Scholar
[13] Biamonte J, Wittek P, Pancotti N, Rebentrost P, Wiebe N, Lloyd S 2017 Nature 549 195
Google Scholar
[14] Mehta P, Bukov M, Wang C H, Day A G, Richardson C, Fisher C K, Schwab D J 2019 Phys. Rep. 810 1
Google Scholar
[15] Nakamura I, Kanemura A, Nakaso T, Yamamoto R, Fukuhara T 2019 Opt. Express 27 20435
Google Scholar
[16] Barker A J, Style H, Luksch K, Sunami S, Garrick D, Hill F, Foot C J, Bentine E 2020 Mach. Learn.-Sci. Technol. 1 015007
Google Scholar
[17] Ness G, Vainbaum A, Shkedrov C, Florshaim Y, Sagi Y 2020 Phys. Rev. Appl. 14 014011
Google Scholar
[18] Shkedrov C, Florshaim Y, Ness G, Gandman A, Sagi Y 2018 Phys. Rev. Lett. 121 093402
Google Scholar
[19] Ness G, Shkedrov C, Florshaim Y, Sagi Y 2018 New J. Phys. 20 095002
Google Scholar
[20] Deng S, Shi Z Y, Diao P, Yu Q, Zhai H, Qi R, Wu H 2016 Science 353 371
Google Scholar
[21] Deng S, Chenu A, Diao P, Li F, Yu S, Coulamy I, Wu H 2018 Sci. Adv. 4 5909
Google Scholar
[22] Ronneberger O, Fischer P, Brox T 2015 International Conference on Medical Image Computing and Computer-Assisted Intervention Munich, Germany, October 5–9, 2015 p234
[23] Spall J C 2012 Handbook of Computational Statistics: Concepts and methods (Vol. 1) (Berlin: Springer) p173
[24] He K, Zhang X, Ren S, Sun J 2015 Proceedings of the IEEE International Conference on Computer Vision Washington DC, December 7–13, 2015 p1026
[25] Jacobs R A 1988 Neural Networks 1 295
Google Scholar
[26] Ioffe S, Szegedy C 2015 International Conference on Machine Learning Lille, France, July 6–11, 2015 p448
[27] Taylor L, Nitschke G 2018 IEEE Symposium Series on Computational Intelligence (SSCI) Bangalore, India, November 18–21, 2018 p1542

 DownLoad:
Catalog
Metrics
- Abstract views: 1712
- PDF Downloads: 79
- Cited By: 0
