


-
The complex fluctuation of heart rate variability reflects the autonomous regulation function of the heart. In this paper, a novel method of measuring the heart rate variability is proposed. Firstly, the heart rate variability signal is decomposed by the improved complete ensemble empirical mode decomposition with adaptive noise method, and the multiple intrinsic mode functions are obtained, and the bubble entropy of each intrinsic mode function is calculated to obtain an entropy value vector. Then, the vector is mapped to a network based on a limited penetrable horizontal visibility graph method. By calculating various characteristic parameters of the network, the coupling relationship between the nonlinear features of heart rate variability in different time-frequency scale states are studied. The characteristic parameters include mean value of aggregation coefficient (MC), the characteristic path length (CL), the topological entropy of network (TE), the network level weighted bubble value (WB), and the pseudo mean value of node weight (PW). Firstly, the heart rate variabilities of 29 patients with congestive heart failure and 29 normal sinus heart rhythm subjects are analyzed by time domain, frequency domain and ICBN analysis method, the T test is used for statistical analysis, and Fisher discriminant method is used for classification. The results show that the time domain triangular index HRVTI, frequency domain index LF/HF, WB, PW and CL in ICBN have statistical differences. The accuracy rate of recognition model based on WB, CL, frequency domain index LF/HF and Fisher discriminant method is 89.66%. Secondly, the heart rate variabilities of 43 patients with atrial fibrillation arrhythmia and another 43 normal sinus heart rhythm subjects are analyzed by the same methods, including the time domain analyzed method, frequency domain analyzed method, and ICBN analyzed method. Then, the T test is also used for statistical analysis, and Fisher discriminant method is used for classification. The results show that using the time domain index pNN5 and RMSSD, frequency index LF/HF, ICBN index WB and PW as the feature vectors, and the Fisher discriminant mode as the classifier, the accuracy rate of recognition for atrial fibrillation arrhythmia is 91.86%. From these results it is concluded that the ICBN method provides a new idea for the heart rate variability measurement.
-
Keywords:
- heart rate variability /
- improved complete ensemble empirical mode decomposition with adaptive noise /
- bubble entropy /
- complex network
[1] Narin A, Isler Y, Ozer M, Perc M 2018 Phys. A: Stat. Mech. Appl. 509 56
 Google Scholar
[2] 司峻峰, 黄晓林, 周玲玲, 刘红星 2014 物理学报 54 40504
Si J F, Huang X L, Zhou L L, Liu H X 2014 Acta Phys. Sin. 54 40504
[3] Wendt H, Abry P, Kiyono K, Hayano J, Watanabe E, Yamamoto Y 2019 IEEE Trans. Biomed. Eng. 66 80
Google Scholar
[4] Wang Y, Wei S S, Zhang S, Zhang Y T, Zhao L N, Liu C Y, Murray A 2018 Biomed. Signal Process. Control 42 30
Google Scholar
[5] Pernice R, Javorka M, Krohova J, Czippelova B 2019 Med. Biol. Eng. Comput. 57 1247
Google Scholar
[6] Deus L A, Sousa C V, Rosa T S, Souto J M 2019 Physiol. Behav. 205 39
Google Scholar
[7] Li Y F, Pan W F, Li K Y, Jiang Q, Liu G Z 2019 IEEE J. Biomedical Health Informat. 23 175
Google Scholar
[8] 刘大钊, 王俊, 李锦, 李瑜, 徐文敏, 赵筱 2014 物理学报 19 198703
Google Scholar
Liu D Z, Wang J, Li J, Li Y, Xu W M, Zhao X 2014 Acta Phys. Sin. 19 198703
Google Scholar
[9] Asha N D, Joseph K P 2013 J. Mech. Med. Biol. 13 1350061
Google Scholar
[10] Xia J N, Shang P J, Wang J 2013 Nonlinear Dyn. 74 1183
Google Scholar
[11] Singh V, Gupta A, Sohal J S, Singh A 2019 Med. Biol. Eng. Comput. 57 741
Google Scholar
[12] Alvarez D, Sanchez-Fernandez A, Andres-Blanco A M, Gutierrez-Tobal G C, Vaquerizo-Villar F, Barroso-Garcia V, Hornero R 2019 Entropy 21 381
Google Scholar
[13] Li T B, Yao W P, Wu M, Shi Z R, Wang J, Ning X B 2017 Phys. A: Stat. Mech. Appl. 471 492
Google Scholar
[14] Manis G, Aktaruzzaman M, Sassi R 2017 IEEE Trans. Biomed. Eng. 64 2711
Google Scholar
[15] Acharya U R, Fujita H, Sudarshan V K, Oh S L, Muhammad A, Koh J E W, Tan J H, Chua C K, Chua K P, Tan R S 2016 Neural Comput. Appl. 28 3073
[16] Gao Z, Cai Q, Yang Y, Dang W, Zhang S 2016 Sci. Rep. 6 35622
Google Scholar
[17] 霍铖宇, 马小飞, 宁新宝 2017 物理学报 66 160502
Google Scholar
Huo C Y, Ma X F, Ning X B 2017 Acta Phys. Sin. 66 160502
Google Scholar
[18] Goldberger A L, Amaral L A N, Glass L, Hausdorff J M, Ivanov P C, Mark R G, Mietus J E, Moody G B, Peng C K, Stanley H E 2000 Circulation 101 e215
[19] Lin Y C, Lin Y H, Lo M T, Peng C K, Huang N E, Yang C C H, Kuo T B J 2016 Chaos 26 023109
Google Scholar
[20] Clifford G D, Tarassenko L 2005 IEEE Trans. Biomed. Eng. 52 630
Google Scholar
[21] Colominas M A, Schlotthauer G, Torres M E 2014 Biomed. Signal Process. Control 14 19
Google Scholar
[22] Watts D J, Strogatz S H 1998 Nature 393 440
Google Scholar
[23] 刘晓, 赵海, 张君, 王进法 2016 东北大学学报(自然科学版) 37 486
Google Scholar
Liu X, Zhao H, Zhang J, Wang J F 2016 Journal of Northeastern University (Natural Science)
37 486 Google Scholar
[24] Narin A, Isler Y, Ozer M, Perc M 2018 Physica A 509 65
-
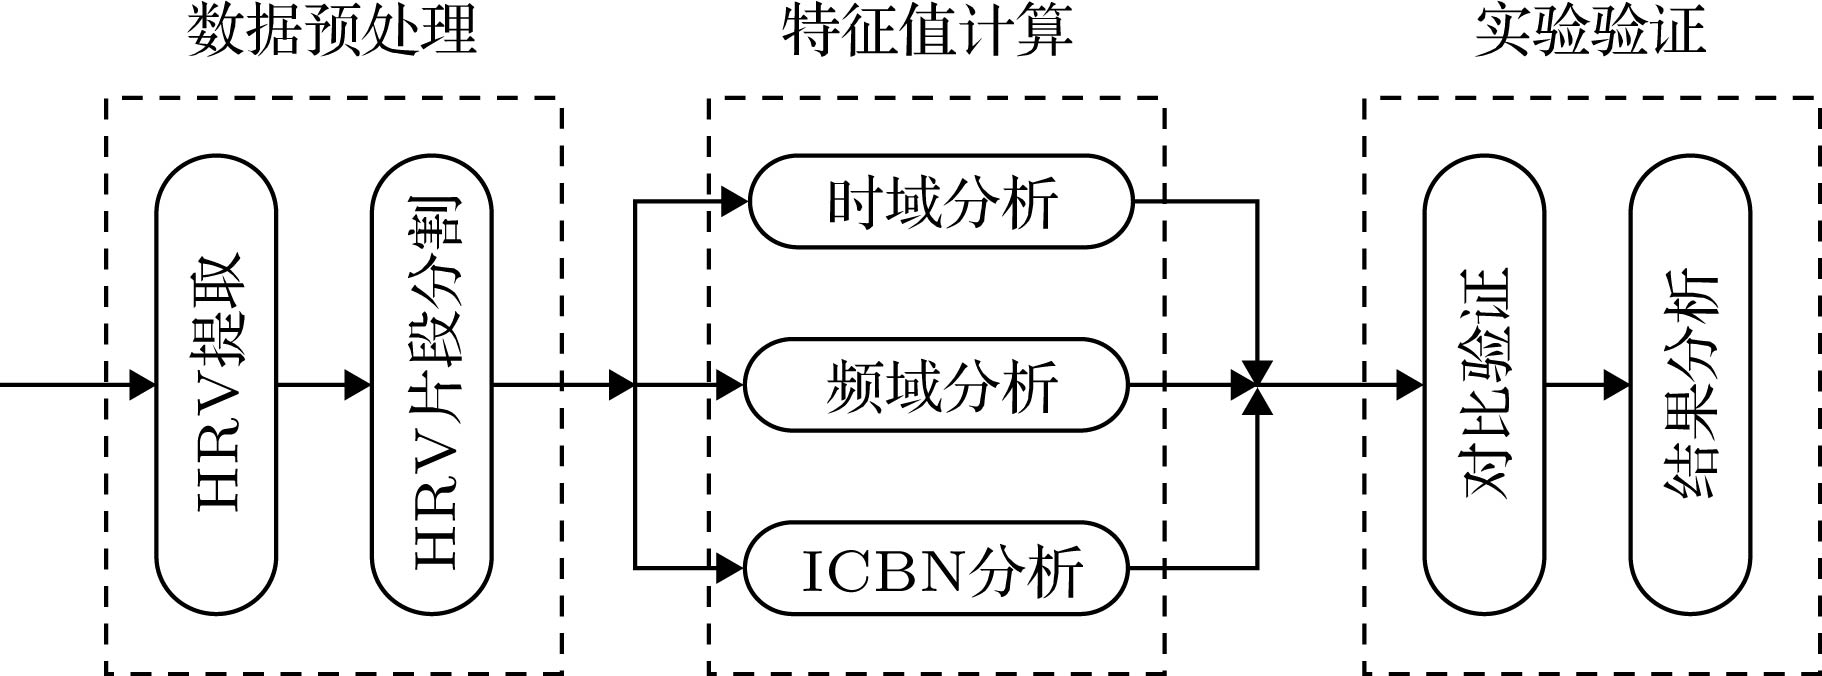
图 1 HRV分析框架图
Figure 1. Framework of the HRV analysis.
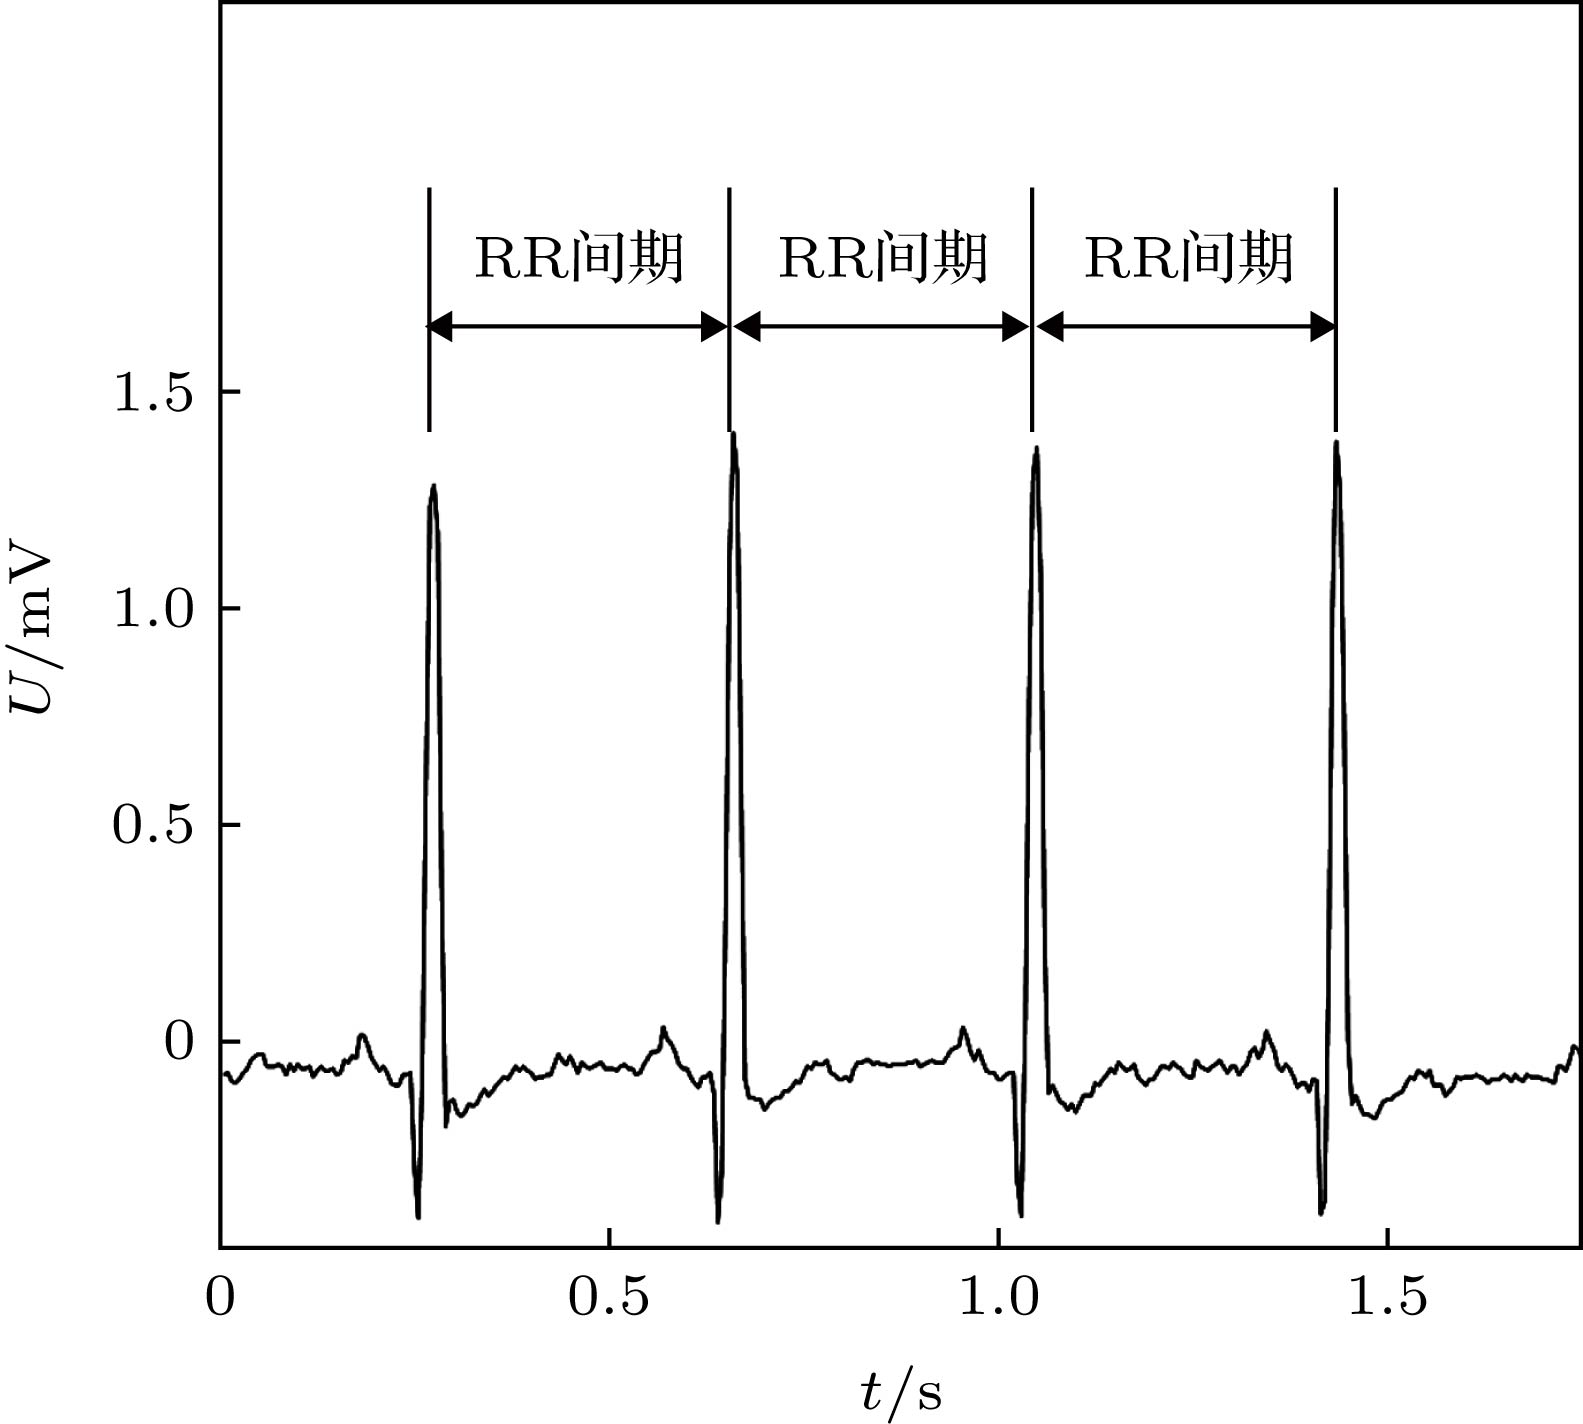
图 2 HRV信号获得示意图
Figure 2. Schematic of obtaining HRV signal.

图 3 ICBN分析方法实现过程框图
Figure 3. Implementation process of ICBN analysis method.

图 4 NSR1和CHF这2组对象具有极显著差异的指标的均值与标准差
Figure 4. Mean and variance of the indicators with very significant differences between the two groups of NSR1 and CHF.

图 5 NSR2和AF这2组对象具有极显著差异的指标的均值与标准差
Figure 5. Mean and variance of the indicators with very significant differences between the two groups of NSR2 and AF.
表 1 时域分析统计特征
Table 1. Statistical features in time domain.
指标 单位 描述与定义 SDNN ${\rm{ms}}$ 相邻正常心跳间隔的标准差${\rm{SDNN}} = {\sqrt {\dfrac{1}{N}\displaystyle \sum \limits_{i = 1}^N \left( {{\rm{RR}}{s_i} - \dfrac{1}{N}\mathop \sum \limits_{i = 1}^N {\rm{RR}}{s_i}} \right)} ^{}}$ RMSSD ms 相邻正常心跳间隔差值的平方和均值的均方根${\rm{RMSSD}} = \sqrt {\dfrac{1}{{N - 1}}\displaystyle \sum \limits_{i = 1}^{N - 1} {{\left( {{\rm{RR}}{s_{i + 1}} - {\rm{RR}}{s_i}} \right)}^2}} $ pNN50 % 相邻正常心跳间隔差值超过50毫秒的比例${\rm{PNN}}50 = \dfrac{{{\rm{num}}\left[ {\left( {{\rm{RR}}{s_{i + 1}} - {\rm{RR}}{s_i}} \right) > 50{\rm{ ms}}} \right]}}{{N - 1}}$ HRVTi — 相邻正常心跳间隔的总个数除以相邻正常心跳间隔直方图的高度  DownLoad: CSV
表 2 频域分析统计特征
Table 2. Statistical features in frequency domain.
指标 单位 描述与定义 频率范围 Total power ${\rm{m}}{{\rm{s}}^2}$ 所有频率范围的功率谱总和 ≤ 0.4 Hz VLF ${\rm{m}}{{\rm{s}}^2}$ 甚低频范围内的功率谱 0.003—0.040 Hz LF ${\rm{m}}{{\rm{s}}^2}$ 低频范围内的功率谱 0.04—0.15 Hz HF ${\rm{m}}{{\rm{s}}^2}$ 高频范围内的功率谱 0.15—0.40 Hz LF/HF % LF$\left[ {{\rm{m}}{{\rm{s}}^2}} \right]$ 与HF$\left[ {{\rm{m}}{{\rm{s}}^2}} \right]$的比值 —
DownLoad: CSV
表 3 NSR1和CHF患者不同分析方法下的结果
Table 3. Statistical analysis results of HRV index under different analysis methods.
指标 NSR1(mean$ \pm $SD) CHF(mean$ \pm $SD) 标准误差差值的95%置信区间 $p$ 下限 上限 ICBN WB 21.853$ \pm $1.479 27.835$ \pm $7.741 3.050 8.914 0*** PW 0.563$ \pm $0.051 0.455$ \pm $0.103 –0.151 –0.066 0*** TE 0.956$ \pm $0.019 0.937$ \pm $0.037 –0.034 –0.005 0.009** CL 1.135$ \pm $0.133 0.954$ \pm $0.194 –0.268 –0.094 0*** MC 0.684$ \pm $0.035 0.705$ \pm $0.026 –0.038 –0.006 0.009** 时域 SDNN 81.507$ \pm $38.566 59.535$ \pm $44.76 –43.951 0.007 0.05 pNN50 11.476$ \pm $14.676 10.772$ \pm $14.110 –8.277 6.870 0.853 RMSSD 51.172$ \pm $54.895 60.307$ \pm $58.497 –20.707 38.976 0.542 HRVTi 6.886$ \pm $2.452 4.093$ \pm $1.494 –3.861 –1.725 0*** 频域 TP 1.809$ \pm $4.909 1.443$ \pm $4.052 –2.734 2.001 0.758 VLF 0.0003$ \pm $0.448 1.387$ \pm $6.214 –1.265 3.370 0.367 LF 0.212$ \pm $0.333 0.119$ \pm $0.316 –0.263 0.078 0.281 HF 1.597$ \pm $4.608 1.322$ \pm $3.745 –2.483 1.934 0.804 LF/HF 0.288$ \pm $0.184 0.108$ \pm $0.083 –0.255 –0.105 0*** 注: *, **, ***分别代表$p < 0.05$$p < 0.01$, $p < 0.001$.
DownLoad: CSV
表 4 不同特征的CHF识别性能对比
Table 4. Performance comparisons of different indices for CHF recognition
指标 TP TN FP FN Acc Sen Spe AUC WB 19 27 10 2 79.31 90.48 72.97 81.72 PW 19 24 10 5 74.14 79.17 70.59 75.53 CL 20 23 9 6 74.14 76.92 71.88 74.40 HRVTi 23 19 6 10 72.41 69.70 76.00 72.85 LF/HF 25 17 4 12 72.41 75.68 80.95 78.32 注: TP, 被判定为CHF病人的数量; TN, 被判定为NSR1对象的数量; FP, NSR1对象被判定为CHF病人的数量; FN, CHF病人被判定为NSR1对象的数量; 正确率${\rm{Acc}} = \dfrac{{{\rm{TP + TN}}}}{{{\rm{TP \!+\! FP \!+\! TN \!+\! FN}}}} \times 100\% $; 灵敏度${\rm{Sen}} = \dfrac{{T{\rm{P}}}}{{T{\rm{P}} + {\rm{FN}}}} \times 100\% $; 特异度${\rm{Spe}} = \dfrac{{{\rm{TN}}}}{{{\rm{FP \!+\! TN}}}} \times 100\% $; ${\rm{AUC}} = \dfrac{1}{2}\left( {\dfrac{{{\rm{TP}}}}{{{\rm{TP + FN}}}}{\rm{ + }}\dfrac{{{\rm{TN}}}}{{{\rm{TN + FP}}}}} \right) \times 100\% $.
DownLoad: CSV
表 5 不同特征组合的CHF识别性能对比
Table 5. Performance comparisons of different indices for CHF recognition.
指标 TP TN FP FN Acc Sen Spe AUC WB&CL&LF/HF 25 27 4 2 89.66 92.59 87.1 89.85 WB&PW&CL&HRVTi&LF/HF 24 27 5 2 87.93 92.31 84.38 88.35 WB&PW&CL&LF/HF 24 27 5 2 87.93 92.31 84.38 88.35 WB&PW 22 29 7 0 87.93 100 80.56 90.28 WB&CL&HRVTi&LF/HF 25 25 4 4 86.20 86.21 86.21 86.21 WB&PW&HRVTi&LF/HF 24 26 5 3 86.20 88.89 83.87 86.38 WB&CL&HRVTi 25 25 4 4 86.20 86.21 86.21 86.21 WB&PW&HRVTi 24 26 5 3 86.20 88.89 83.87 86.38
DownLoad: CSV
表 6 NSR2和AF患者在不同分析方法下的结果
Table 6. Statistical analysis results of HRV index under different analysis methods
指标 NSR2(mean$ \pm $SD) AF(mean$ \pm $SD) 标准误差差值的95%置信区间 $p$ 下限 上限 ICBN WB 21.483$ \pm $1.367 24.243$ \pm $3.105 1.731 3.789 0*** PW 0.567$ \pm $0.074 0.454$ \pm $0.090 –0.148 –0.077 0*** TE 0.941$ \pm $0.050 0.960$ \pm $0.010 0.004 0.035 0.013* CL 1.113$ \pm $0.146 0.999$ \pm $0.170 –0.183 –0.047 0.001** MC 0.687$ \pm $0.043 0.664$ \pm $0.032 –0.024 –0.008 0.04* 时域 SDNN 74.698$ \pm $26.193 139.016$ \pm $62.480 10.331 43.773 0*** pNN50 10.123$ \pm $9.610 45.495$ \pm $30.687 4.904 25.620 0*** RMSSD 36.402$ \pm $19.003 170.926$ \pm $97.980 15.220 104.256 0*** HRVTi 7.735$ \pm $3.210 6.049$ \pm $2.488 –2.918 –0.455 0.008** 频域 TP 0.615$ \pm $0.612 13.493$ \pm $19.369 7.000 18.754 0.001** VLF 0.0002$ \pm $0.0003 0.017$ \pm $0.063 –2.256 36.147 0.083 LF 0.157$ \pm $0.154 1.204$ \pm $1.620 0.553 1.540 0.002** HF 0.458$ \pm $0.515 12.272$ \pm $17.908 6.381 17.247 0.001** LF/HF 0.515$ \pm $0.419 0.126$ \pm $0.059 –0.519 –0.259 0*** 注: *, **, ***分别代表$p < 0.05$, $p < 0.01$, $p < 0.001$.
DownLoad: CSV
表 7 不同特征的AF识别性能对比
Table 7. Performance comparisons of different indices for AF recognition.
指标 TP TN FP FN Acc Sen Spe AUC WB 30 37 13 6 77.91 83.33 74.00 78.67 PW 30 42 13 1 83.72 96.77 76.36 86.57 SDNN 31 34 12 9 75.58 77.50 73.91 75.71 pNN50 28 39 15 4 77.91 87.50 72.22 79.86 RMSSD 29 33 14 10 72.09 74.36 70.21 72.29 LFHF 42 24 1 19 76.74 68.85 96.00 82.43
DownLoad: CSV
表 8 不同特征的AF识别性能对比
Table 8. Performance comparisons of different indices for AF recognition.
指标 TP TN FP FN Acc Sen Spe AUC WB&PW&pNN50&RMSSD&LFHF 38 41 5 2 91.86 95.00 89.13 92.07 WB&PW&SDNN&LFHF 38 40 5 3 90.70 92.68 88.89 90.79 WB&PW&RMSSD&LFHF 38 40 5 3 90.70 92.68 88.89 90.79 WB&PW&SDNN&RMSSD 37 41 6 2 90.70 94.87 87.23 91.05 WB&PW&SDNN&pNN50&RMSSD 36 42 7 1 90.70 97.30 85.71 91.51
DownLoad: CSV
-
[1] Narin A, Isler Y, Ozer M, Perc M 2018 Phys. A: Stat. Mech. Appl. 509 56
Google Scholar
[2] 司峻峰, 黄晓林, 周玲玲, 刘红星 2014 物理学报 54 40504
Si J F, Huang X L, Zhou L L, Liu H X 2014 Acta Phys. Sin. 54 40504
[3] Wendt H, Abry P, Kiyono K, Hayano J, Watanabe E, Yamamoto Y 2019 IEEE Trans. Biomed. Eng. 66 80
Google Scholar
[4] Wang Y, Wei S S, Zhang S, Zhang Y T, Zhao L N, Liu C Y, Murray A 2018 Biomed. Signal Process. Control 42 30
Google Scholar
[5] Pernice R, Javorka M, Krohova J, Czippelova B 2019 Med. Biol. Eng. Comput. 57 1247
Google Scholar
[6] Deus L A, Sousa C V, Rosa T S, Souto J M 2019 Physiol. Behav. 205 39
Google Scholar
[7] Li Y F, Pan W F, Li K Y, Jiang Q, Liu G Z 2019 IEEE J. Biomedical Health Informat. 23 175
Google Scholar
[8] 刘大钊, 王俊, 李锦, 李瑜, 徐文敏, 赵筱 2014 物理学报 19 198703
Google Scholar
Liu D Z, Wang J, Li J, Li Y, Xu W M, Zhao X 2014 Acta Phys. Sin. 19 198703
Google Scholar
[9] Asha N D, Joseph K P 2013 J. Mech. Med. Biol. 13 1350061
Google Scholar
[10] Xia J N, Shang P J, Wang J 2013 Nonlinear Dyn. 74 1183
Google Scholar
[11] Singh V, Gupta A, Sohal J S, Singh A 2019 Med. Biol. Eng. Comput. 57 741
Google Scholar
[12] Alvarez D, Sanchez-Fernandez A, Andres-Blanco A M, Gutierrez-Tobal G C, Vaquerizo-Villar F, Barroso-Garcia V, Hornero R 2019 Entropy 21 381
Google Scholar
[13] Li T B, Yao W P, Wu M, Shi Z R, Wang J, Ning X B 2017 Phys. A: Stat. Mech. Appl. 471 492
Google Scholar
[14] Manis G, Aktaruzzaman M, Sassi R 2017 IEEE Trans. Biomed. Eng. 64 2711
Google Scholar
[15] Acharya U R, Fujita H, Sudarshan V K, Oh S L, Muhammad A, Koh J E W, Tan J H, Chua C K, Chua K P, Tan R S 2016 Neural Comput. Appl. 28 3073
[16] Gao Z, Cai Q, Yang Y, Dang W, Zhang S 2016 Sci. Rep. 6 35622
Google Scholar
[17] 霍铖宇, 马小飞, 宁新宝 2017 物理学报 66 160502
Google Scholar
Huo C Y, Ma X F, Ning X B 2017 Acta Phys. Sin. 66 160502
Google Scholar
[18] Goldberger A L, Amaral L A N, Glass L, Hausdorff J M, Ivanov P C, Mark R G, Mietus J E, Moody G B, Peng C K, Stanley H E 2000 Circulation 101 e215
[19] Lin Y C, Lin Y H, Lo M T, Peng C K, Huang N E, Yang C C H, Kuo T B J 2016 Chaos 26 023109
Google Scholar
[20] Clifford G D, Tarassenko L 2005 IEEE Trans. Biomed. Eng. 52 630
Google Scholar
[21] Colominas M A, Schlotthauer G, Torres M E 2014 Biomed. Signal Process. Control 14 19
Google Scholar
[22] Watts D J, Strogatz S H 1998 Nature 393 440
Google Scholar
[23] 刘晓, 赵海, 张君, 王进法 2016 东北大学学报(自然科学版) 37 486
Google Scholar
Liu X, Zhao H, Zhang J, Wang J F 2016 Journal of Northeastern University (Natural Science)
37 486 Google Scholar
[24] Narin A, Isler Y, Ozer M, Perc M 2018 Physica A 509 65

 DownLoad:
Catalog
Metrics
- Abstract views: 29764
- PDF Downloads: 110
- Cited By: 0
