


-
Nucleolus and mitochondria play an important role in maintaining cell balance, and studying their physiological processes is helpful in understanding the biological functions. In this work, a red fluorescent pyrene rhodamine probe is used to target and label cell mitochondria and nucleolus under different conditions, and the binding mode of probe and RNA is also clarified by bio-computational simulation results. Confocal laser scanning microscopy is used to analyze the morphological changes of apoptosis in HeLa cells under the action of laser light, paclitaxel and colchicine, and the changes of microenvironment between mitochondria and nucleolus are quantitatively analyzed by fluorescence lifetime imaging phase map. It is determined that the average fluorescence lifetime of the probe labeled mitochondria in steady-state HeLa cells is about 3.65 ns. The mitochondrial viscosity is about 66×10–3 Pa·s. After laser irradiation, mitochondrial fracture and fusion occur, the fluorescence lifetime of the probe decreases to 3.61 ns and the mitochondrial viscosity increases to about 131×10–3 Pa·s. The mean fluorescence lifetime of the probe labeled nucleolus of HeLa cells increases from 4.23 ns to 4.32 ns, indicating that the changes of the nucleolus microenvironment is induced by prolonging laser irradiation. Apoptosis is induced by paclitaxel and colchicine, and the nucleolus moves out of the nucleus and into the cytoplasm. Meanwhile, the fluorescence lifetime of the probe labeled nucleolus first increases and then decreases. The treatment time of paclitaxel increases from 0.5 h to 4 h, and the average lifetime of the probe labeled nucleolus of HeLa cells increases from 4.19 ns to 4.47 ns, and finally decreases to 4.42 ns, reflecting the differences in nucleolar microenvironment of HeLa cells induced by different treatment times of paclitaxel. Comparing with the blank HeLa cell, the average lifetime of the probe increases from 4.10 ns to 4.34 ns after 1 h treatment with colchicine at low concentration (10 nmol/L), and continuously increases to 4.47 ns after 1 h treatment with high concentration (100 nmol/L) colchicine. The microenvironments of nucleolus and mitochondria induced by apoptosis induced by colchicine at different concentrations are shown. The above three ways of inducing injury or apoptosis, i.e. by laser light, paclitaxel and colchicine, prove that the changes of nucleolar and mitochondrial microenvironment and functional changes of HeLa cells under the condition of cell instability provide a new method of studying the dynamic process of apoptosis induced by different pathways and the diseases related to nucleolar and mitochondrial dysfunction as well.
-
Keywords:
- fluorescence lifetime microscopy /
- nucleolus /
- microenvironment /
- viscosity
[1] Dutta T, Das S, Gupta I, Koner A L 2022 Chem. Sci. 13 12987
 Google Scholar
[2] Lafontaine D L J, Riback J A, Bascetin R, Brangwynne C P 2021 Nat. Rev. Mol. Cell Biol. 22 165
Google Scholar
[3] Yusupov M M, Yusupova G Z, Baucom A, Lieberman K, Earnest T N, Cate J H, Noller H F 2001 Science 292 883
Google Scholar
[4] Fischer A H, Bardarov S J, Jiang Z 2004 J. Cell. Biochem. 91 170
Google Scholar
[5] Derenzini M, Trerè D, Pession A, Govoni M, Sirri V, Chieco P 2000 J. Pathol. 191 181
Google Scholar
[6] Rozenblum G T, Lopez V G, Vitullo A D, Radrizzani M 2016 Expert Opin. Drug Discov. 11 127
Google Scholar
[7] Kao H P, Abney J R, Verkman A S 1993 J. Cell Biol. 120 175
Google Scholar
[8] Tian M, Sun J, Dong B L, Lin W Y 2019 Sens. Actuators B Chem. 292 16
Google Scholar
[9] Yang Z G, Cao J F, He Y X, Yang J H, Kim T Y, Peng X J, Kim J S 2014 Chem. Soc. Rev. 43 4563
Google Scholar
[10] Dickinson B C, Chang C J 2011 Nat. Chem. Biol. 7 504
Google Scholar
[11] Reddy P H, Beal M F 2008 Trends Mol. Med. 14 45
Google Scholar
[12] Lin M T, Beal M F 2006 Nat. Rev. 443 787
Google Scholar
[13] Seo A Y, Joseph A M, Dutta D, Hwang J C, Aris J P, Leeuwenburgh C 2010 J. Cell Sci. 123 2533
Google Scholar
[14] Wallace D C 2012 Nat. Rev. Cancer 12 685
Google Scholar
[15] Suen D F, Norris K L, Youle R J 2008 Genes Dev. 22 1577
Google Scholar
[16] Huang H Y, Yang L, Zhang P Y, et al. 2016 Biomaterials 83 321
Google Scholar
[17] Sun L, Chen Y, Kuang S, Li G, Guan R, Liu J, Ji L, Chao H 2016 Chem 22 8955
Google Scholar
[18] Müller W E, Eckert A, Kurz C, Eckert G P, Leuner K 2010 Mol. Neurobiol. 41 159
Google Scholar
[19] Parlato R, Liss B 2014 Biochim. Biophys. Acta 1842 791
Google Scholar
[20] Boulon S, Westman B J, Hutten S, Boisvert F M, Lamond A I 2010 Mol. Cell 40 216
Google Scholar
[21] Iarovaia O V, Minina E P, Sheval E V, et al. 2019 Trends Cell Biol. 29 647
Google Scholar
[22] Day R N, Davidson M W 2009 Chem. Soc. Rev. 38 2887
Google Scholar
[23] Grimm J B, English B P, Chen J, et al. 2015 Nat. Methods 12 244
Google Scholar
[24] Kim H M, Cho B R 2015 Chem. Rev. 115 5014
Google Scholar
[25] Yang Y, Zhao Q, Feng W, Li F 2013 Chem. Rev. 113 192
Google Scholar
[26] Samanta S, Lai K, Wu F, Liu Y, Cai S, Qu J, Yang Z 2023 Chem. Soc. Rev. 52 7197
Google Scholar
[27] Yang Z G, He Y X, Lee J H, et al. 2013 J. Am. Chem. Soc. 135 9181
Google Scholar
[28] Yu L, Verwilst P, Shim I, Zhao Y Q, Zhou Y, Kim J S 2021 J. Chin. Chem. Soc. 3 2725
Google Scholar
[29] Ranjit S, Malacrida, Jameson D M, Gratton E 2018 Nat. Protoc. 13 1979
Google Scholar
[30] Zhang D, He Y, Wang J L, Wu L Y, Liu B, Cai S T, Li Y, Yan W, Yang Z G, Qu J L 2022 J. Biophoton. 15 e202200006
Google Scholar
[31] He Y, Shin J, Gong W J, et al. 2019 Chem. Commun. 55 2533
Google Scholar
[32] Peng X J, Yang Z G, Wang J Y, et al. 2011 J. Am. Chem. Soc. 133 6626
Google Scholar
[33] Koyama T, Zhu M Y, Araiso T, Kinjo M, Kitagawa H, Sugimura M 1990 Jpn. J. Physiol. 40 65
Google Scholar
[34] 林丹樱, 牛敬敬, 刘雄波, 张潇, 张娇, 于斌, 屈军乐 2020 物理学报 69 168703
Google Scholar
Lin D Y, Niu J J, Liu X B, Zhang X, Zhang J, Yu B, Qu J L 2020 Acta Phys. Sin. 69 168703
Google Scholar
[35] Wang T H, Wang H S, Soong Y K 2000 Cancer 88 2619
Google Scholar
[36] Lieu C H, Chang Y N, Lai Y K 1997 Biochem. Pharmacol. 53 1587
Google Scholar
[37] Dalbeth N, Lauterio T J, Wolfe H R 2014 Clin. Ther. 36 1465
Google Scholar
[38] Paschke S, Weidner A F, Paust T, Marti O, Beil M, Ben-Chetrit E 2013 J. Leukoc. Biol. 94 1091
Google Scholar
-
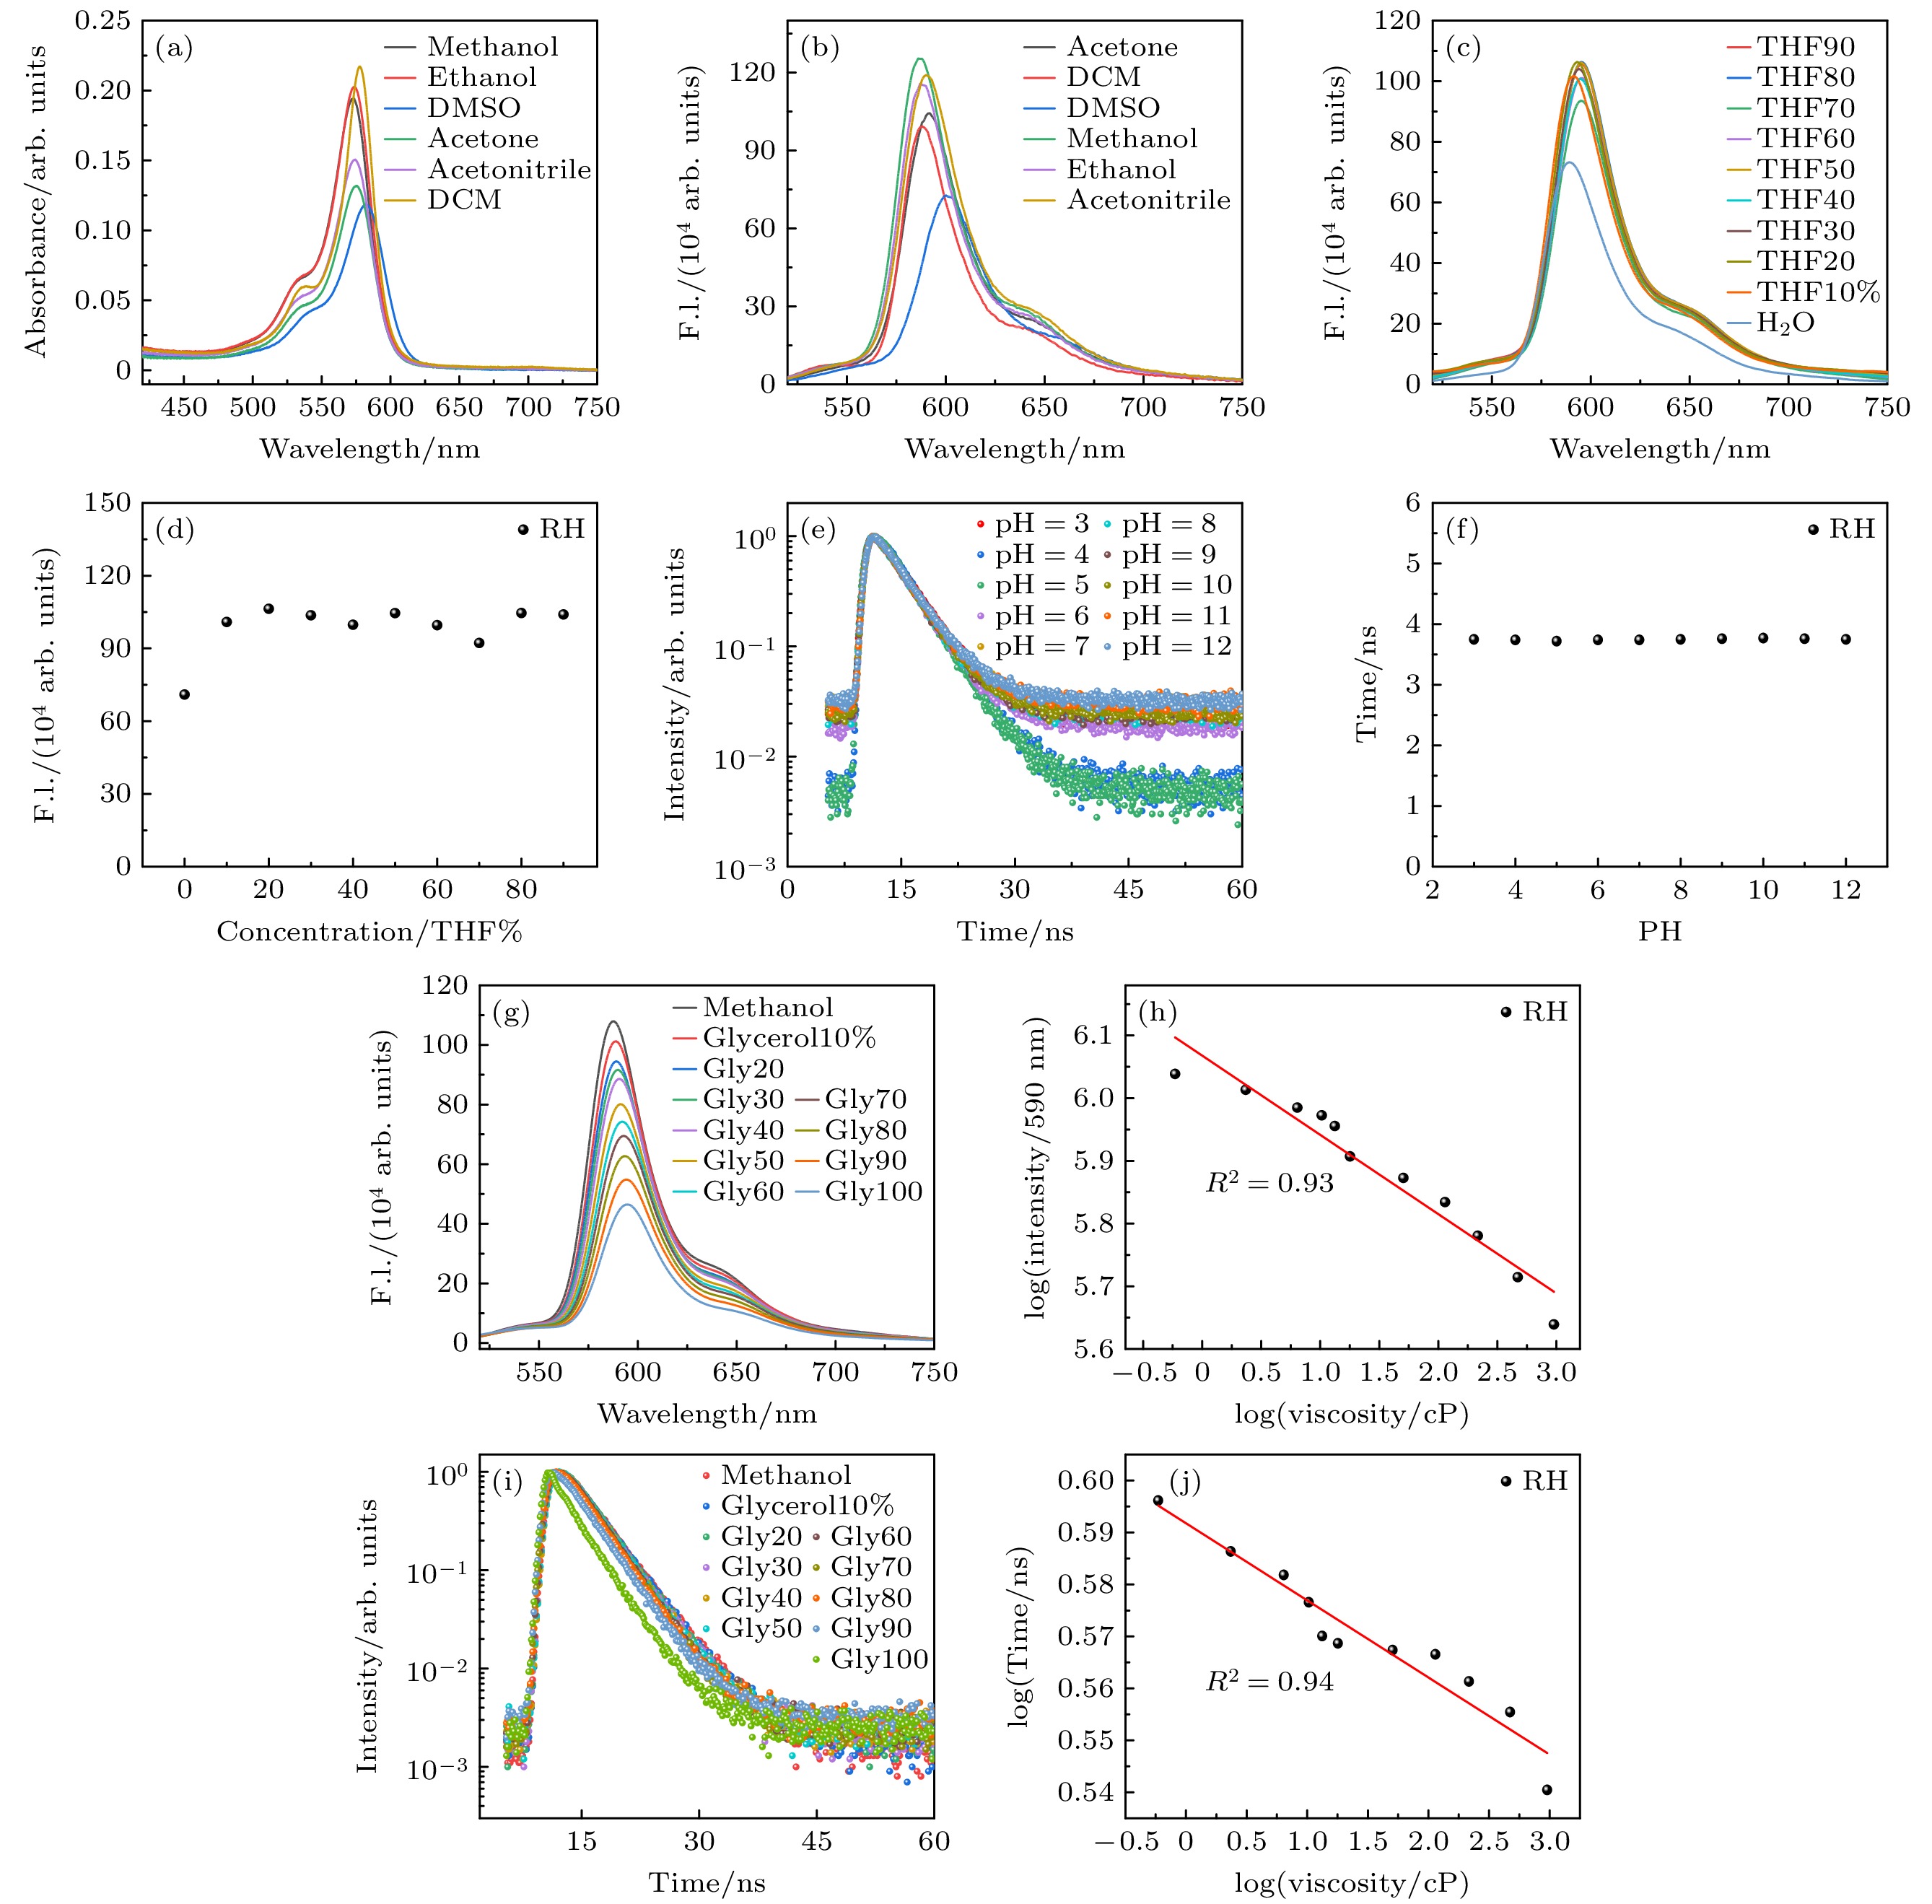
图 1 荧光探针RH光物理性能研究 (a) RH在不同溶剂中的紫外吸收光谱; (b) RH在不同溶剂中的荧光光谱; (c) RH在不同比例的四氢呋喃和水混合溶剂中的发射光谱, 激发波长495 nm; (d) 荧光强度与不同比例的四氢呋喃和水混合溶剂之间的关系; (e) RH在不同pH值溶剂环境中荧光寿命衰减曲线; (f) RH的荧光寿命与pH值的关系; (g) RH在甲醇和甘油混合的黏度溶剂中的发射光谱(室温20 ℃), 激发波长495 nm; (h) 荧光强度与黏度同时取对数后的线性关系; (i) RH在甲醇和甘油混合的黏度溶剂中的荧光衰减曲线(室温20 ℃), 荧光寿命的激发波长为456 nm; (j) RH荧光寿命与黏度同时取对数后的线性关系
Figure 1. Fluorescence spectra of RH in different solvents: (a) UV absorption spectrum of RH in different solvents; (b) fluorescence spectra of RH in different solvents; (c) the emission spectrum of RH in the mixture of tetrahydrofuran and water with an excitation wavelength of 495 nm; (d) the relationship between fluorescence intensity and different proportions of the mixture of tetrahydrofuran and water; (e) RH fluorescence lifetime decay curves of RH in solvents with different PH values; (f) relationship between the fluorescence lifetime of RH and PH value; (g) emission spectrum of RH in the viscous solvent mixed with methanol and glycerol (room temperature 20 ℃), excitation wavelength is 495 nm; (h) linear relationship between fluorescence intensity and viscosity after taking logarithm simultaneously; (i) the fluorescence attenuation curve of RH in a viscous solvent mixed with methanol and glycerol (room temperature 20 ℃), the excitation wavelength of the fluorescence lifetime is 456 nm; (j) linear relationship between fluorescence lifetime and viscosity after taking logarithm simultaneously.
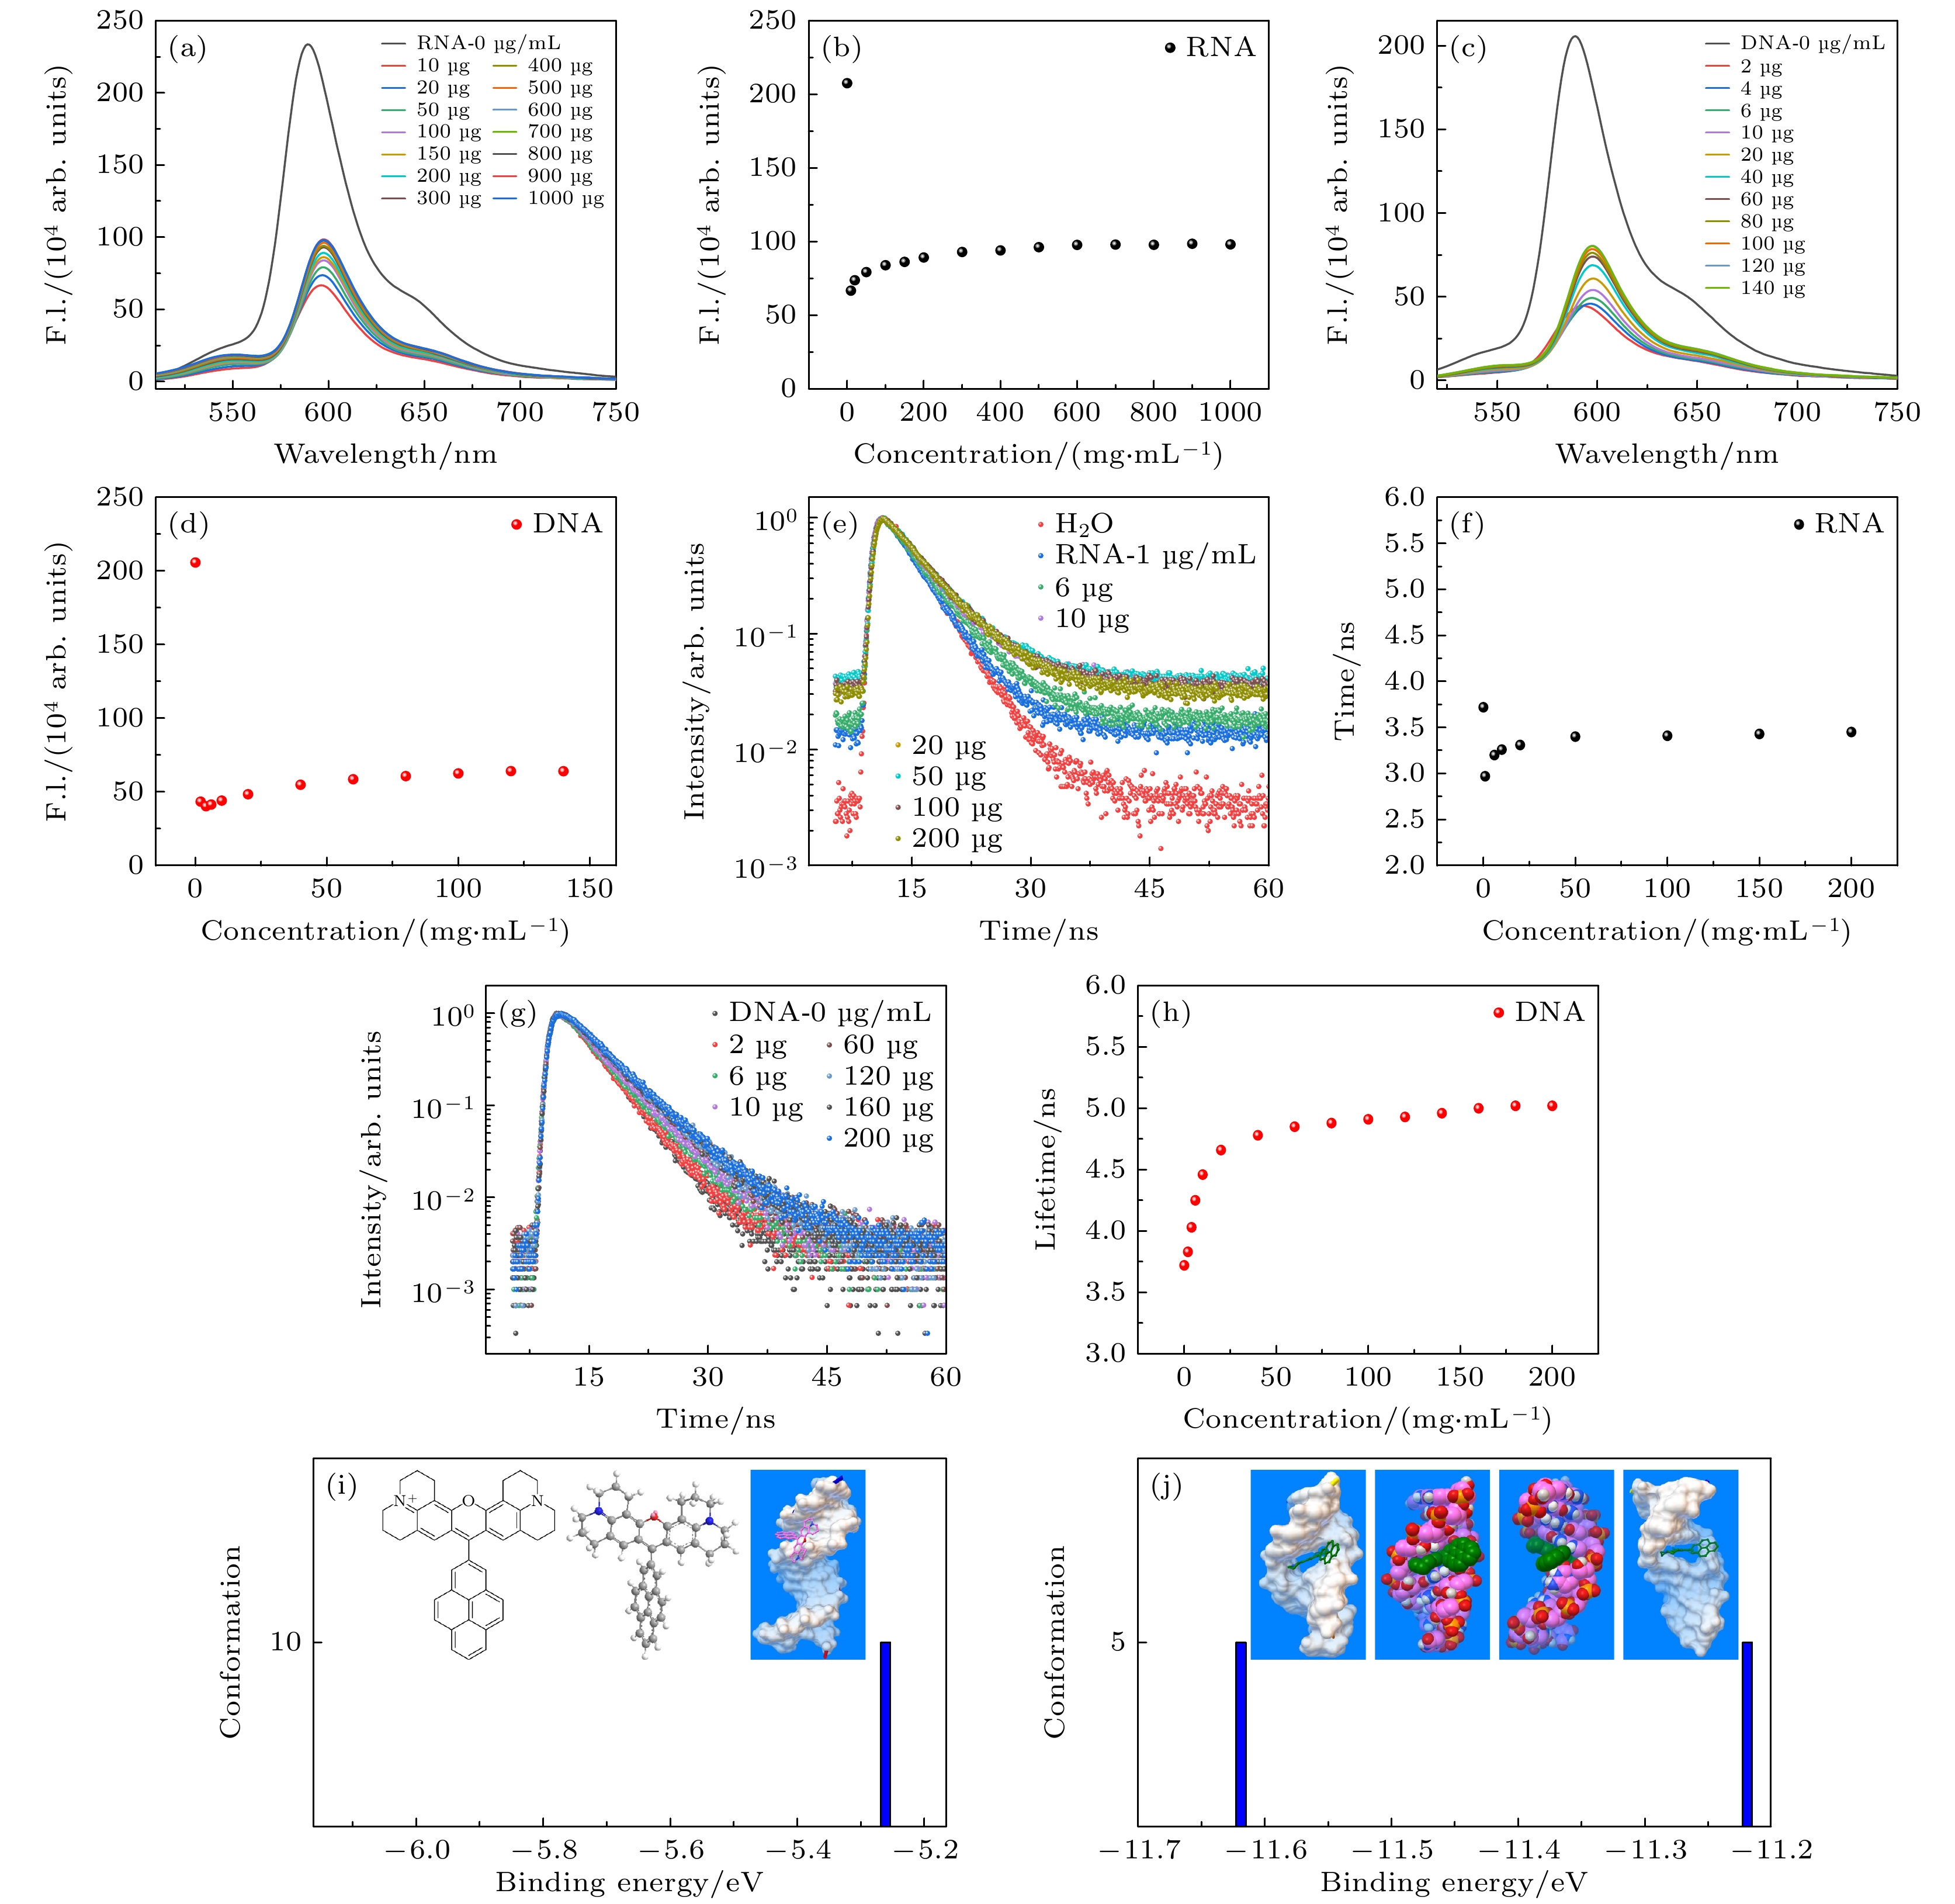
图 2 探针RH (1 μmol/L) 的DNA/RNA荧光滴定光谱及荧光寿命衰减曲线以及生物计算对接模拟探针与DNA/RNA的结合模式 (a) RH的RNA荧光滴定光谱; (b) RH的荧光强度随RNA浓度变化曲线; (c) RH的DNA荧光滴定光谱; (d) RH的荧光强度随DNA浓度的变化曲线; (e) RH的RNA荧光滴定的荧光寿命衰减曲线; (f) RH的荧光寿命随RNA浓度的变化曲线; (g) RH的分子结构模型以及RH的DNA荧光滴定的荧光寿命衰减曲线; (h) RH的荧光寿命随DNA浓度的变化曲线, 激发光波长456 nm; (i) RH与DNA的生物对接模拟计算; (j) RH与RNA的生物对接模拟计算, 横坐标为分子结合能, 纵坐标为分子结构, 使用开源的Windows版Autodocking软件
Figure 2. The DNA/RNA fluorescence titration spectrum and fluorescence lifetime decay curve of probe RH (1 μmol/L) and the binding mode of probe with DNA/RNA were simulated by biocomputation: (a) RNA fluorescence titration spectroscopy of RH; (b) the fluorescence intensity of RH varies with the concentration of RNA; (c) DNA fluorescence titration spectroscopy of RH; (d) the fluorescence intensity of RH varies with the concentration of DNA; (e) fluorescence lifetime decay curve for RNA fluorescence titration of RH; (f) the fluorescence lifetime of RH varies with RNA concentration; (g) molecular structure model of RH and fluorescence lifetime decay curve for DNA fluorescence titration of RH; (h) the fluorescence lifetime of RH varies with DNA concentration; excitation light wavelength 456 nm; (i) biological docking simulation of RH and DNA; (j) biological docking simulation of RH and RNA; where the horizontal coordinate is the molecular binding energy, and the vertical coordinate is the molecular structure, using the open source Windows version of Autodocking software.
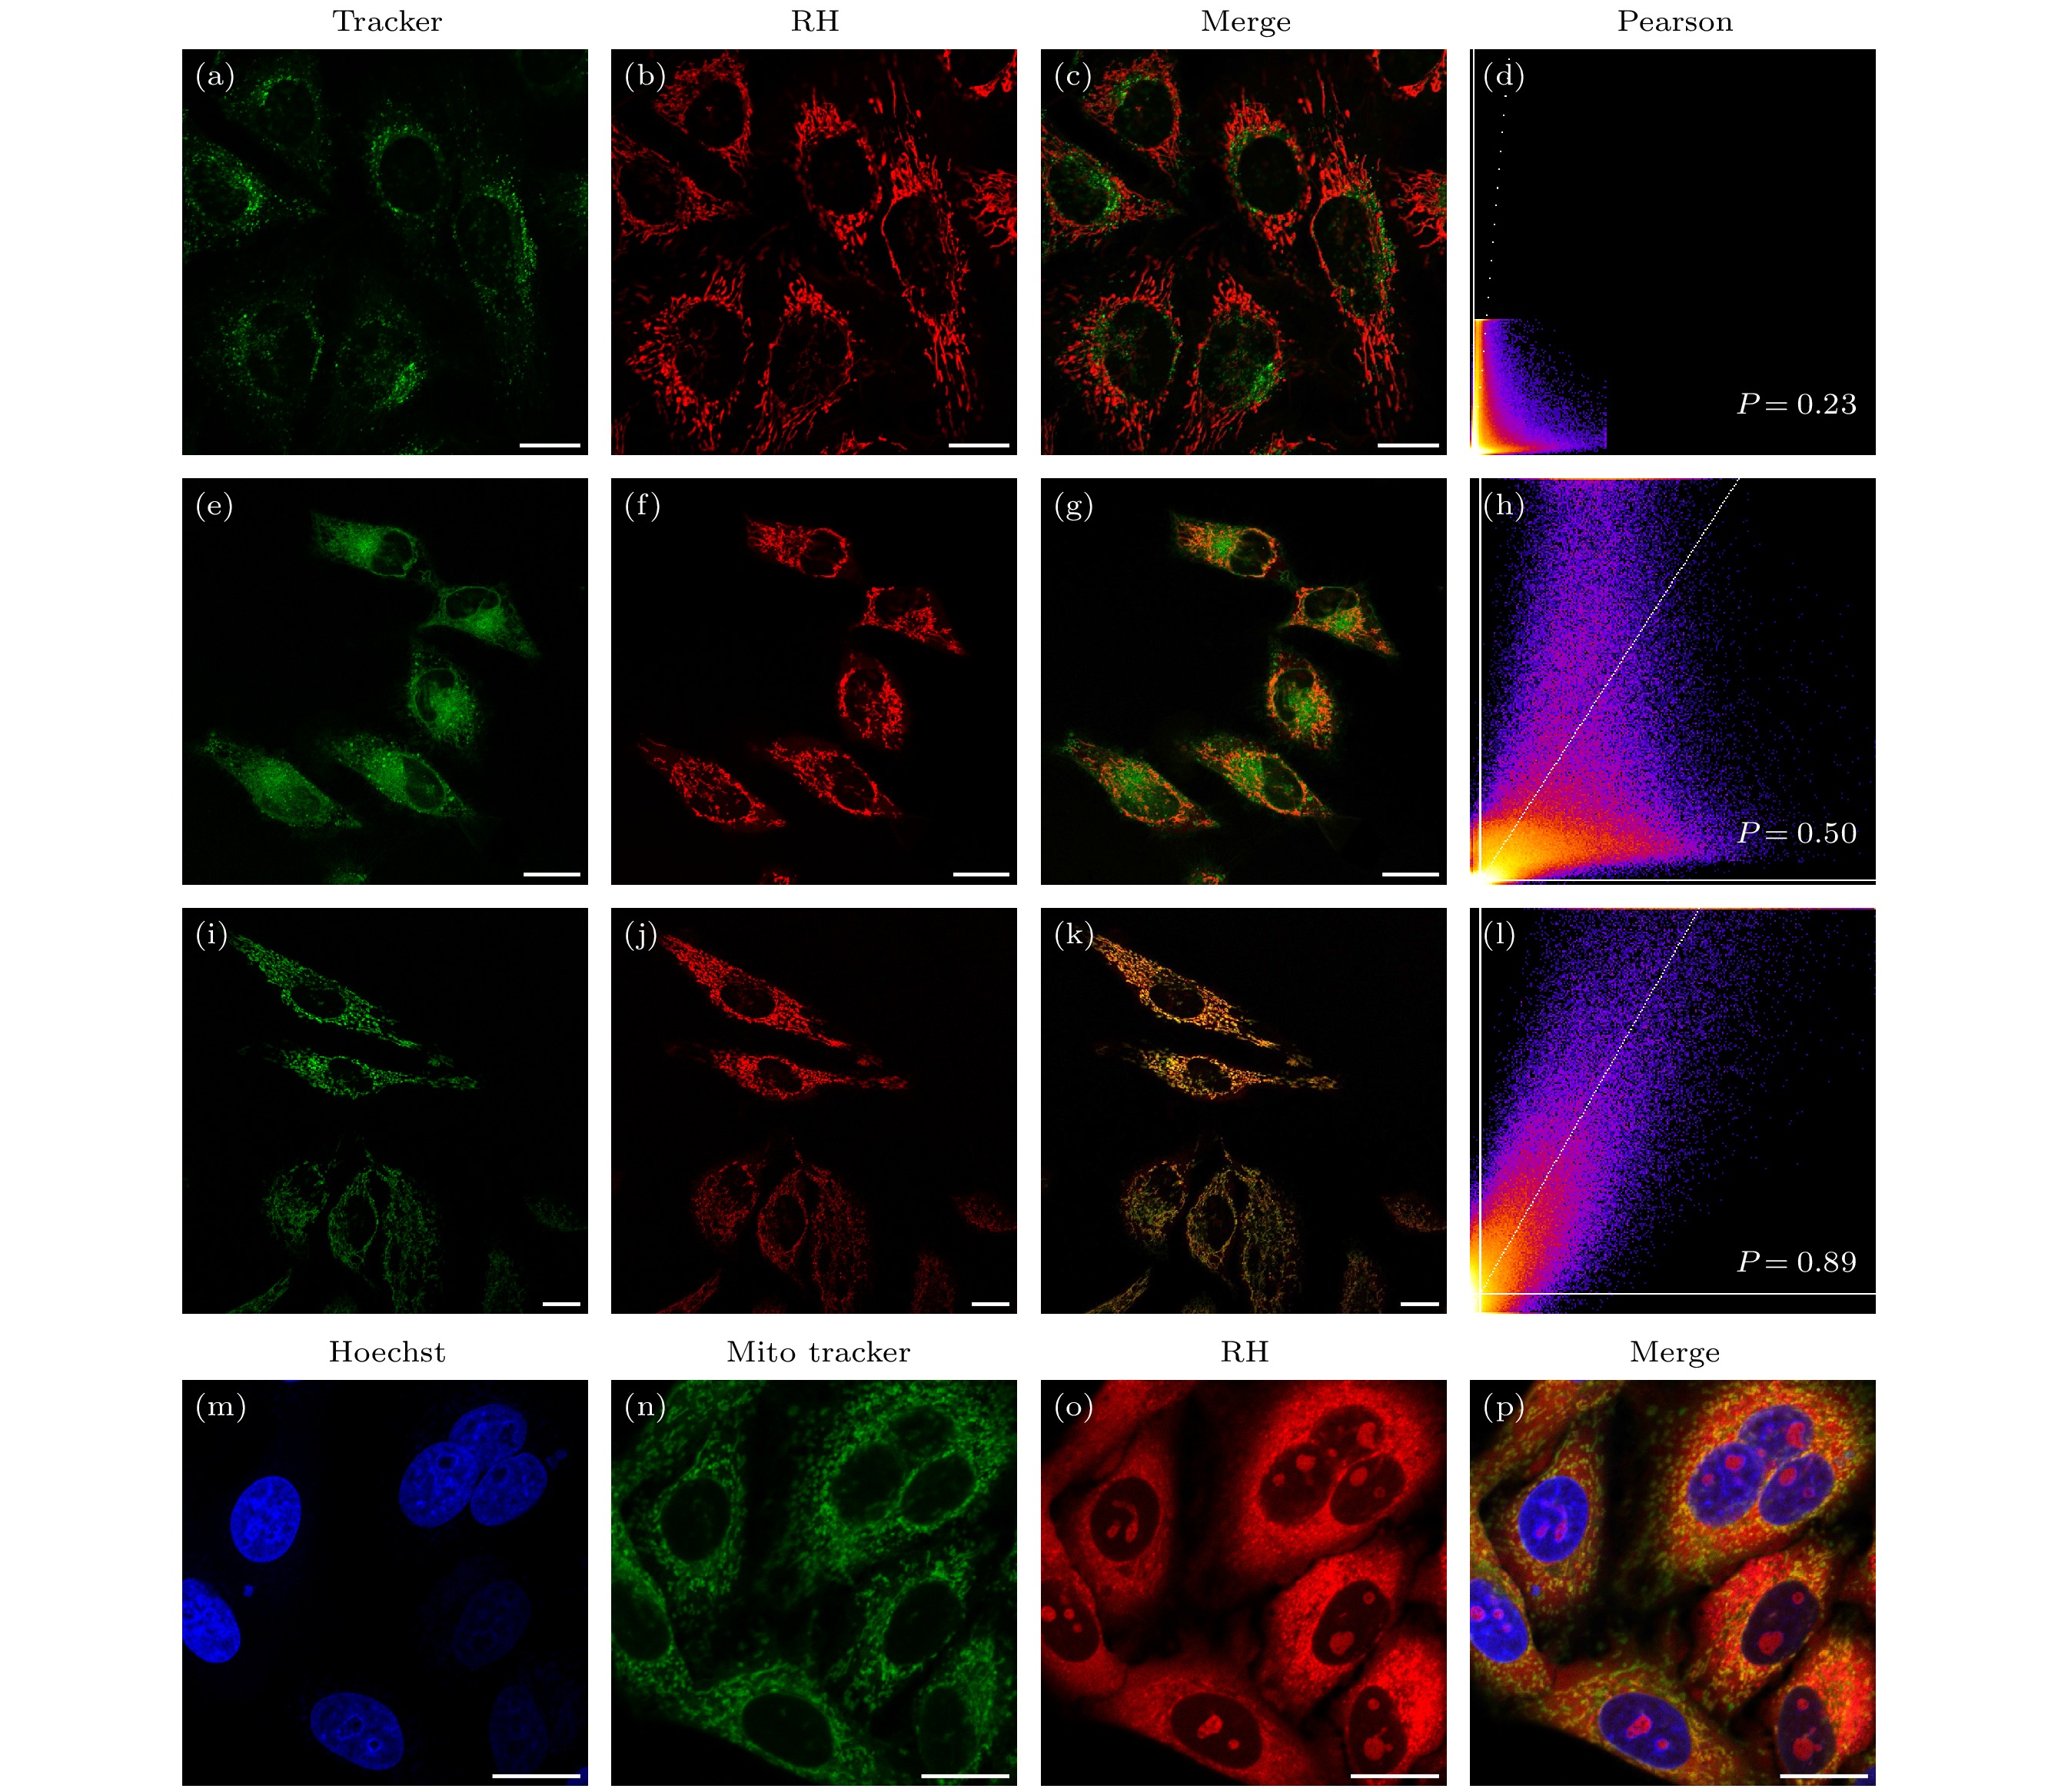
图 3 共定位实验 (a)—(c) RH探针 (0.5 μmol/L) 和溶酶体荧光探针 (0.05 μmol/L) 共定位结果; (e)—(g) RH探针 (0.5 μmol/L 和内质网荧光探针 (0.5 μmol/L) 共定位结果; (i)—(k) RH探针 (0.5 μmol/L) 和线粒体荧光探针 (0.5 μmol/L) 共定位结果; (m)—(p) RH探针 (2 μmol/L) 分别与细胞核探针Hoechst (0.2 μmol/L)和线粒体荧光探针 (0.5 μmol/L) 共定位结果; 标尺20 μm; (d), (h), (l) 由Image J软件计算得到的相应通道图像的Pearson共定位系数
Figure 3. Cell colocalization imaging: (a)–(c) The colocalization images of RH probe (0.5 μmol/L) and lysosomal fluorescence probe (0.05 μmol/L); (e)–(g) the colocalization images of RH probe (0.5 μmol/L) and ER fluorescence probe (0.5 μmol/L); (i)–(k) the colocalization images of RH probe (0.5 μmol/L) and mitochondrial fluorescence probe (0.5 μmol/L); (m)–(p) the co-localization images of the probe (RH) (2 μmol/L) with the commercial nuclear probe of Hoechst (0.2 μmol/L) and mitochondrial fluorescent probe of Mito-Tracker (0.5 μmol/L); scale bar is 20 μm; (d), (h), (l) the Pearson co-location coefficient of the corresponding channel image calculated by Image J software set, respectively.
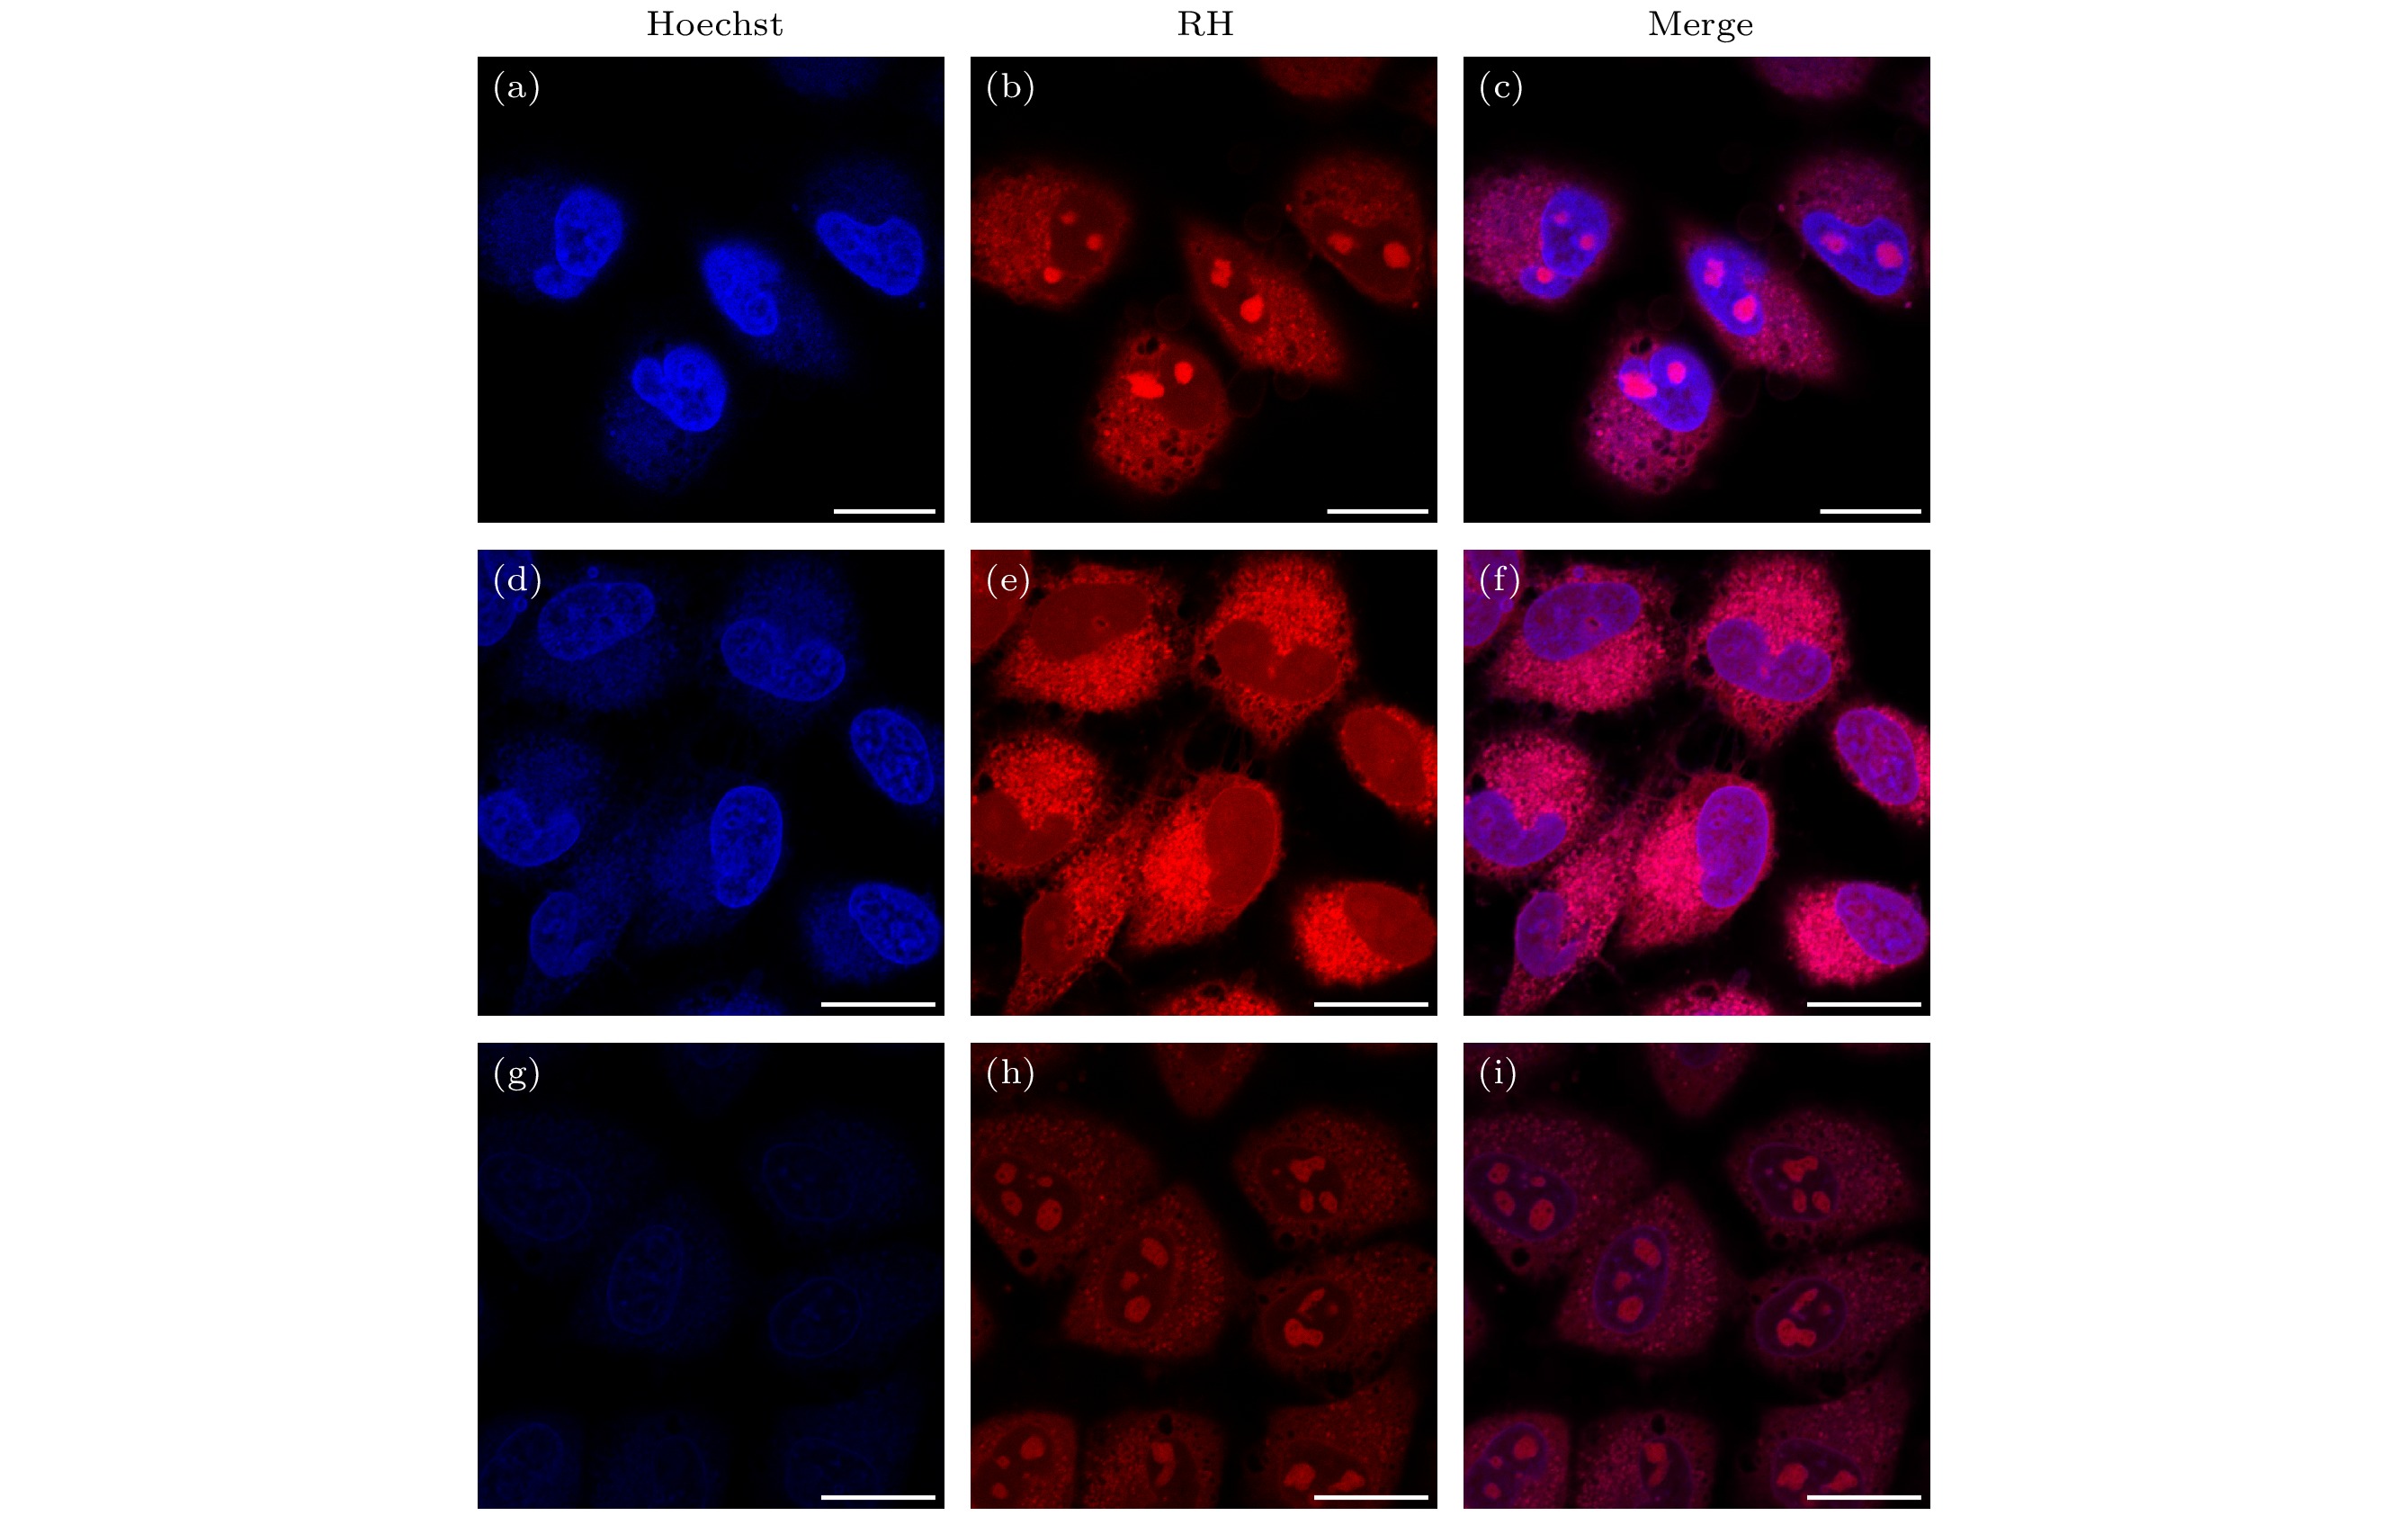
图 4 DNA与RNA水解酶水解实验 (a)—(c) 空白对照组; (d)—(f) 固定的HeLa细胞经过RNase A消化后的结果; (g)—(i) 固定的HeLa经过DNase I消化后的结果, 细胞先用4%多聚甲醛处理20 min固定, 之后分别用DNase I和RNase A消化2 h, 最后与RH探针(2 μmol/L)和Hoechst探针(0.2 μmol/L)共孵育30 min, 细胞成像前用PBS清洗两次, 标尺20 μm
Figure 4. Hydrolytic experiment on DNA and RNA using hydrolase: (a)–(c) Control group; (d)–(f) result of digestion of fixed HeLa cells by RNase A; (g)–(i) the result of digestion of fixed HeLa by DNase I; the cells were treated with 4% paraformaldehyde for 20 min, then digested with DNase I and RNase A for 2 h, respectively, and incubated with RH probe (2 μmol/L) and Hoechst probe (0.2 μmol/L) for 30 min; cells were washed twice with PBS before imaging. Scale bar is 20 μm.

图 5 活HeLa细胞线粒体FLIM (a) RH探针(0.5 μmol/L)染色30 min后标记的HeLa细胞; (b)—(h) 图(a)中红色边框选中的区域放大的图像, 记录了线粒体在光照刺激下30 min时间内发生的融合和断裂变化. 标尺5 μm
Figure 5. Fluorescence lifetime imaging of mitochondria in living cells: (a) HeLa cells labeled after 30 min staining with RH probe (0.5 μmol/L); (b)–(h) the enlarged images of the region selected by the red border in panel (a), which record the fusion and fracture changes of mitochondria within 30 min under the stimulation of light. Scale bar is 5 μm.

图 6 荧光寿命随光照时间变化 (a)—(d) RH探针(2 μmol/L)标记的HeLa细胞在长时间光照的共聚焦成像结果; (e)—(h) RH探针(2 μmol/L)标记HeLa细胞在长时间光照的荧光寿命变化情况; (i)—(l)分别为图(e)—(h)相应的荧光寿命的相位图, 荧光信号数据落在一个以坐标(0.5, 0)为中心, 0.5为半径的半圆轨迹上, 其中 G和S分别为相位图的横纵坐标(G = 1/(ω2 + τ2) , S = ωτ/(ω2 + τ2) , ω为激发光调制角频率, τ为荧光寿命)[34], 坐标(0, 0)代表寿命为无穷大, 坐标(1, 0)代表寿命为0; 标尺为10 μm
Figure 6. Fluorescence lifetime changes with illumination time: (a)–(d) Confocal imags of HeLa cells labeled with RH probe (2 μmol/L) under prolonged illumination; (e)–(h) the change in fluorescence lifetime of RH probe (2 μmol/L) labeled HeLa cells under prolonged illumination; (i)–(l) the phase diagram of the corresponding fluorescence lifetime of panels (e)–(h), respectively, and the fluorescence signal data falls on a semicircular trajectory with coordinates (0.5, 0) as the center and 0.5 as the radius, where G and S are the horizontal and vertical coordinates of the phase diagram (G = 1/(ω2 + τ2), S = ωτ/(ω2 + τ2), ω is the excitation light modulation angular frequency and τ is the fluorescence lifetime)[34], the coordinate (0, 0) represents infinite lifetime, and the coordinate (1, 0) represents 0 in lifetime; scale bar is 10 μm.

图 7 RH探针标记COS-7细胞和ID-8细胞的FLIM成像 (a), (b) 分别为低浓度RH (0.5 μmol/L)标记COS-7细胞和ID-8细胞线粒体的荧光寿命图像; (c), (d) 分别为高浓度RH (2 μmol/L) 标记COS-7细胞和ID-8细胞核仁的荧光寿命图像; (e)—(h) 分别为图(a)—(d)的荧光强度图像; (i)—(l) 分别为对应的荧光寿命图像的相位图
Figure 7. Fluorescence lifetime imaging of COS-7 cells and ID-8 cells labeled by RH probe: (a), (b) With low concentration RH (0.5 μmol/L), fluorescence lifetime images of mitochondria of COS-7 cells and ID-8 cells labeled, respectively; (c), (d) with high concentration RH (2 μmol/L), fluorescence lifetime images of nucleolus of COS-7 cells and ID-8 cells labeled, respectively; (e)–(h) the fluorescence intensity image of panels (a)–(d); (i)–(l) the phase diagram of the corresponding fluorescence lifetime image.
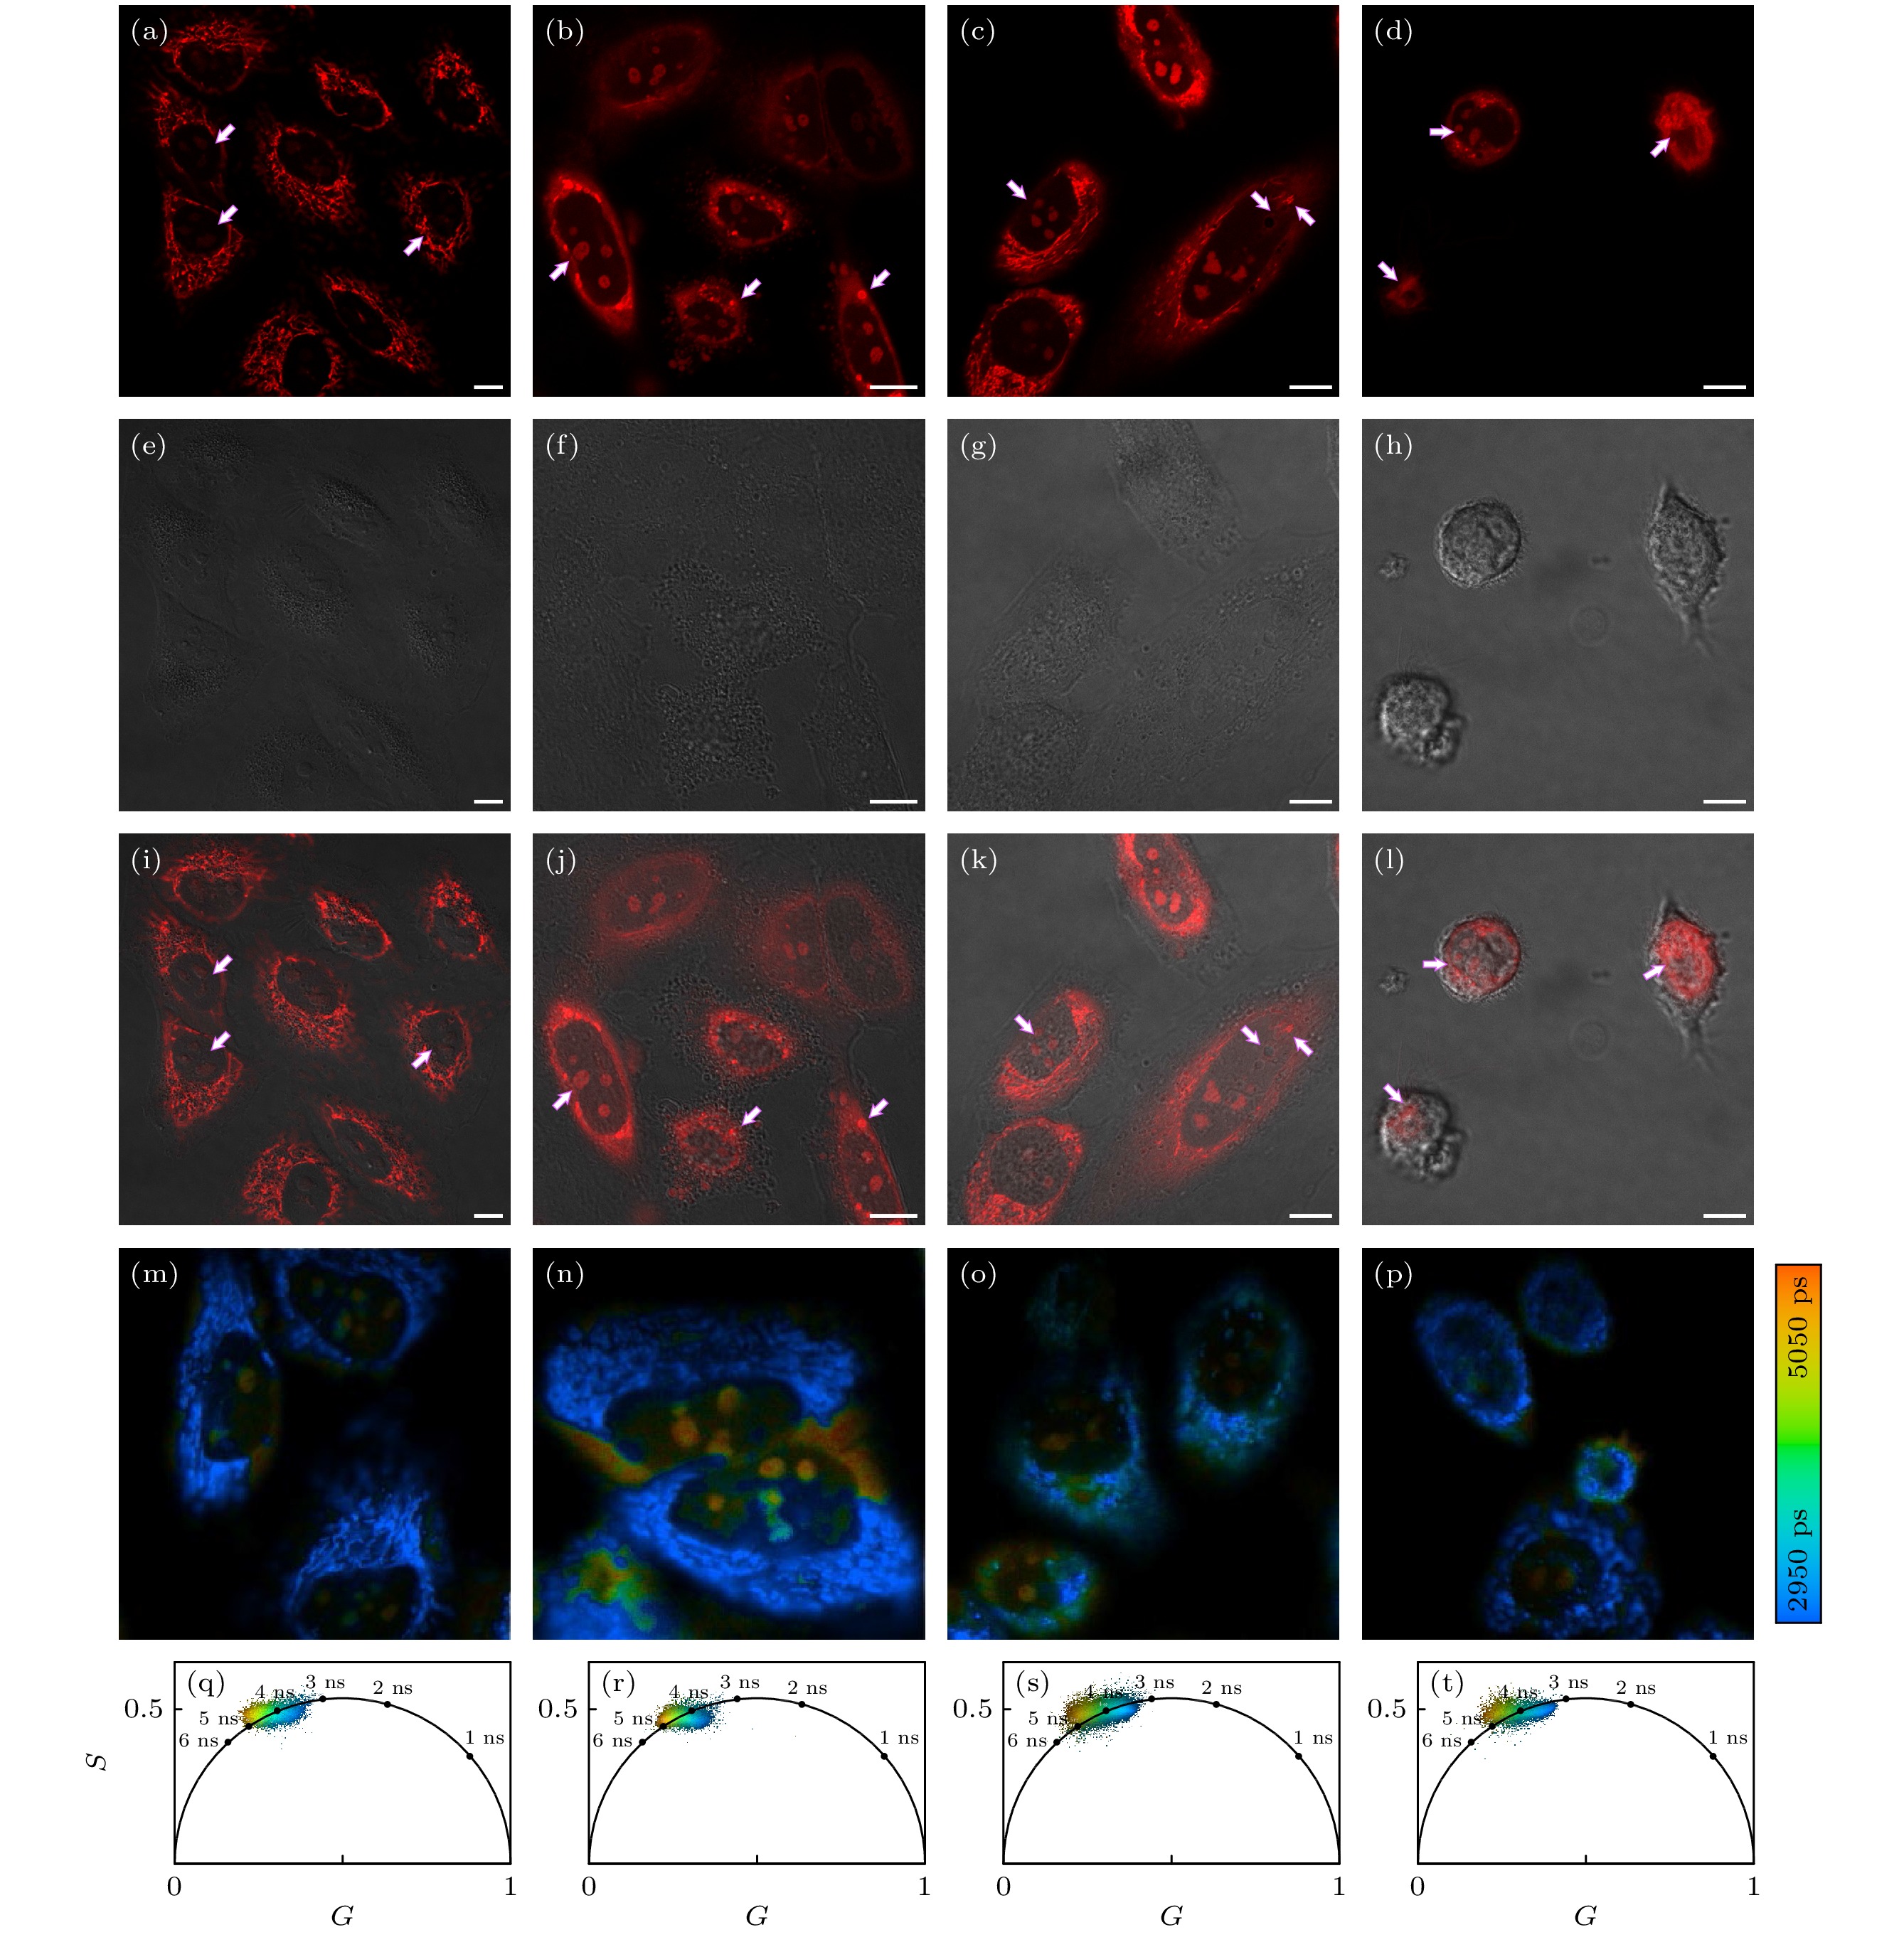
图 8 紫杉醇诱导细胞凋亡的CLSM成像图像与FLIM成像图像 (a)空白对照; (b)—(d) 紫杉醇 (0.1 μmol/L) 分别预先处理0.5, 1, 2 h 后RH探针 (2 μmol/L) 标记的HeLa细胞的共聚焦成像结果; (e)—(h) 对应的明场图像; (i)—(l) 红色通道和明场通道的叠加结果; (m)—(p) 分别为紫杉醇 (0.1 μmol/L) 预先处理0.5, 1, 2, 4 h后, RH探针 (2 μmol/L) 标记的HeLa细胞的荧光寿命图像; (q)—(t) 相应图像的相位图, 标尺10 μm.
Figure 8. Laser confocal imaging images and fluorescence lifetime imaging images of paclitaxel-induced apoptosis: (a) As a blank control; (b)–(d) the confocal image of HeLa cells labeled with RH probe (2 μmol/L) after 0.5 and 1, 2 hours of paclitaxel (0.1 μmol/L) pretreatment, respectively; (e)–(h) the corresponding bright field image, respectively; (i)—(l) the superposition result of red channel and bright field channel, respectively; (m)–(p) the fluorescence lifetime image of RH probe (2 μmol/L) labeled HeLa cells after pre-treatment with paclitaxel (0.1 μmol/L) for 0.5, 1, 2, 4 h, respectively; (q)–(t) phase diagram of the corresponding image, respectively, scale bar is 10 μm.
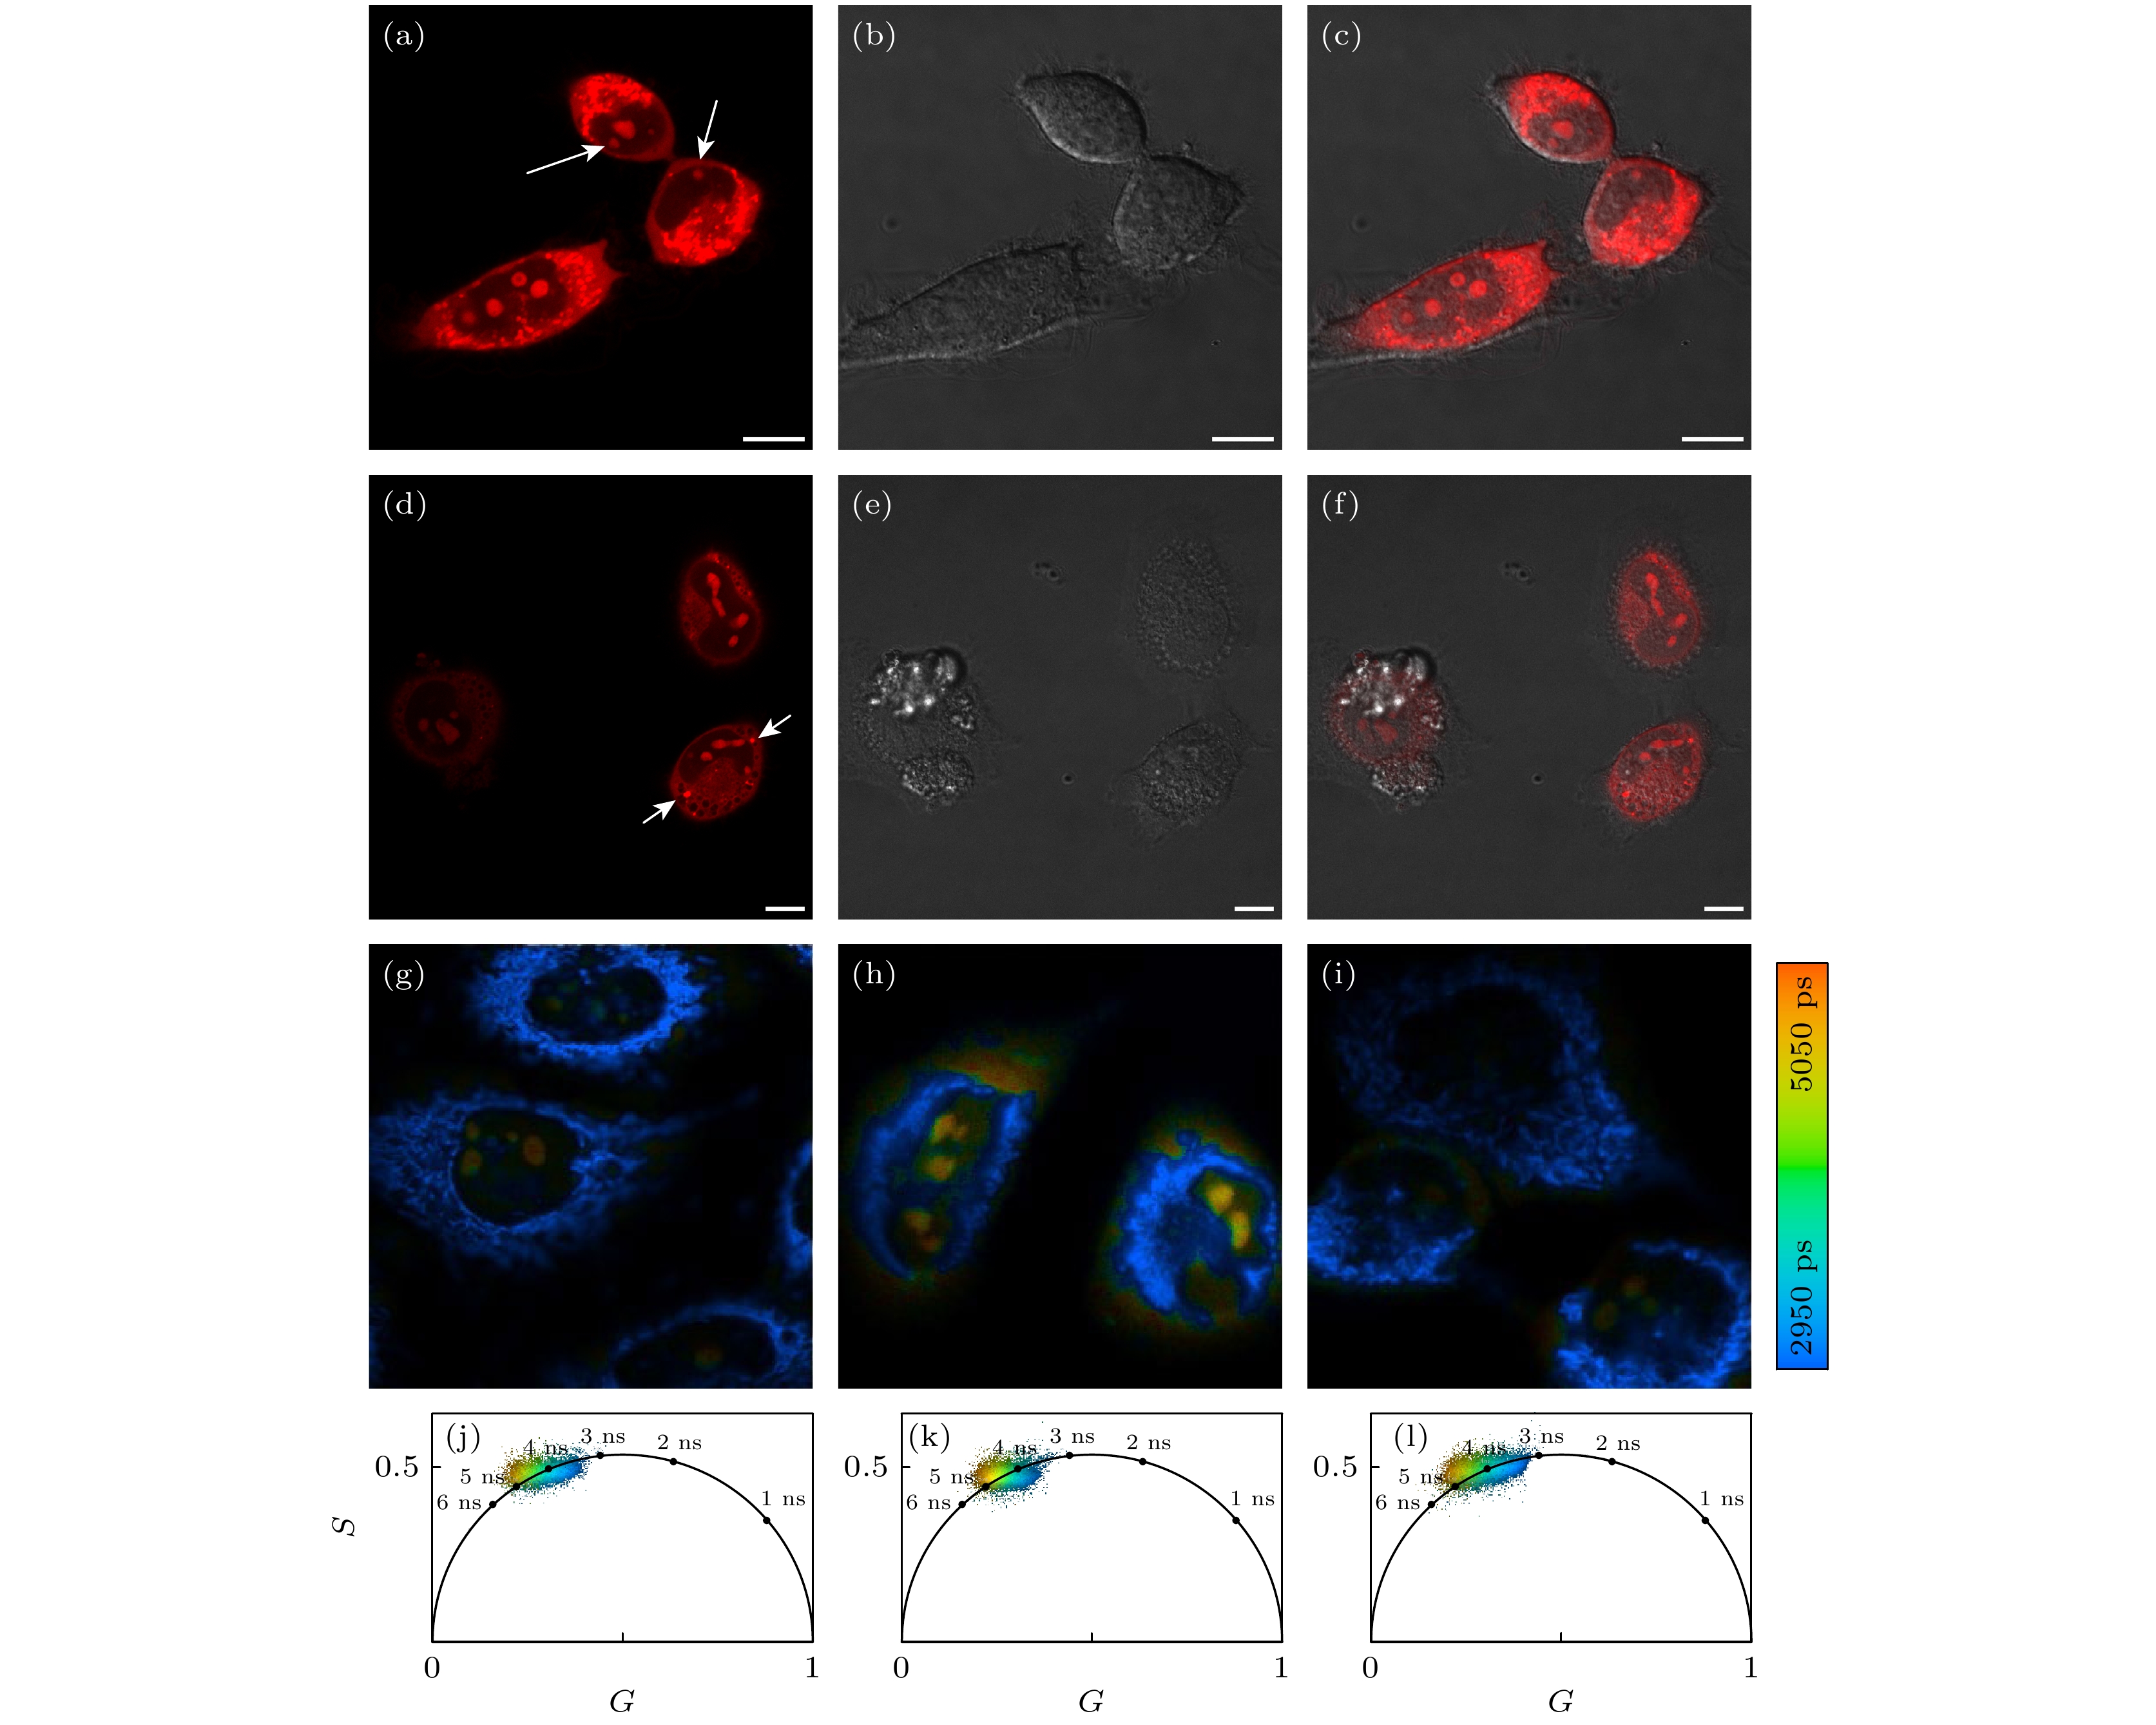
图 9 秋水仙碱诱导细胞凋亡CLSM成像图像与FLIM成像结果 (a)—(c) 10 nmol/L和(d)—(f) 100 nmol/L的秋水仙碱预先处理1 h后, RH探针(2 μmol/L)标记的HeLa细胞的共聚焦成像结果. (a), (d) RH探针红色通道图像; (b), (e) 相应的明场通道图像; (c), (f) 相应的红色通道和明场通道叠加的结果; (g) 空白对照; (h), (i) 分别为10 nmol/L和100 nmol/L的秋水仙碱预先处理1 h后, RH探针 (2 μmol/L) 标记HeLa细胞的荧光寿命图像; (j)—(l) 相应荧光寿命图像的相位图, 标尺10 μm
Figure 9. Confocal laser imaging images and fluorescence lifetime imaging results of colchicine-induced apoptosis: (a)–(c) 10 nmol/L and (d)–(f) 100 nmol/L is respectively the confocal image of HeLa cells labeled with RH probe (2 μmol/L) after 1 h pre-treatment with colchicine. (a), (d) Red channel images of RH probe; (b), (e) the corresponding bright field channel images; (c), (f) the superposition result of the corresponding red channel and bright field channel; (g) a blank control; (h), (i) fluorescent lifetime image of HeLa cells labeled with RH probe (2 μmol/L) after pre-treatment with 10 nm and 100 nm colchicine for 1 h, respectively; (j)–(l) the phase diagram of the corresponding fluorescence lifetime image, respectively, scale bar is 10 μm.
表 1 探针RH在不同溶剂中的吸收发射波长及荧光寿命
Table 1. Absorption, emission wavelength and fluorescence lifetime of probe RH in different solvents.
溶剂 λabs/nm λem/nm τ/ns 二氯甲烷 577 588 3.89 乙腈 574 590 4.19 乙醇 573 587 4.15 丙酮 575 591 4.12 水 574 590 3.73  DownLoad: CSV
-
[1] Dutta T, Das S, Gupta I, Koner A L 2022 Chem. Sci. 13 12987
Google Scholar
[2] Lafontaine D L J, Riback J A, Bascetin R, Brangwynne C P 2021 Nat. Rev. Mol. Cell Biol. 22 165
Google Scholar
[3] Yusupov M M, Yusupova G Z, Baucom A, Lieberman K, Earnest T N, Cate J H, Noller H F 2001 Science 292 883
Google Scholar
[4] Fischer A H, Bardarov S J, Jiang Z 2004 J. Cell. Biochem. 91 170
Google Scholar
[5] Derenzini M, Trerè D, Pession A, Govoni M, Sirri V, Chieco P 2000 J. Pathol. 191 181
Google Scholar
[6] Rozenblum G T, Lopez V G, Vitullo A D, Radrizzani M 2016 Expert Opin. Drug Discov. 11 127
Google Scholar
[7] Kao H P, Abney J R, Verkman A S 1993 J. Cell Biol. 120 175
Google Scholar
[8] Tian M, Sun J, Dong B L, Lin W Y 2019 Sens. Actuators B Chem. 292 16
Google Scholar
[9] Yang Z G, Cao J F, He Y X, Yang J H, Kim T Y, Peng X J, Kim J S 2014 Chem. Soc. Rev. 43 4563
Google Scholar
[10] Dickinson B C, Chang C J 2011 Nat. Chem. Biol. 7 504
Google Scholar
[11] Reddy P H, Beal M F 2008 Trends Mol. Med. 14 45
Google Scholar
[12] Lin M T, Beal M F 2006 Nat. Rev. 443 787
Google Scholar
[13] Seo A Y, Joseph A M, Dutta D, Hwang J C, Aris J P, Leeuwenburgh C 2010 J. Cell Sci. 123 2533
Google Scholar
[14] Wallace D C 2012 Nat. Rev. Cancer 12 685
Google Scholar
[15] Suen D F, Norris K L, Youle R J 2008 Genes Dev. 22 1577
Google Scholar
[16] Huang H Y, Yang L, Zhang P Y, et al. 2016 Biomaterials 83 321
Google Scholar
[17] Sun L, Chen Y, Kuang S, Li G, Guan R, Liu J, Ji L, Chao H 2016 Chem 22 8955
Google Scholar
[18] Müller W E, Eckert A, Kurz C, Eckert G P, Leuner K 2010 Mol. Neurobiol. 41 159
Google Scholar
[19] Parlato R, Liss B 2014 Biochim. Biophys. Acta 1842 791
Google Scholar
[20] Boulon S, Westman B J, Hutten S, Boisvert F M, Lamond A I 2010 Mol. Cell 40 216
Google Scholar
[21] Iarovaia O V, Minina E P, Sheval E V, et al. 2019 Trends Cell Biol. 29 647
Google Scholar
[22] Day R N, Davidson M W 2009 Chem. Soc. Rev. 38 2887
Google Scholar
[23] Grimm J B, English B P, Chen J, et al. 2015 Nat. Methods 12 244
Google Scholar
[24] Kim H M, Cho B R 2015 Chem. Rev. 115 5014
Google Scholar
[25] Yang Y, Zhao Q, Feng W, Li F 2013 Chem. Rev. 113 192
Google Scholar
[26] Samanta S, Lai K, Wu F, Liu Y, Cai S, Qu J, Yang Z 2023 Chem. Soc. Rev. 52 7197
Google Scholar
[27] Yang Z G, He Y X, Lee J H, et al. 2013 J. Am. Chem. Soc. 135 9181
Google Scholar
[28] Yu L, Verwilst P, Shim I, Zhao Y Q, Zhou Y, Kim J S 2021 J. Chin. Chem. Soc. 3 2725
Google Scholar
[29] Ranjit S, Malacrida, Jameson D M, Gratton E 2018 Nat. Protoc. 13 1979
Google Scholar
[30] Zhang D, He Y, Wang J L, Wu L Y, Liu B, Cai S T, Li Y, Yan W, Yang Z G, Qu J L 2022 J. Biophoton. 15 e202200006
Google Scholar
[31] He Y, Shin J, Gong W J, et al. 2019 Chem. Commun. 55 2533
Google Scholar
[32] Peng X J, Yang Z G, Wang J Y, et al. 2011 J. Am. Chem. Soc. 133 6626
Google Scholar
[33] Koyama T, Zhu M Y, Araiso T, Kinjo M, Kitagawa H, Sugimura M 1990 Jpn. J. Physiol. 40 65
Google Scholar
[34] 林丹樱, 牛敬敬, 刘雄波, 张潇, 张娇, 于斌, 屈军乐 2020 物理学报 69 168703
Google Scholar
Lin D Y, Niu J J, Liu X B, Zhang X, Zhang J, Yu B, Qu J L 2020 Acta Phys. Sin. 69 168703
Google Scholar
[35] Wang T H, Wang H S, Soong Y K 2000 Cancer 88 2619
Google Scholar
[36] Lieu C H, Chang Y N, Lai Y K 1997 Biochem. Pharmacol. 53 1587
Google Scholar
[37] Dalbeth N, Lauterio T J, Wolfe H R 2014 Clin. Ther. 36 1465
Google Scholar
[38] Paschke S, Weidner A F, Paust T, Marti O, Beil M, Ben-Chetrit E 2013 J. Leukoc. Biol. 94 1091
Google Scholar

 DownLoad:
Catalog
Metrics
- Abstract views: 594
- PDF Downloads: 34
- Cited By: 0
