


-
A new method for material dynamic density measurement based on proton photography is developed at XGIII facility. The protons produced by the picosecond laser of XGIII was used as the proton source to diagnose the density distribution of lattice foam under the compression of the nanosecond beam of XGIII. The density of lattice foam was calculated from the photographic results using Monte Carlo simulation method. Benefitting fromn this newly developed method, the images of the compressed lattice foam and the shock front at 5.2 ns is obtained successfully. The density distribution of the lattice foam was obtained from the images and the density of lattice foam increases about 20 times at the shock front due to the compression of the shock. The velocity of shock wave in lattice foam is also given, about 40 km/s. The density and spatial resolution of the method are further calibrated by using diamond step objects, and experimental results show that they are better than 4% and 12 μm, respectively. In order to further improve the density and spatial resolution of the proton photography at XGIII facility, a new radiogrphy method utilizing quasimonoenergetic proton beams obtained from an energy selector is proposed in this paper, and the resolution of this method is simulated by Monte Carlo program. The simulation results show that the relative density resolution can be improved to more than 1%. Through the above experimental and the simulation results, we demonstrated that diagnostic capability has been established for fast process (nanosecond scale), high pressure (nearly 100 GPa) conditions at XGIII facility.
-
Keywords:
- Proton radiography /
- Fluid simulation
[1] Ma T, Hurricane O A, Callahan D A, et al. 2015 Phys. Rev. Lett. 114 145004
 Google Scholar
[2] Lindl J, Landen O, Edwards J, Moses E, Team N 2014 Phys. Plasmas 21 020501
Google Scholar
[3] Benuzzi-Mounaix A, Loupias B, Koenig M, Ravasio A, Ozaki N, Rabec le Gloahec M, Vinci T, Aglitskiy Y, Faenov A, Pikuz T, Boehly T 2008 Phys. Rev. E 77 045402
[4] Ravasio A, Koenig M, Le Pape S, et al. 2008 Phys. Plasmas 15 060701
Google Scholar
[5] Ravasio A, Romagnani L, Pape S L, et al,. 2010 Phys. Rev. E 82 016407
Google Scholar
[6] Mackinnon A J, Patel P K, Borghesi M, et al. 2006 Phys. Rev. Lett. 97 045001
Google Scholar
[7] Borghesi M, Mackinnon A J, Campbell D H, Hicks D G, Kar S, Patel P K, Price D, Romagnani L, Schiavi A, Willi O 2004 Phys. Rev. Lett. 92 055003
Google Scholar
[8] Teng J, Zhao Z Q, Zhu B, Hong W, Cao L F, Zhou W M, Shan L Q, Gu Y Q 2011 Chin. Phys. Lett. 28 035203
Google Scholar
[9] Aydelotte B, Golt M, Schuster B, Allison J, Cherne F, Freeman M, Hollander B, Jensen B, Lopez J, Mariam F, et al. 2019 Dynamic Behavior of Materials (Vol. 1) (Berlin: Springer) pp127–131
[10] Cherne F J, Jensen B J, Tang Z, Freeman M S 2020 AIP Conference Proceedings 2272 120004
Google Scholar
[11] Le Pape S, Koenig M, Vinci T, Martinolli E, Bennuzzi-Mounaix A, Hicks D, Patel P, Mackinnon A, Romagnani L, Borghesi M, Kar S, Boehly T 2006 High Energy Density Physics 2 1
Google Scholar
[12] Hua R, Sio H, Wilks S C, Beg F N, McGuffey C, Bailly-Grandvaux M, COllins G W, Ping Y 2017 Appl. Phys. Lett. 111 034102
Google Scholar
[13] Ostermayr T M, Kreuzer C, Englbrench S, et al. 2020 Nat. Commun. 11 6174
Google Scholar
[14] Teng J, Hong W, He S K, et al. 2017 High Power Laser And Part. Beams 29 092001
[15] Bloch F 1933 Ann. Phys. 408 285
Google Scholar
[16] Meinecke J, Tzeferacos P, Bell A, Gregori G 2015 PNAS 112 8211
Google Scholar
[17] Rigby A, Cruz F, Albertazzi B, et al. 2018 Nat. Phys. 14 475
Google Scholar
[18] Meinecke J, Doyle H, Miniati F, et al. 2014 Nat. Phys. 10 520
Google Scholar
[19] Ren J R, Deng Z G, Qi W, et al. 2020 Nat. Commun. 11 5157
Google Scholar
-
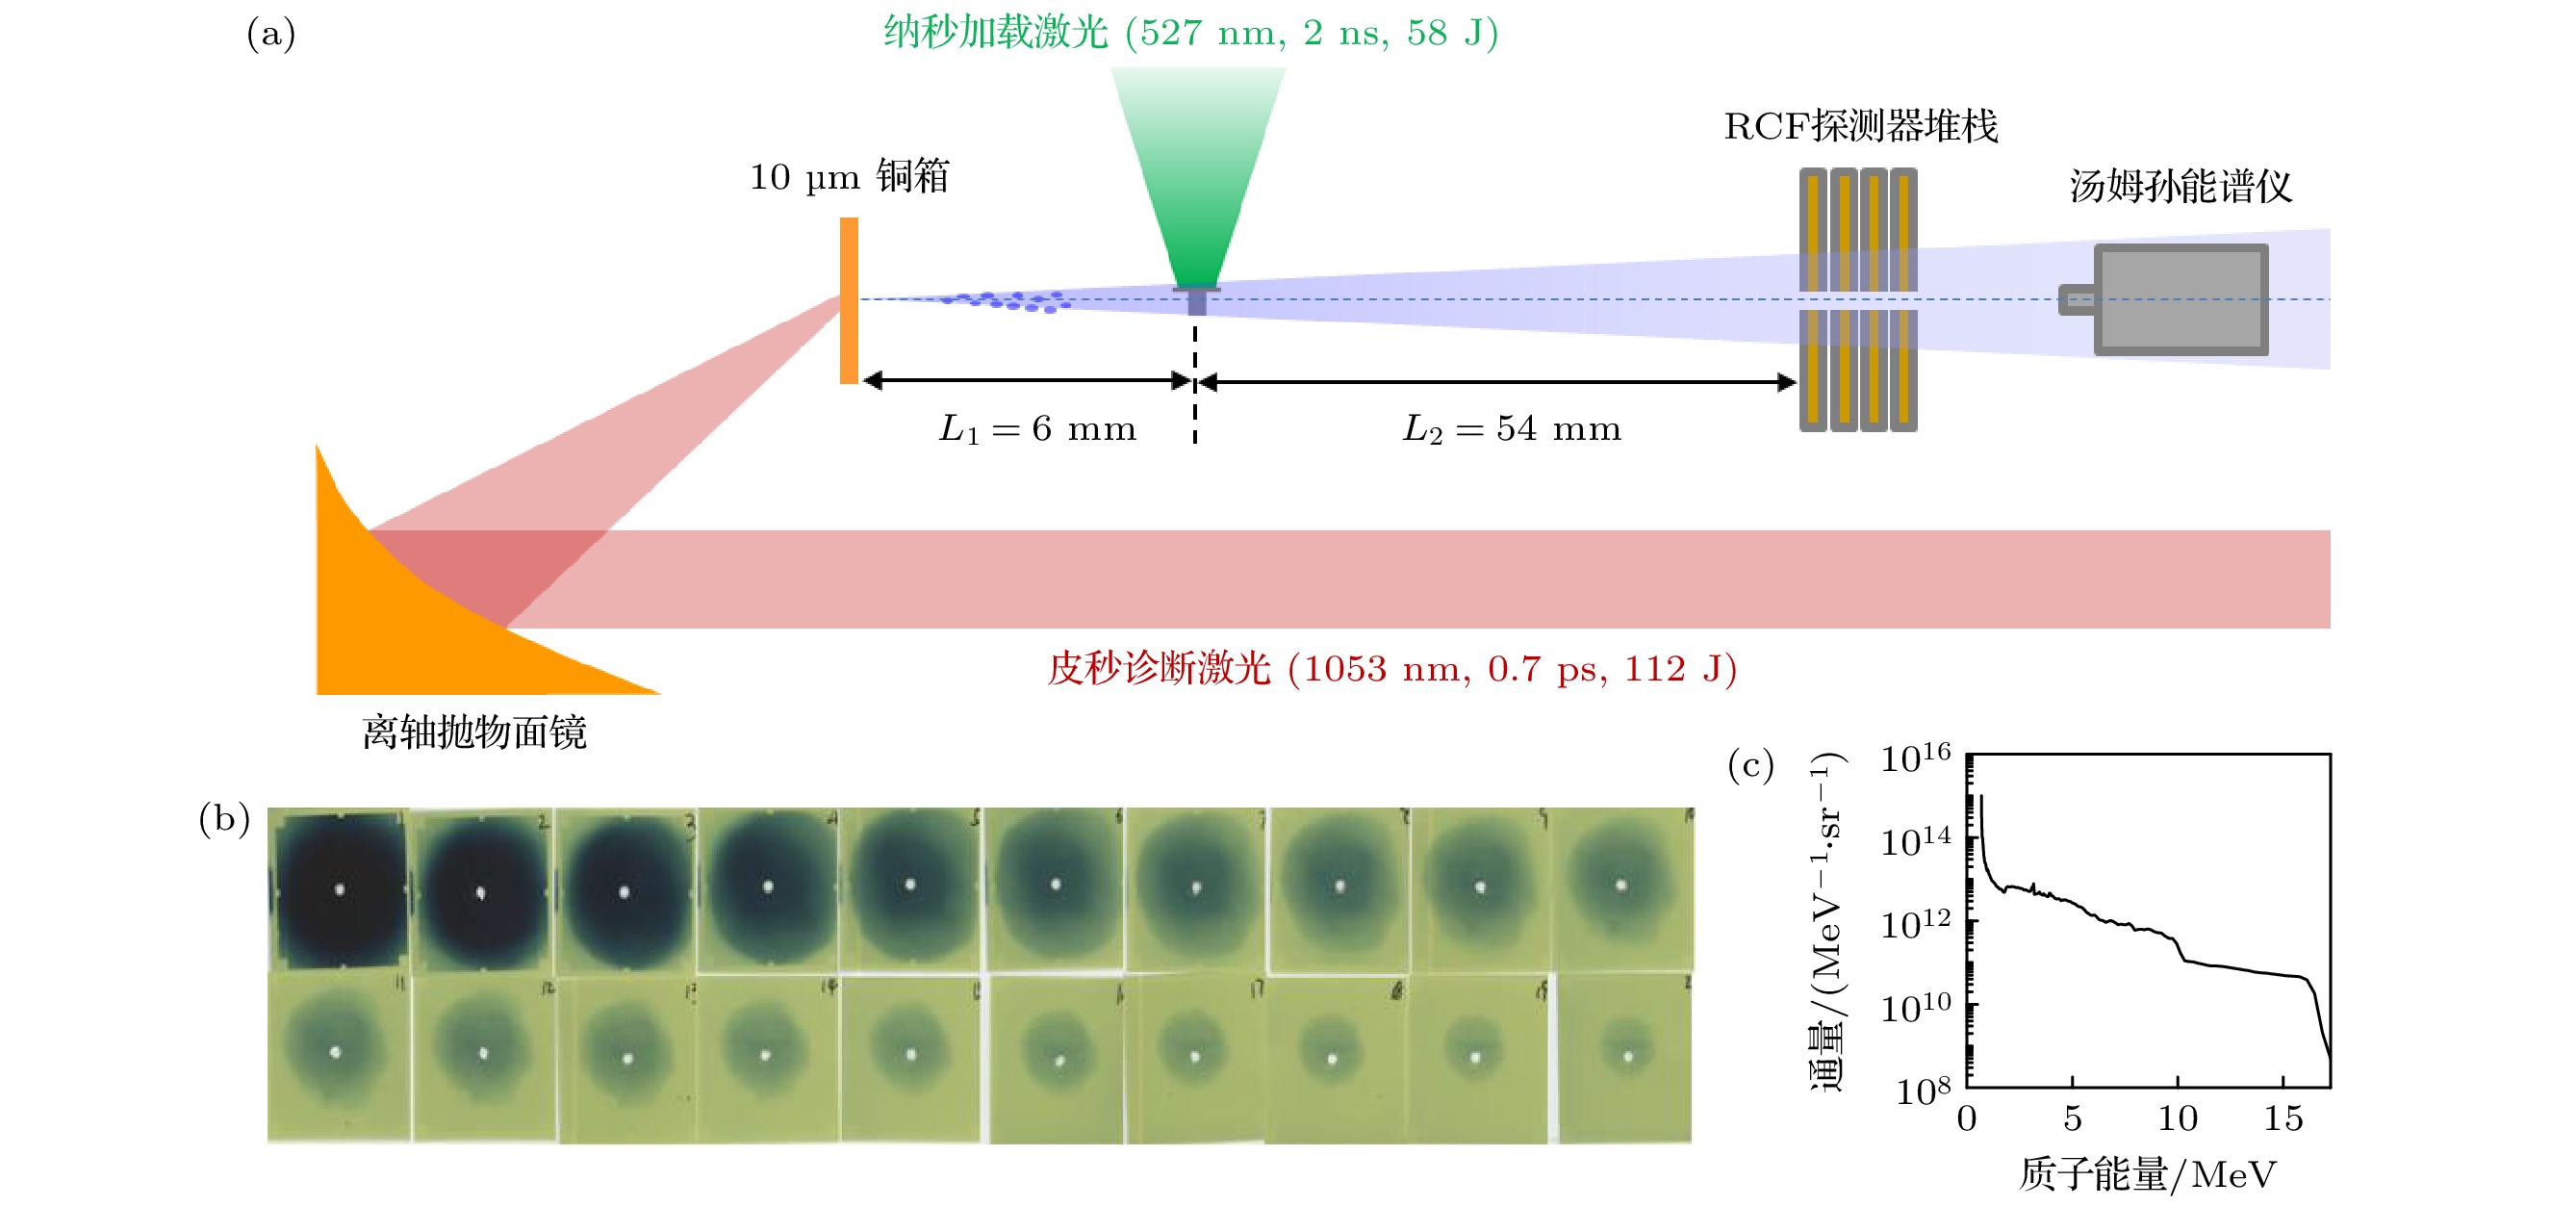
图 1 (a) 实验布局示意图; (b) RCF堆栈获得的质子角分布; (c) 汤姆孙谱仪测得的质子能谱
Figure 1. (a) Schematic diagram of the experimental setup; (b) measured angular distribution of the protons by RCF; (c) measured proton spectrum by the Thomson parabolic spectrometer
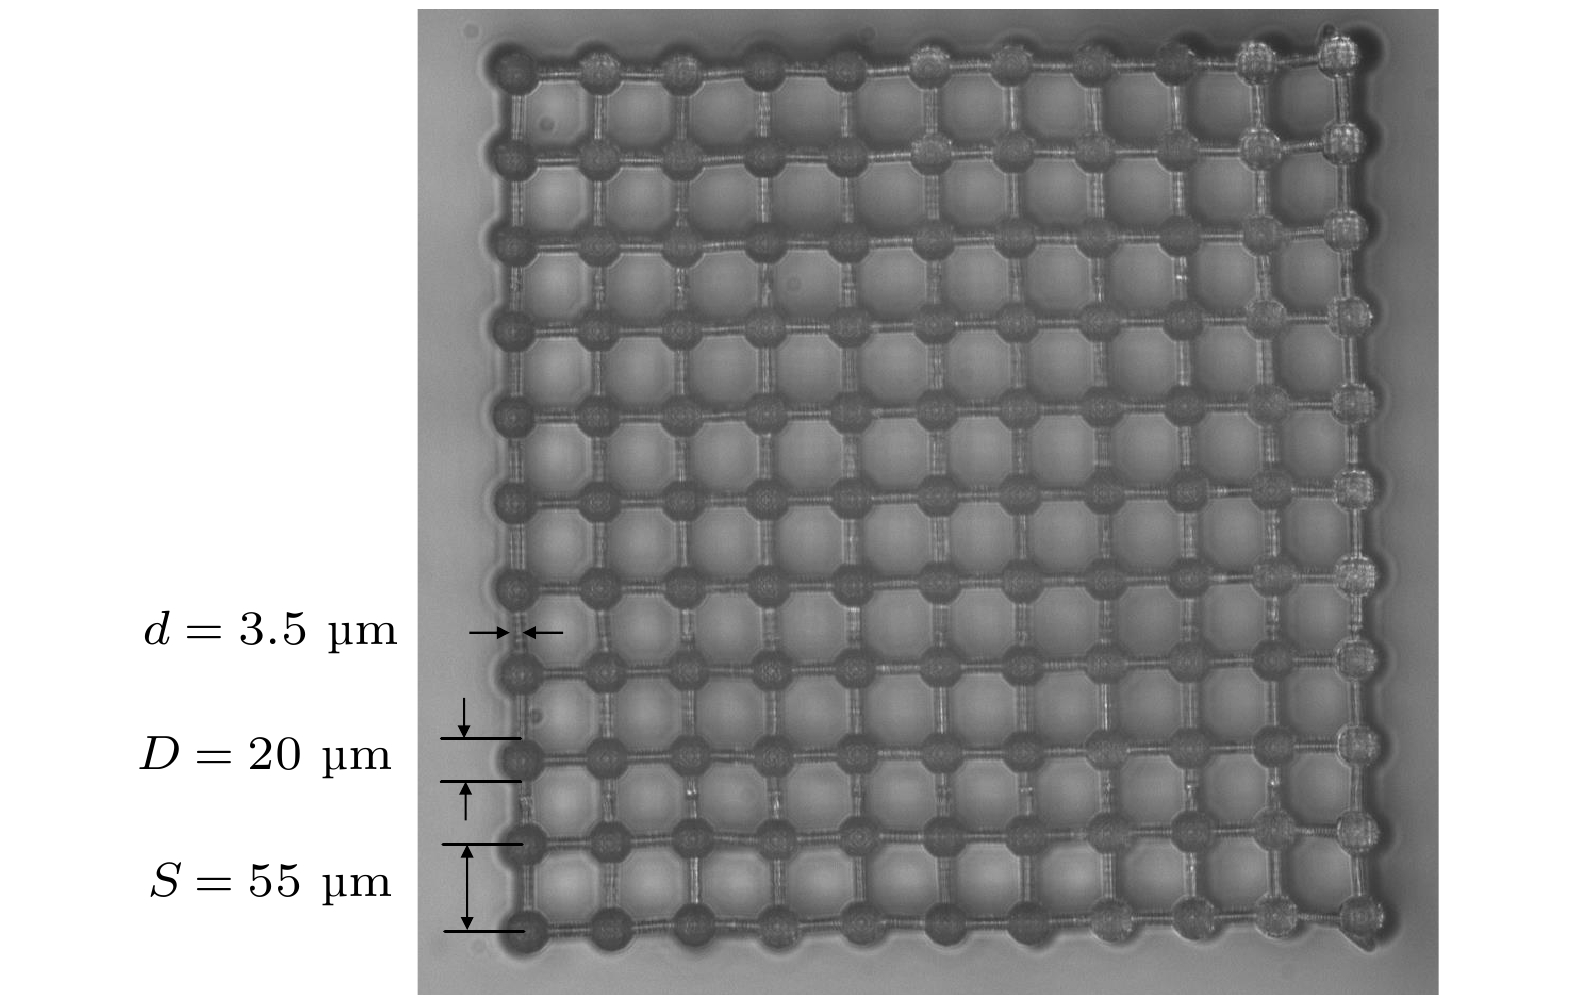
图 2 晶格泡沫光学显微镜照片
Figure 2. Optical microscope image of the lattice foam
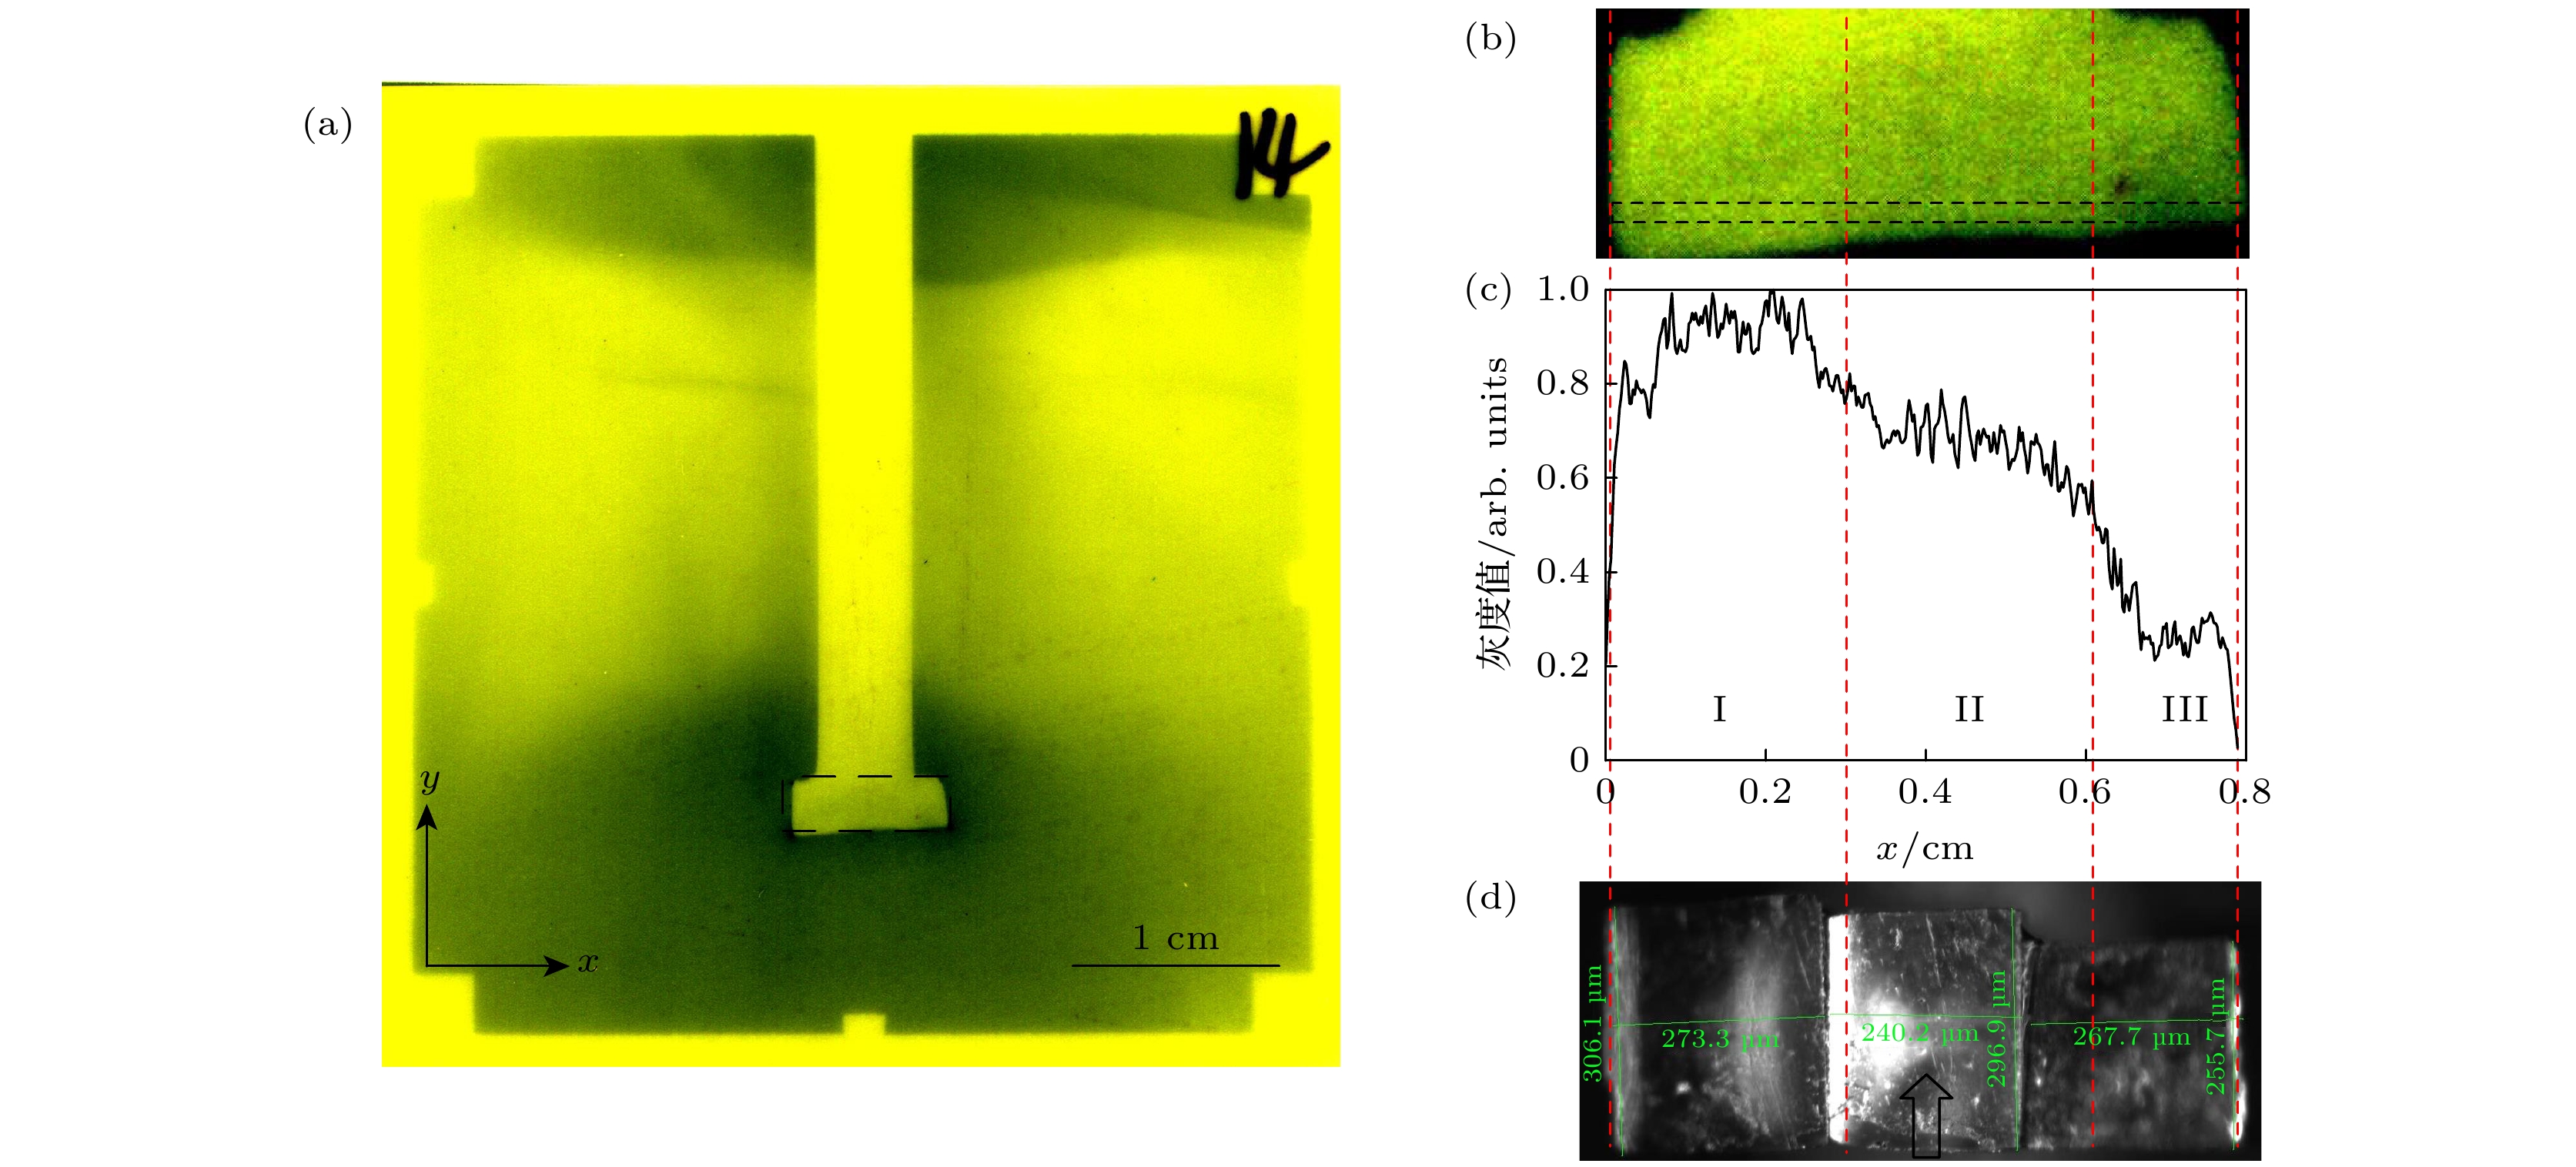
图 3 静态质子照相实验结果 (a) 第14片RCF上获得的金刚石台阶图像; (b) 图(a)中黑色虚线框区域的放大图像; (c) 图(b)中黑色虚线框部分的灰度值曲线; (d) 金刚石台阶的光学显微镜图像, 图中的黑色箭头表示质子传播方向. 图中的四条竖直红色虚线为根据图(b)中灰度曲测得的三级金刚石台阶的边界
Figure 3. Results of static proton radiography experiment: (a) Image of the diamond steps obtained on the 14 th RCF; (b) enlarged image of the black dotted box area in panel (a); (c) gray value curve of the part of black dotted box in panel (b); (d) optical microscope image of the diamond steps with the black arrow indicating the direction of proton propagation. The four vertical red dotted lines in the figure are the boundaries of the three diamond steps measured according to the gray value in panel (b)

图 4 (a) 第6片RCF (对应质子能量7.2 MeV)上, 纳秒激光压缩后的冲击靶质子图像, 采集于纳秒激光发射后5.2 ns; (b)二维柱对称FLASH程序模拟得到的5.2 ns时刻的烧蚀靶密度分布, 模拟参数为: 纳秒激光为脉宽2 ns的方波, 能量60 J, 焦斑1 mm, 烧蚀靶的参数与第2节给出的光学显微镜测量结果一致, 初始位于
$ 200—800\;{\text{ μm}} $ , 0—200$ {\text{ μm}} $ 为铝基底; (c) 黑色实线为图(a)黑色方框区域的灰度值随位置的变化关系, 黑色虚线为利用蒙特卡罗方法模拟质子穿过图(b)中得到的密度分布后在第6片RCF得到的灰度曲线; (d) 黑色线为图(b)中$ x=512\;{\text{ μm}} $ 线上的密度分布, 红色虚线为相应位置处靶的初始密度分布Figure 4. (a) Proton image on the 6th RCF (corresponding to proton energy 7.2 MeV), showing the density profile of the ablated target compressed by the nanosecond laser at
$ t=5.2 \;{\rm {ns}} $ after the nanosecond laser emission. (b) Density distribution of the ablation target at 5.2 ns simulated by the FLASH code. The simulation parameters are as follows: the nanosecond laser is a square wave with pulse width of 2 ns, energy of 60 J and focal spot of 1 mm; the parameters of the ablation target are consistent with the experimental parameters given in section 2. The target locates initially between 200 and$ 800\;{\text{ μm}} $ , and the aluminum base occupies the space of 0–200$ {\text{ μm}} $ . (c) The solid black line is the gray value in the area indicated by the black box in panel (a), the dotted black line is the gray value obtained in the 6th RCF after the Monte Carlo method is used to simulate protons passing through foam with the same density profile shown in panel (b). (d) the black line indicates the density distribution on$x=512 \;{\text{ μm}}$ in panel (b), and the dotted red line is the initial density distribution of the target at the corresponding position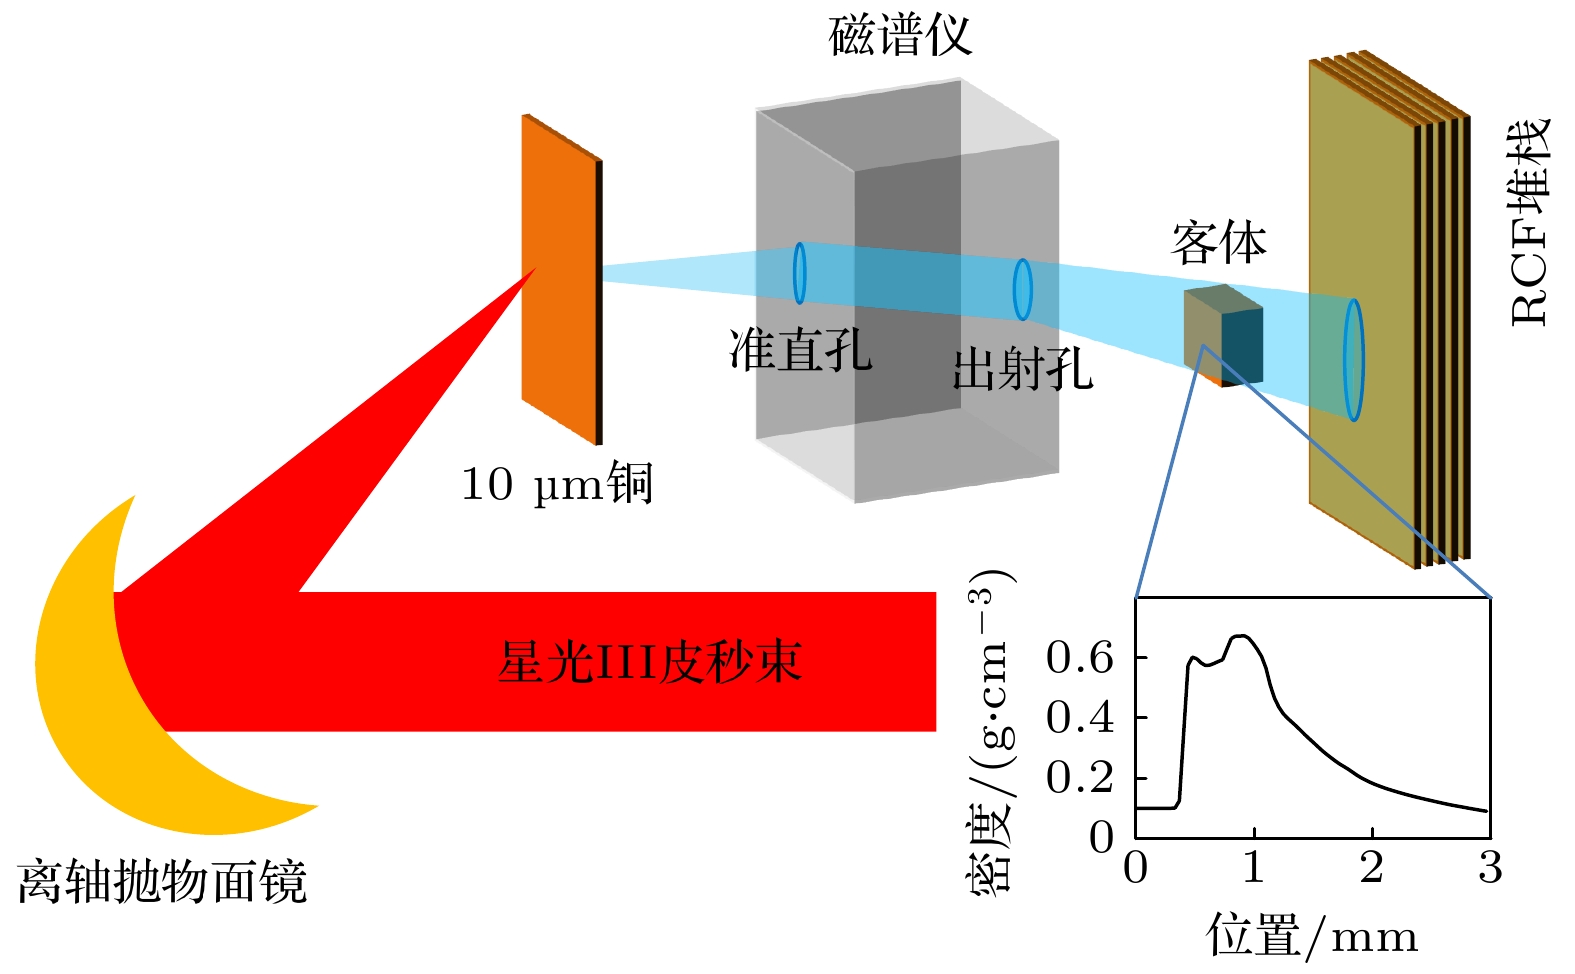
图 5 准单能质子照相实验排布示意图
Figure 5. Schematic diagram of the experimental setup using quasi-monoenergetic protons

图 6 不同能散下模拟得到的RCF上的质子图像 (a)—(d)
$ E_k=10\;{\rm{MeV}} $ 第2—5片RCF上的质子图像; (f)—(i)$ E_k= $ $ 10\;{\rm{MeV}} $ ,$ \sigma=0.4{\text{ MeV}} $ 时, 第2—5片RCF上的质子图像; (k)—(n)$ E_k= $ $ 10\;{\rm{ MeV}} $ ,$ \sigma=0.8{\text{ MeV}} $ 时, 第2—5片RCF上的质子图像. 图(e), (j), (o)为照相客体密度分布. 红色虚线标识出了RCF图像与客体密度区域的对应关系Figure 6. Simulated proton images on 2nd–5th RCF: (a)–(d)
$ E_k=10{\text{ MeV}}$ ; (f)–(i)$ E_k=10{\rm{ MeV}} $ ,$ \sigma=0.4{\text{ MeV}} $ ; (k)–(n)$ E_k= $ $ 10\;{\rm{ MeV}} $ ,$ \sigma=0.4{\text{ MeV}} $ respectively. (e), (j) and (o) are the initial density distribution of the sample. The red dotted line indicates the corresponding relationship between the RCF image and the object density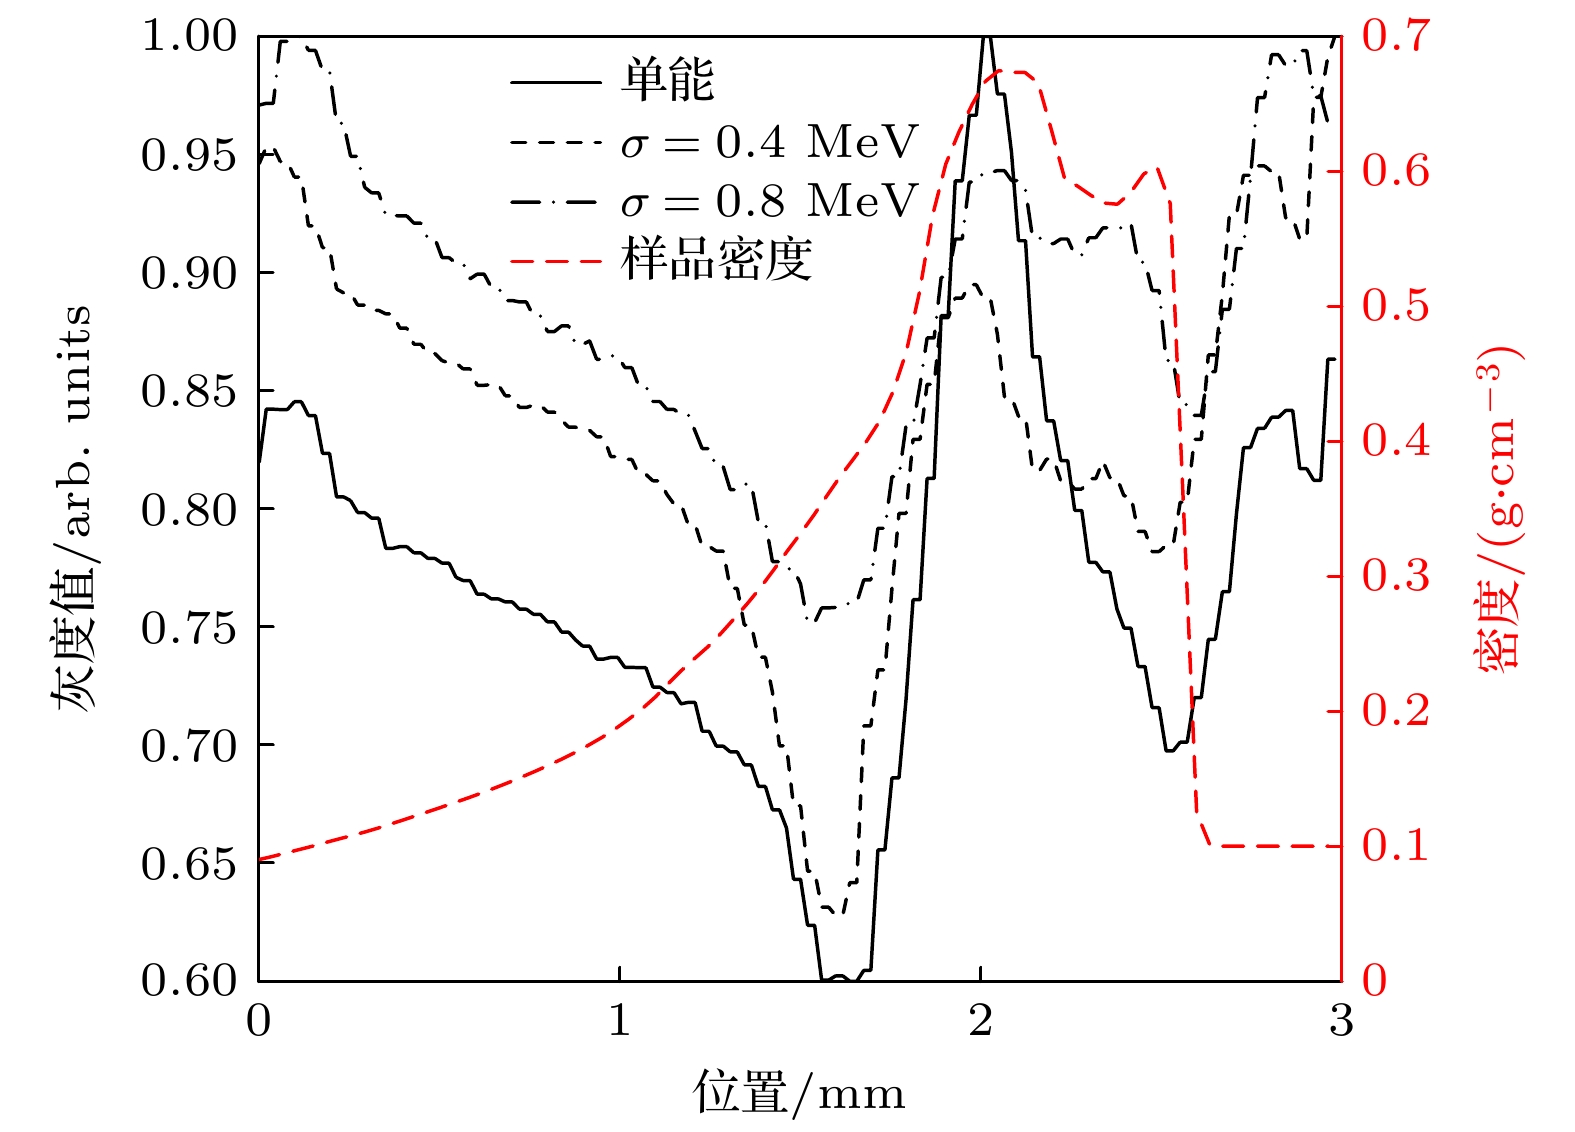
图 7 图6中不同能散条件下第4片RCF上灰度值曲线及客体初始密度分布. 黑色实线为单能质子算例, 黑色点线为
$\sigma=0.4{\text{ MeV}}$ 算例, 黑色虚线为$\sigma=0.8{\text{ MeV}}$ 算例, 红色虚线为客体初始密度分布Figure 7. Gray value on the fourth RCF in Fig. 6 with different energy spread and the initial density profile of the sample. The solid black line for the monoenergetic case, the black dotted line for the case with
$\sigma=0.4{\text{ MeV}}$ , the black dashed line for the case with$\sigma=0.8{\text{ MeV}}$ and the red dashed line for the initial density profile of the sample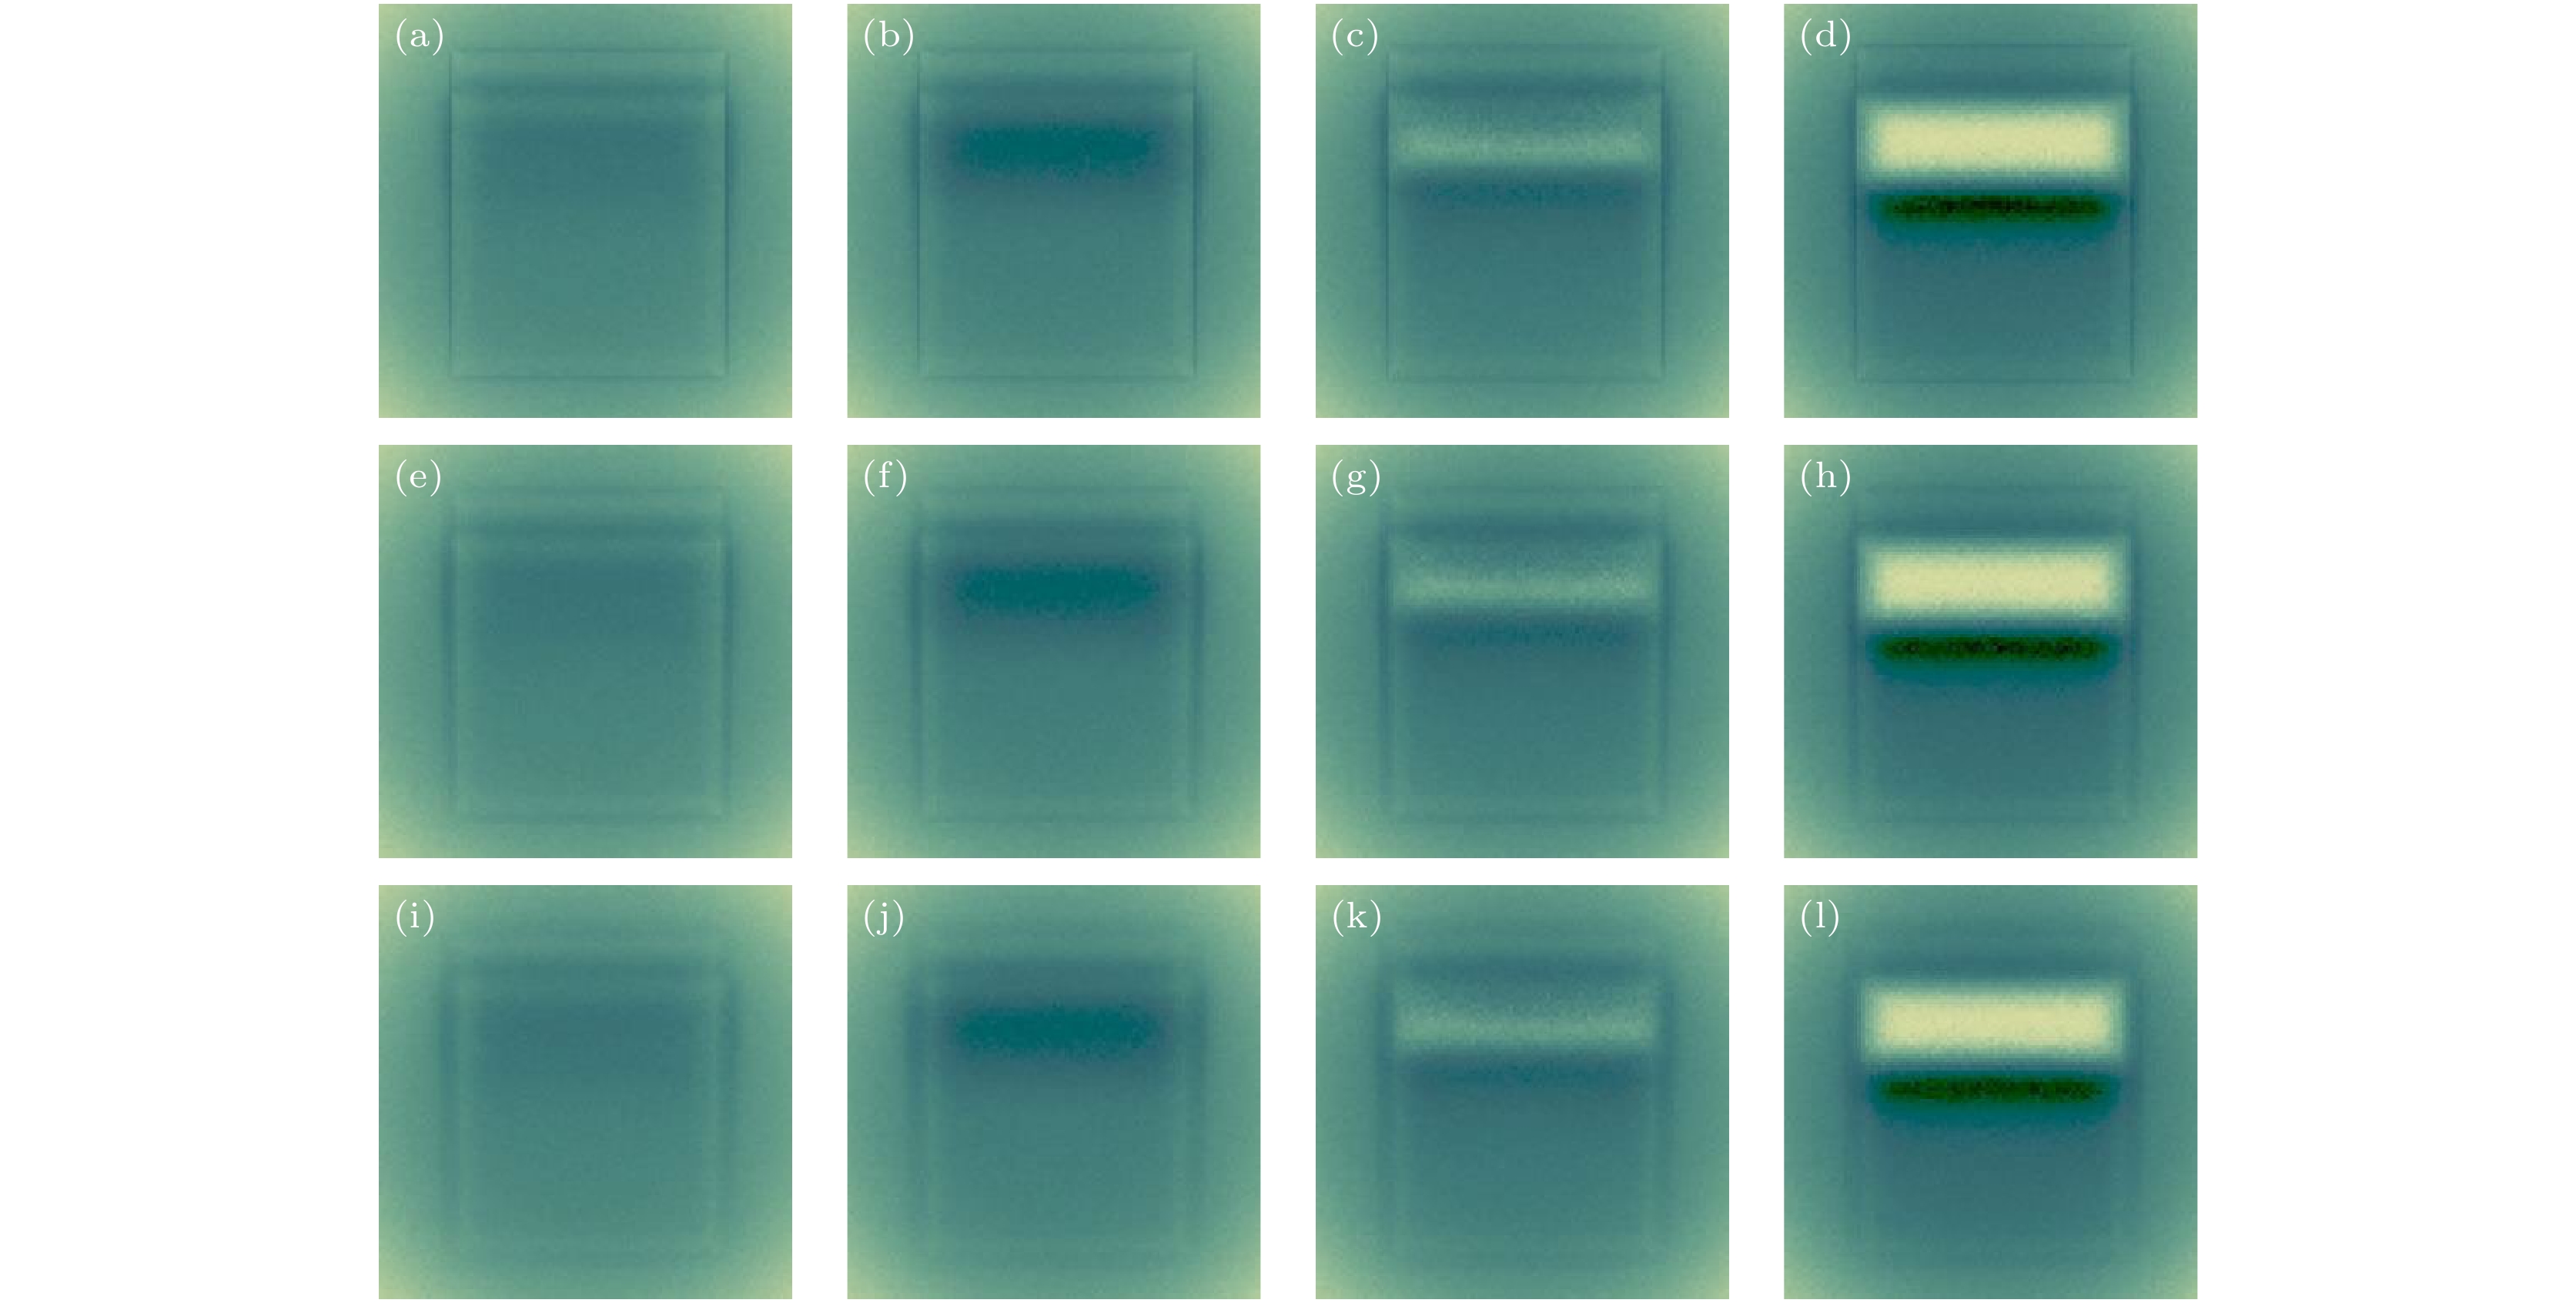
图 8 不同源尺寸下模拟得到的RCF上的质子图像 (a)—(d) 点源照相获得第2—5片RCF上的质子图像; (e)—(h)
$l_{{\rm{source}}}= $ $ 40{\text{ μm}}$ 时, 第2—5片RCF上的质子图像; (i)—(l):$l_{{\rm{source}}}=80{\text{ μm}}$ 时, 第2—5片RCF上的质子图像Figure 8. The simulated proton images on the RCF pieces with different source sizes: (a)–(d) Proton images on the 2–5 RCF pieces with a point source; (e)–(h) proton images on the 2–5 RCF pieces using a point
$40{\text{ μm}}$ source; (i)–(l) proton images on the 2–5 RCF pieces using a point$80{\text{ μm}}$ source -
[1] Ma T, Hurricane O A, Callahan D A, et al. 2015 Phys. Rev. Lett. 114 145004
Google Scholar
[2] Lindl J, Landen O, Edwards J, Moses E, Team N 2014 Phys. Plasmas 21 020501
Google Scholar
[3] Benuzzi-Mounaix A, Loupias B, Koenig M, Ravasio A, Ozaki N, Rabec le Gloahec M, Vinci T, Aglitskiy Y, Faenov A, Pikuz T, Boehly T 2008 Phys. Rev. E 77 045402
[4] Ravasio A, Koenig M, Le Pape S, et al. 2008 Phys. Plasmas 15 060701
Google Scholar
[5] Ravasio A, Romagnani L, Pape S L, et al,. 2010 Phys. Rev. E 82 016407
Google Scholar
[6] Mackinnon A J, Patel P K, Borghesi M, et al. 2006 Phys. Rev. Lett. 97 045001
Google Scholar
[7] Borghesi M, Mackinnon A J, Campbell D H, Hicks D G, Kar S, Patel P K, Price D, Romagnani L, Schiavi A, Willi O 2004 Phys. Rev. Lett. 92 055003
Google Scholar
[8] Teng J, Zhao Z Q, Zhu B, Hong W, Cao L F, Zhou W M, Shan L Q, Gu Y Q 2011 Chin. Phys. Lett. 28 035203
Google Scholar
[9] Aydelotte B, Golt M, Schuster B, Allison J, Cherne F, Freeman M, Hollander B, Jensen B, Lopez J, Mariam F, et al. 2019 Dynamic Behavior of Materials (Vol. 1) (Berlin: Springer) pp127–131
[10] Cherne F J, Jensen B J, Tang Z, Freeman M S 2020 AIP Conference Proceedings 2272 120004
Google Scholar
[11] Le Pape S, Koenig M, Vinci T, Martinolli E, Bennuzzi-Mounaix A, Hicks D, Patel P, Mackinnon A, Romagnani L, Borghesi M, Kar S, Boehly T 2006 High Energy Density Physics 2 1
Google Scholar
[12] Hua R, Sio H, Wilks S C, Beg F N, McGuffey C, Bailly-Grandvaux M, COllins G W, Ping Y 2017 Appl. Phys. Lett. 111 034102
Google Scholar
[13] Ostermayr T M, Kreuzer C, Englbrench S, et al. 2020 Nat. Commun. 11 6174
Google Scholar
[14] Teng J, Hong W, He S K, et al. 2017 High Power Laser And Part. Beams 29 092001
[15] Bloch F 1933 Ann. Phys. 408 285
Google Scholar
[16] Meinecke J, Tzeferacos P, Bell A, Gregori G 2015 PNAS 112 8211
Google Scholar
[17] Rigby A, Cruz F, Albertazzi B, et al. 2018 Nat. Phys. 14 475
Google Scholar
[18] Meinecke J, Doyle H, Miniati F, et al. 2014 Nat. Phys. 10 520
Google Scholar
[19] Ren J R, Deng Z G, Qi W, et al. 2020 Nat. Commun. 11 5157
Google Scholar

 DownLoad:


Catalog
Metrics
- Abstract views: 3337
- PDF Downloads: 78
- Cited By: 0
