


-
Active matter refers to a class of substance capable of autonomously moving by harnessing energy from its surrounding environment. The substance exhibits unique non-equilibrium phenomenon, and hence has attracted great attention in the scientific community. Many active matters, such as bacteria, cells, micro-swimmers, and self-propelled colloidal particles, operate in viscous environments and their motions are described usually by using overdamped models. Examples include overdamped active Brownian particle (ABP) model for self-propelled colloidal particles in solution and run-and-tumble (RTP) model for swimming bacteria. In recent years, increasing studies focus on the influence of inertia on the behavior of active matter. Vibrating robots, runners, flying insects, and micro-fliers are typical of active systems under the underdamped condition. The motions of these active matters can be modelled by underdamped Langevin equation, known as the active inertial particle (AIP) model. Previous studies have demonstrated that like the scenarios in ABP systems, motility-induced phase separation (MIPS) phenomena also happen in AIP systems under certain density conditions. However, due to the strong collision-and-rebound effect, aggregation of AIP particles and hence the MIPS are impeded. In complex living/application environments, mixture of different active agents is often seen. Some studies on mixed systems of active matter show that the composition is an important quantity, which influences the phase separation phenomena. In this paper, we study the phase separation phenomena in a mixed system composed of low- and high-inertia active particles by underdamped Langevin dynamics simulations. We find that compared with single-component system, the mixed system is unexpectedly favorable for the occurrence of phase separation at a moderate overall concentration and a certain range of component fraction, while unfavorable for phase separation at a high overall concentration. The underlying mechanism is that the presence of a small number of the high-inertia particles could accelerate the motion of the low-inertia particles, thus facilitating their aggregation and promoting the phase separation. However, when the fraction of the high-inertia particles is large, frequent elastic collisions would disturb the aggregation of the low-inertia particles and suppress the occurrence of phase separation. Our results provide a new insight into the collective behavior of active materials and also a reference for their design and applications.
-
Keywords:
- active matter /
- phase separation /
- inertia
[1] Dauchot O, Löwen H 2019 J. Chem. Phys. 151 114901
 Google Scholar
[2] Ramaswamy S 2010 Annu. Rev. Condens. Matter Phys. 1 323
Google Scholar
[3] Ouellette N T 2019 Matter 1 297
Google Scholar
[4] Wensink H H, Löwen H 2008 Phys. Rev. E 78 20
Google Scholar
[5] Tailleur J, Cates M E 2008 Phys. Rev. Lett. 100 218103
Google Scholar
[6] Peruani F, Ginelli F, Bär M, Chaté H 2011 J. Phys. Conf. Ser. 297 12014
Google Scholar
[7] Toner J, Tu Y 1995 Phys. Rev. Lett. 75 4326
Google Scholar
[8] Stenhammar J, Marenduzzo D, Allen R J, Cates M E 2014 Soft Matter 10 1489
Google Scholar
[9] Liu P, Zhu H W, Zeng Y, et al. 2020 Proc. Natl. Acad. Sci. USA 117 11901
Google Scholar
[10] Bricard A, Caussin J B, Das D, et al. 2015 Nat. Commun. 6 7470
Google Scholar
[11] Volpe G, Buttinoni I, Vogt D, Kümmerer H J, Bechinger C 2011 Soft Matter 7 8810
Google Scholar
[12] Romanczuk P, Bär M, Ebeling W, Lindner B, Schimansky-Geier L 2012 Eur. Phys. J. Spec. Top. 202 1
Google Scholar
[13] Speck T 2020 Soft Matter 16 2652
Google Scholar
[14] Liao G J, Hall C K, Klapp S H L 2020 Soft Matter 16 2208
Google Scholar
[15] Scholz C, Jahanshahi S, Ldov A, Löwen H 2018 Nat. Commun. 9 5156
Google Scholar
[16] Li W J, Li L F, Shi Q F, Yang M C, Zheng N 2022 Soft Matter 18 5459
Google Scholar
[17] Dai C, Bruss I R, Glotzer S C 2020 Soft Matter 16 2847
Google Scholar
[18] Su J, Jiang H, Hou Z 2021 New J. Phys. 23 013005
Google Scholar
[19] Löwen H 2020 J. Chem. Phys. 152 040901
Google Scholar
[20] Deblais A, Barois T, Guerin T, et al. 2018 Phys. Rev. Lett. 120 188002
Google Scholar
[21] Mandal S, Liebchen B, Löwen H 2019 Phys. Rev. Lett. 123 228001
Google Scholar
[22] Pan J X, Wei H, Qi M J, Wang H F, Zhang J J, Tian W D, Chen K 2020 Soft Matter 16 5545
Google Scholar
[23] Shi S J, Li H S, Feng G Q, Tian W D, Chen K 2020 Phys. Chem. Chem. Phys. 22 14052
Google Scholar
[24] Qian B S, Tian W D, Chen K 2021 Phys. Chem. Chem. Phys. 23 20388
Google Scholar
[25] Li W J, Li L F, Shi Q F, Yang M C, Zheng N 2022 Powder Technol. 407 117671
Google Scholar
[26] Yang Q, Zhu H W, Liu P, Liu R, Shi Q F, Chen K, Zheng N, Ye F F, Yang M C 2021 Phys. Rev. Lett. 126 198001
Google Scholar
[27] Stenhammar J, Wittkowski R, Marenduzzo D, Cates M E 2015 Phys. Rev. Lett. 114 018301
Google Scholar
[28] Kolb T, Kolb T, Klotsa D 2020 Soft Matter 16 1967
Google Scholar
[29] Wang Y, Shen Z L, Xia Y Q, Feng G Q, Tian W D 2020 Chin. Phys. B 29 050103
Google Scholar
[30] Popkin G 2016 Nature 529 16
Google Scholar
[31] Needleman D, Dogic Z 2017 Nat. Rev. Mater. 2 17048
Google Scholar
[32] Shan W J, Zhang F, Tian W D, Chen K 2019 Soft Matter 15 4761
Google Scholar
[33] Fily Y, Henkes S, Marchetti C M 2014 Soft Matter 10 2132
Google Scholar
-
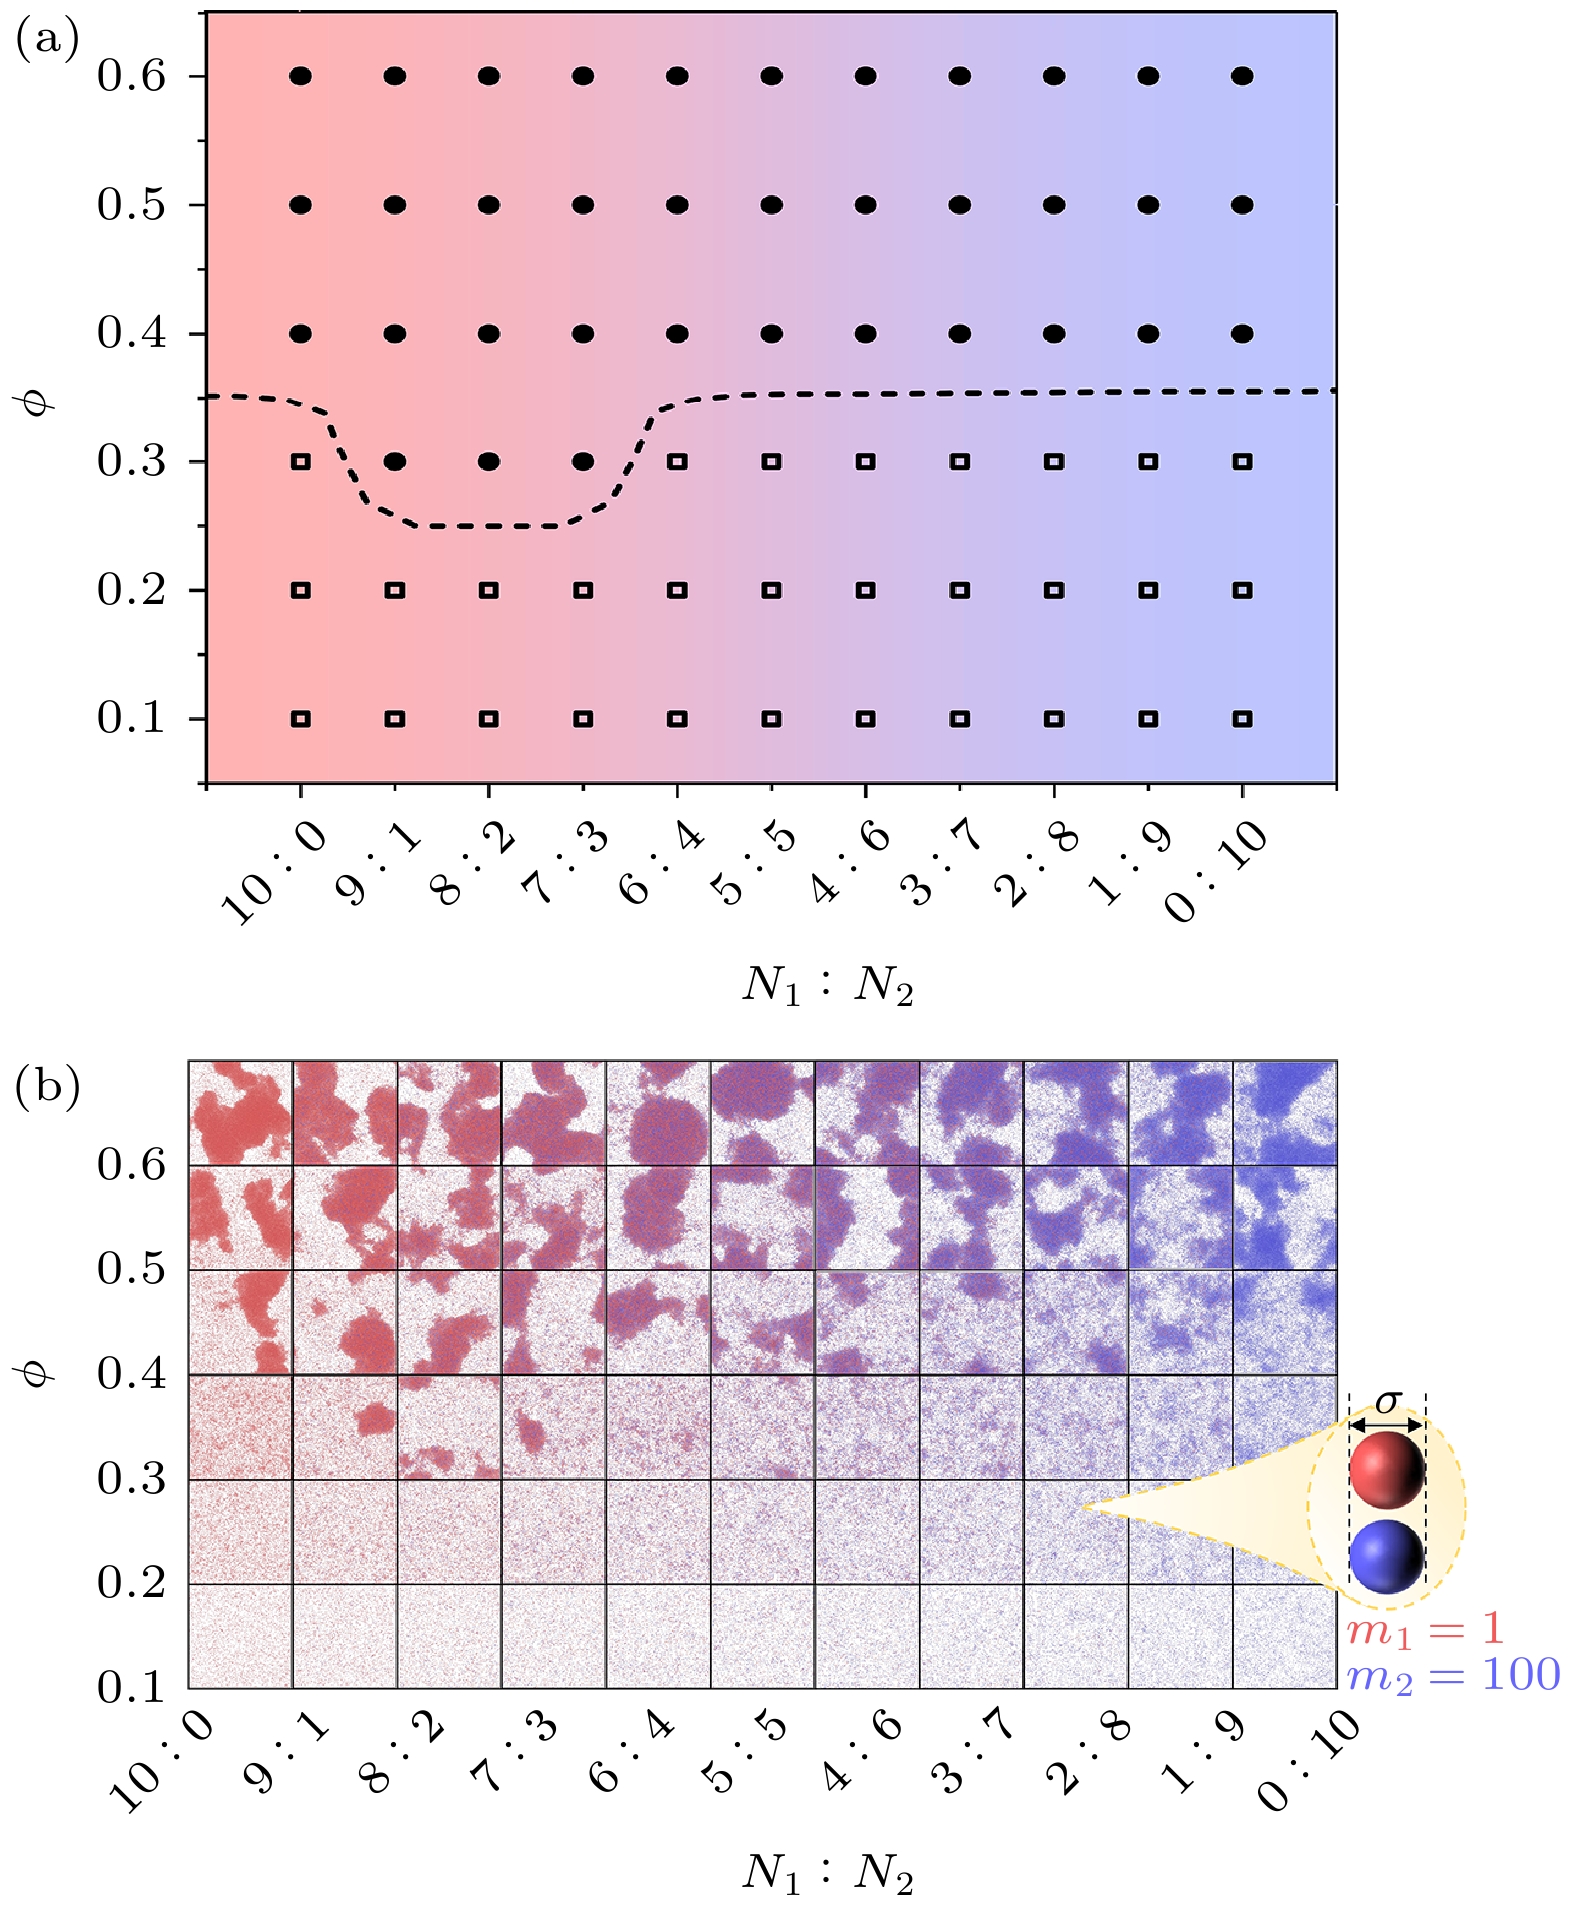
图 1 (a)模拟相图, 黑色空心正方形代表均匀无规流体相, 黑色实心圆形代表均匀无规流体与团簇的共存相, 黑色虚线表示两相的相边界, 背景颜色代表混合体系中的粒子组分比(颜色与模拟相图相对应); (b)快照相图, 粒子的颜色代表其质量(红色粒子为低惯性粒子, 蓝色粒子为高惯性粒子)
Figure 1. (a) Simulated phase diagram, the black hollow square represents the homogeneous random fluid phase, the black solid circle represents the coexisting phase of the homogeneous random fluid and the cluster, the black dashed line represents the phase boundary of the two phases, which is divided according to the local density distribution, the background color represents the particle composition ratio in the mixing system, and the color is corresponding to the simulated phase diagram; (b) phase diagram of snapshoots, the color of particles represents their mass, the red particles are low inertia particles, and the blue particles are high inertia particles.

图 2 粒子碰撞示意图. 红色球表示质量为
$ {m}_{1} $ 的低惯性粒子, 蓝色球表示质量为$ {m}_{2} $ 的高惯性粒子, 深色球表示碰撞前的粒子, 浅色球表示碰撞后的粒子, 黑色箭头表示碰撞前粒子的运动轨迹, 浅红色箭头表示碰撞后低惯性粒子的运动轨迹, 浅蓝色箭头表示碰撞后高惯性粒子的运动轨迹Figure 2. Schematic diagram of collisions between particles, the red spheres represent low inertia particles with
$ {m}_{1} $ , the blue spheres represent high inertial particles with${m_2}$ , the dark spheres represent the particles before the collision, the light spheres represent the particles after the collision, the black arrows represent the trajectory of the particles before the collision, the light red arrows represent the trajectory of the low inertia particles after the collision, the light blue arrows represent the trajectory of the highly inertial particles after the collision.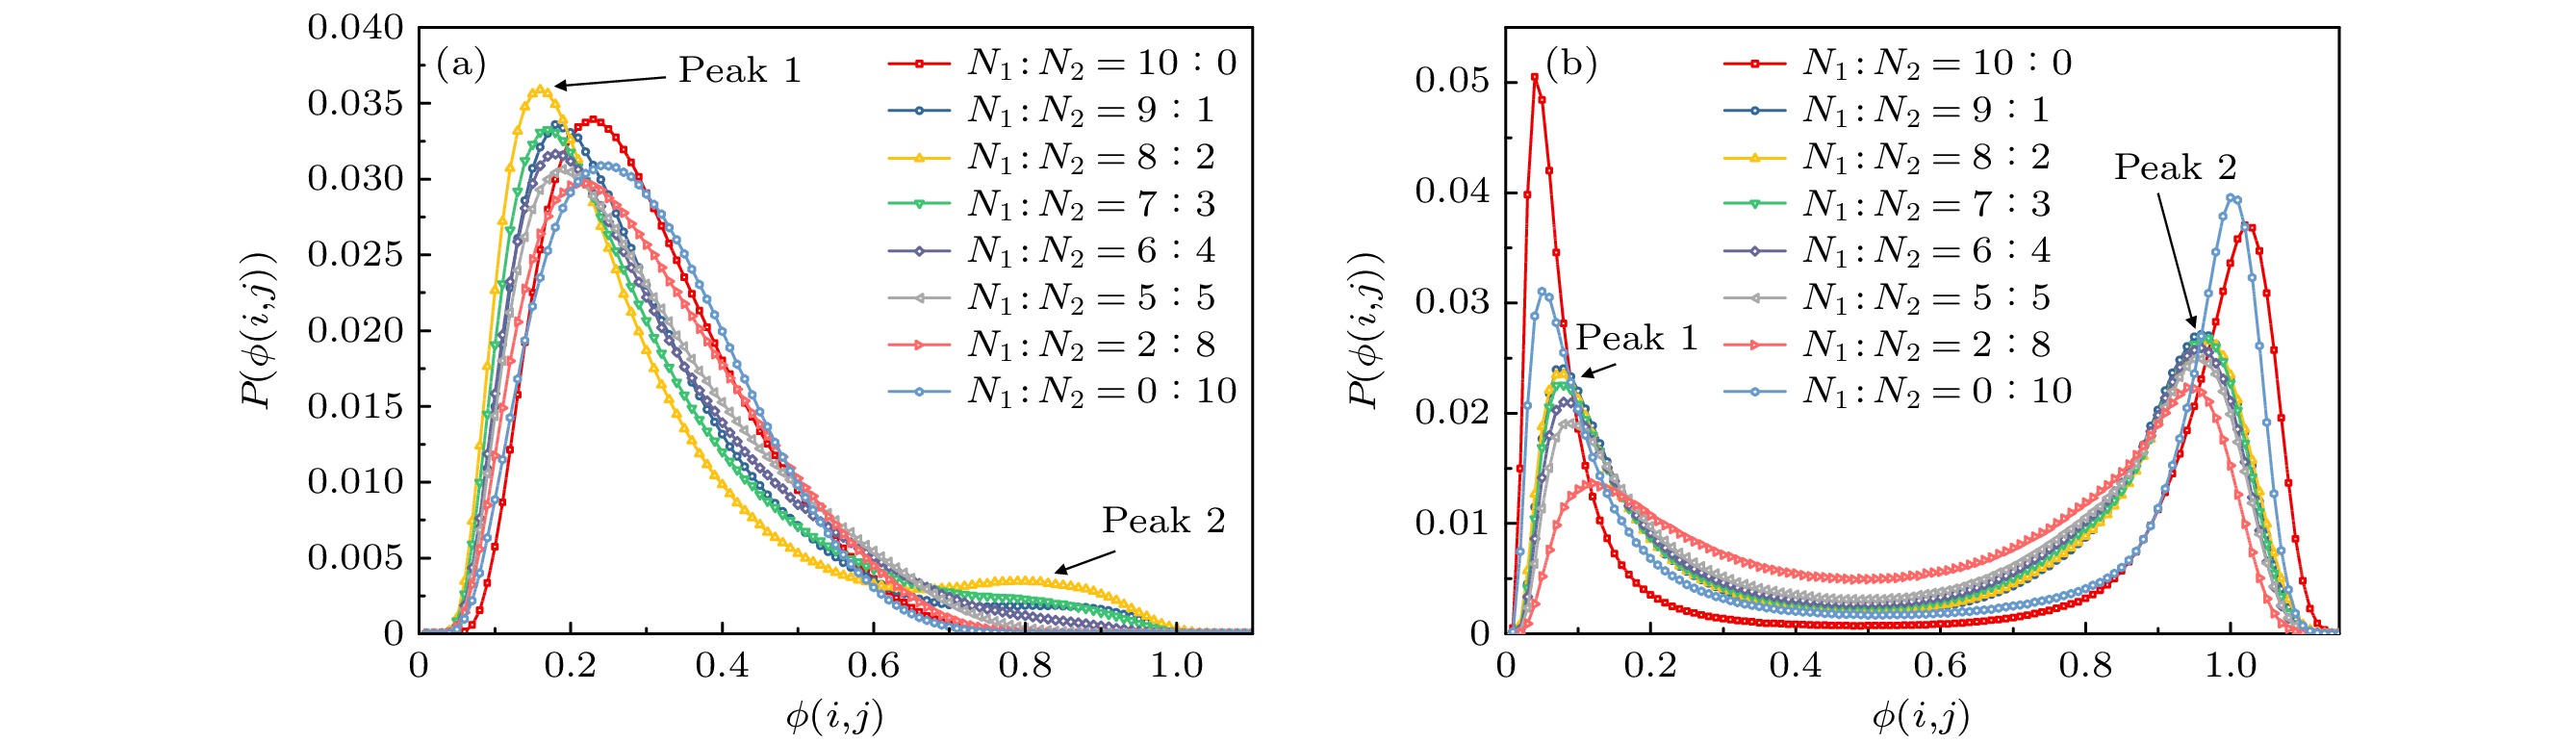
图 5 中等密度和高密度体系中的格点局部密度分布 (a) ϕ = 0.3; (b) ϕ = 0.6
Figure 5. Local density distribution of lattices in the system with medium density and high density: (a) ϕ = 0.3; (b) ϕ = 0.6.

图 4 中等密度和高密度体系中的粒子局部密度分布
$ P({\phi _n}) $ , Peak 1, Peak 2分别表示混合体系($ {N}_{1}:{N}_{2}=8:2 $ )中粒子局部密度分布$ P({\phi _n}) $ 的第1个峰和第2个峰 (a) ϕ = 0.3; (b) ϕ = 0.6Figure 4. Local density distribution
$ P({\phi }_{n}) $ of particles in the system with medium density (a) and high density (b). Peak 1 and Peak 2 represent the first and second peaks of local density distribution$ P({\phi }_{n}) $ of particles in the mixed system of$ {N}_{1}:{N}_{2}=8:2 $ , respectively: (a) ϕ = 0.3; (b) ϕ = 0.6.
图 3 (a), (b)分别为图(c)中团簇内外所选区域的沃罗诺伊图 (红色粒子为低惯性粒子, 蓝色粒子为高惯性粒子); (c)模拟快照(
${N_1}:{N_2} = 8:2$ ,$ \phi =0.6 $ ); (d)图(c)所对应的粒子沃罗诺伊单元的面积${S_n}$ ; (e) 图(c)所对应的格点局部密度$ \phi (i, j) $ , 图中颜色代表格点$ (i, j) $ 的密度Figure 3. (a), (b) Voronoi diagrams of cluster region and gas region in panel (c), respectively (Red particles are the low inertia particle, and the blue particles are the high inertia particle); (c) simulation snapshot (
${N_1}:{N_2} = 8:2$ ,$ \phi =0.6 $ ); (d) area${S_n}$ of the Voronoi unit of the particle corresponding to panel (c); (e) lattice local density$ \phi (i, j) $ corresponding to panel (c); the color in the figure represents the density of the lattice$ (i, j) $ .
图 6 中等密度和高密度体系中的近邻粒子数分布 (a) ϕ = 0.3; (b) ϕ = 0.6
Figure 6. Neighbor particle population distribution in the system with medium density and high density: (a) ϕ = 0.3; (b) ϕ = 0.6.

图 7 中等密度和高密度的体系中, 两种粒子的粒子局部密度分布
$P({\phi _n})$ 及粒子局部密度的平均值$\overline {{\phi _n}} $ . 红色表示低惯性粒子; 蓝色表示高惯性粒子; 黄色表示体系中的所有粒子 (a), (c) ϕ = 0.3; (b), (d) ϕ = 0.6Figure 7. Local density distribution
$P({\phi _n})$ and the average$\overline {{\phi _n}} $ of the local density of the particles with different inertias in the system with medium density and high density. Red represents low inertial particles; the blue represents high inertial particles; the yellow represents all particles in the system: (a), (c) ϕ = 0.3; (b), (d) ϕ = 0.6.
图 8 中等密度和高密度的体系中, 粒子的近邻粒子类型之比, 纵轴表示粒子周围出现同类(或异类)粒子的概率p. 红色实心正方形表示低惯性粒子附近出现低惯性粒子的概率, 红色空心正方形表示低惯性粒子附近出现高惯性粒子的概率; 蓝色实心圆形表示高惯性粒子附近出现低惯性粒子的概率, 蓝色空心圆形表示高惯性粒子附近出现高惯性粒子的概率; 灰色实心三角形和空心三角形分别表示体系中低惯性粒子和高惯性粒子占总粒子数的比值 (a) ϕ = 0.3; (b) ϕ = 0.6
Figure 8. Ratio of the particle’s nearest neighbor particle types in the system with medium density and high density, and the vertical axis shows the probability p of similar (or dissimilar) particles occurring around the particle. Red solid square indicates the probability of low inertial particles near the low inertial particles, and the red hollow square indicates the probability of high inertial particles near the low inertial particles. Blue solid circle indicates the probability of low inertial particles near high inertial particles, and blue hollow circle indicates the probability of high inertial particles near high inertial particles. Gray solid and hollow triangle represent the ratio of low and high inertial particles to the total number of particles in the system, respectively: (a) ϕ = 0.3; (b) ϕ = 0.6.

图 9 中等密度(a)和高密度(b)的体系中, 团簇的尺寸分布
$P(n)$ ; (c)平均畴尺寸$\Re $ Figure 9. Size distribution
$P(n)$ of clusters in the system with medium density (a) and high density (b); (c) average domain size$\Re $ .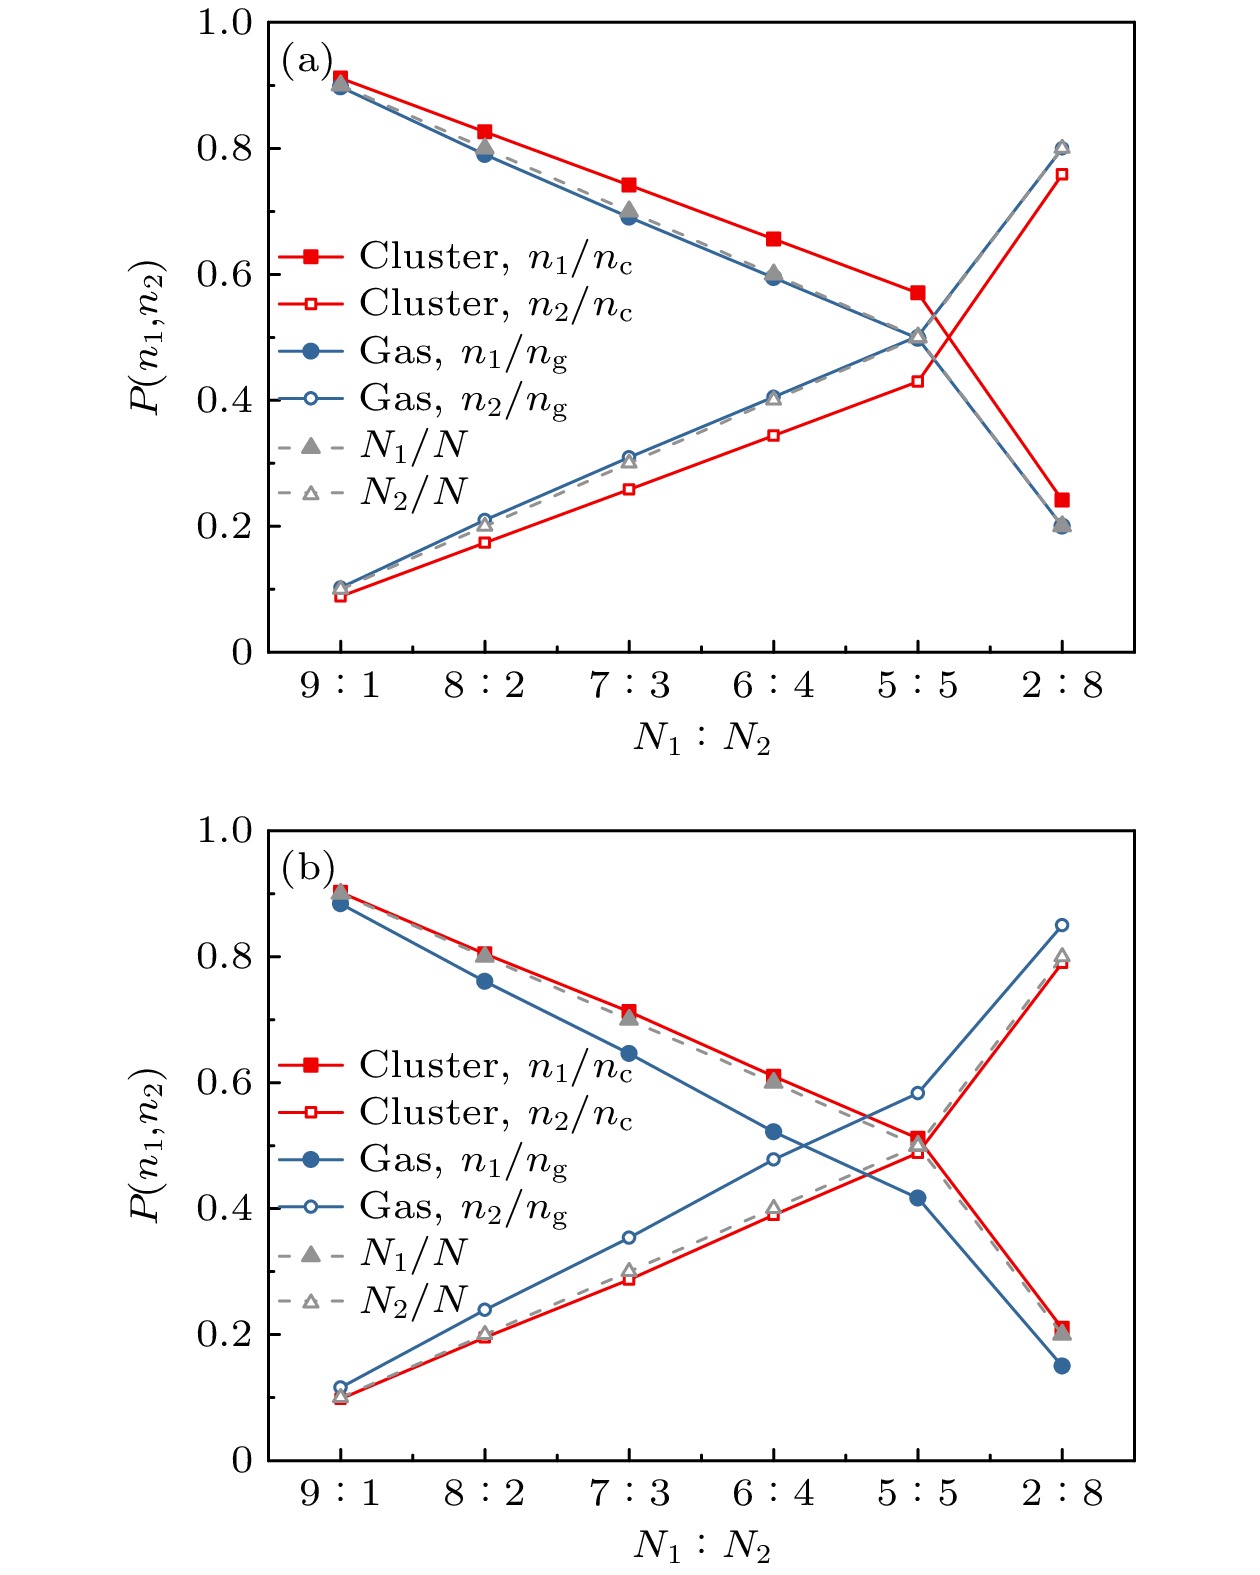
图 10 中等密度和高密度的体系中, cluster区域和gas区域中的粒子类型之比(红色代表cluster区域, 蓝色代表gas区域, 灰色代表整个混合体系) (a) ϕ = 0.3; (b) ϕ = 0.6
Figure 10. Ratio of particle types in the cluster and gas regions in the system with medium density and high density (The red represents the cluster region, blue represents the gas region, and gray represents the whole mixed system): (a) ϕ = 0.3; (b) ϕ = 0.6.

图 11 (a)热力学温度相图, 粒子颜色代表其热力学温度
${T_{{\text{eff}}}}$ ; (b), (c) cluster区域和gas区域中粒子的平均热力学温度${\overline T _{{\text{eff}}}}$ , 低惯性粒子的热力学温度参照左侧刻度线, 高惯性粒子的热力学温度参照右侧刻度线Figure 11. (a) Thermodynamic temperature phase diagram, in which the color of particle represents its thermodynamic temperature
${T_{{\text{eff}}}}$ ; (b), (c) the mean thermodynamic temperatures${\overline T _{{\text{eff}}}}$ of the particles in the cluster and gas regions, in panels (b) and (c), the thermodynamic temperature of low inertia particles is based on the left scale line, and the thermodynamic temperature of high inertia particles is based on the right scale line. -
[1] Dauchot O, Löwen H 2019 J. Chem. Phys. 151 114901
Google Scholar
[2] Ramaswamy S 2010 Annu. Rev. Condens. Matter Phys. 1 323
Google Scholar
[3] Ouellette N T 2019 Matter 1 297
Google Scholar
[4] Wensink H H, Löwen H 2008 Phys. Rev. E 78 20
Google Scholar
[5] Tailleur J, Cates M E 2008 Phys. Rev. Lett. 100 218103
Google Scholar
[6] Peruani F, Ginelli F, Bär M, Chaté H 2011 J. Phys. Conf. Ser. 297 12014
Google Scholar
[7] Toner J, Tu Y 1995 Phys. Rev. Lett. 75 4326
Google Scholar
[8] Stenhammar J, Marenduzzo D, Allen R J, Cates M E 2014 Soft Matter 10 1489
Google Scholar
[9] Liu P, Zhu H W, Zeng Y, et al. 2020 Proc. Natl. Acad. Sci. USA 117 11901
Google Scholar
[10] Bricard A, Caussin J B, Das D, et al. 2015 Nat. Commun. 6 7470
Google Scholar
[11] Volpe G, Buttinoni I, Vogt D, Kümmerer H J, Bechinger C 2011 Soft Matter 7 8810
Google Scholar
[12] Romanczuk P, Bär M, Ebeling W, Lindner B, Schimansky-Geier L 2012 Eur. Phys. J. Spec. Top. 202 1
Google Scholar
[13] Speck T 2020 Soft Matter 16 2652
Google Scholar
[14] Liao G J, Hall C K, Klapp S H L 2020 Soft Matter 16 2208
Google Scholar
[15] Scholz C, Jahanshahi S, Ldov A, Löwen H 2018 Nat. Commun. 9 5156
Google Scholar
[16] Li W J, Li L F, Shi Q F, Yang M C, Zheng N 2022 Soft Matter 18 5459
Google Scholar
[17] Dai C, Bruss I R, Glotzer S C 2020 Soft Matter 16 2847
Google Scholar
[18] Su J, Jiang H, Hou Z 2021 New J. Phys. 23 013005
Google Scholar
[19] Löwen H 2020 J. Chem. Phys. 152 040901
Google Scholar
[20] Deblais A, Barois T, Guerin T, et al. 2018 Phys. Rev. Lett. 120 188002
Google Scholar
[21] Mandal S, Liebchen B, Löwen H 2019 Phys. Rev. Lett. 123 228001
Google Scholar
[22] Pan J X, Wei H, Qi M J, Wang H F, Zhang J J, Tian W D, Chen K 2020 Soft Matter 16 5545
Google Scholar
[23] Shi S J, Li H S, Feng G Q, Tian W D, Chen K 2020 Phys. Chem. Chem. Phys. 22 14052
Google Scholar
[24] Qian B S, Tian W D, Chen K 2021 Phys. Chem. Chem. Phys. 23 20388
Google Scholar
[25] Li W J, Li L F, Shi Q F, Yang M C, Zheng N 2022 Powder Technol. 407 117671
Google Scholar
[26] Yang Q, Zhu H W, Liu P, Liu R, Shi Q F, Chen K, Zheng N, Ye F F, Yang M C 2021 Phys. Rev. Lett. 126 198001
Google Scholar
[27] Stenhammar J, Wittkowski R, Marenduzzo D, Cates M E 2015 Phys. Rev. Lett. 114 018301
Google Scholar
[28] Kolb T, Kolb T, Klotsa D 2020 Soft Matter 16 1967
Google Scholar
[29] Wang Y, Shen Z L, Xia Y Q, Feng G Q, Tian W D 2020 Chin. Phys. B 29 050103
Google Scholar
[30] Popkin G 2016 Nature 529 16
Google Scholar
[31] Needleman D, Dogic Z 2017 Nat. Rev. Mater. 2 17048
Google Scholar
[32] Shan W J, Zhang F, Tian W D, Chen K 2019 Soft Matter 15 4761
Google Scholar
[33] Fily Y, Henkes S, Marchetti C M 2014 Soft Matter 10 2132
Google Scholar
-
 补充材料1.pdf

 补充材料2.mov
补充材料3.mov
补充材料4.mov
补充材料5.mov
补充材料6.mov


 DownLoad:


Catalog
Metrics
- Abstract views: 3087
- PDF Downloads: 209
- Cited By: 0
