


-
本文利用基于光线追踪和对流放大模型的模拟程序PHANTAM, 对神光III原型装置间接驱动相关条件下的大空间尺度受激拉曼散射进行了研究. 模拟结果表明, 在该参数条件下, 真空腔和充气腔中均会发生较强的对流受激拉曼侧向散射过程. 入射光的焦斑大小是影响对流受激拉曼侧向散射的关键因素: 在光强保持不变的条件下, 真空腔和充气腔中受激拉曼侧向散射的对流增益会随焦斑增大而增大, 而在功率保持不变的条件下, 会随焦斑增大而减小. 因此改变焦斑尺寸是调控受激拉曼侧向散射对流增益的有效途径.
-
关键词:
- 激光等离子体不稳定性 /
- 受激拉曼侧向散射 /
- 对流模 /
- 光线追踪
The large-spatial-scale stimulated Raman scattering relevant to the SG-III prototype indirect drive parameters is investigated using the code PHANTAM based on ray tracing and convective amplification. The simulations show that strong stimulated Raman side scattering processes occur in both empty and gas-filled hohlraums. The incident laser spot size is found to be the critical factor affecting stimulated Raman side scattering: in constant laser intensity conditions, the convective gain of stimulated Raman side scattering increases with the laser spot size in both types of hohlraums. In our simulations, the wavenumber mismatch leads to a saturation of the convection gain of the stimulated Raman side scattering in empty hohlraum, while in gas-filled hohlraum the convection gain of the stimulated Raman side scattering keeps increasing as the spot size increases. In constant laser power conditions, the convective gain of stimulated Raman side scattering decreases while laser spot size increases, and the convective gain of stimulated Raman side scattering decreases faster in empty hohlraum in our simulations. The convective gain of Raman side scattering can be adjusted by laser spot size.
-
Keywords:
- Laser plasma instability /
- stimulated Raman side scattering /
- convective mode /
- ray tracing
-
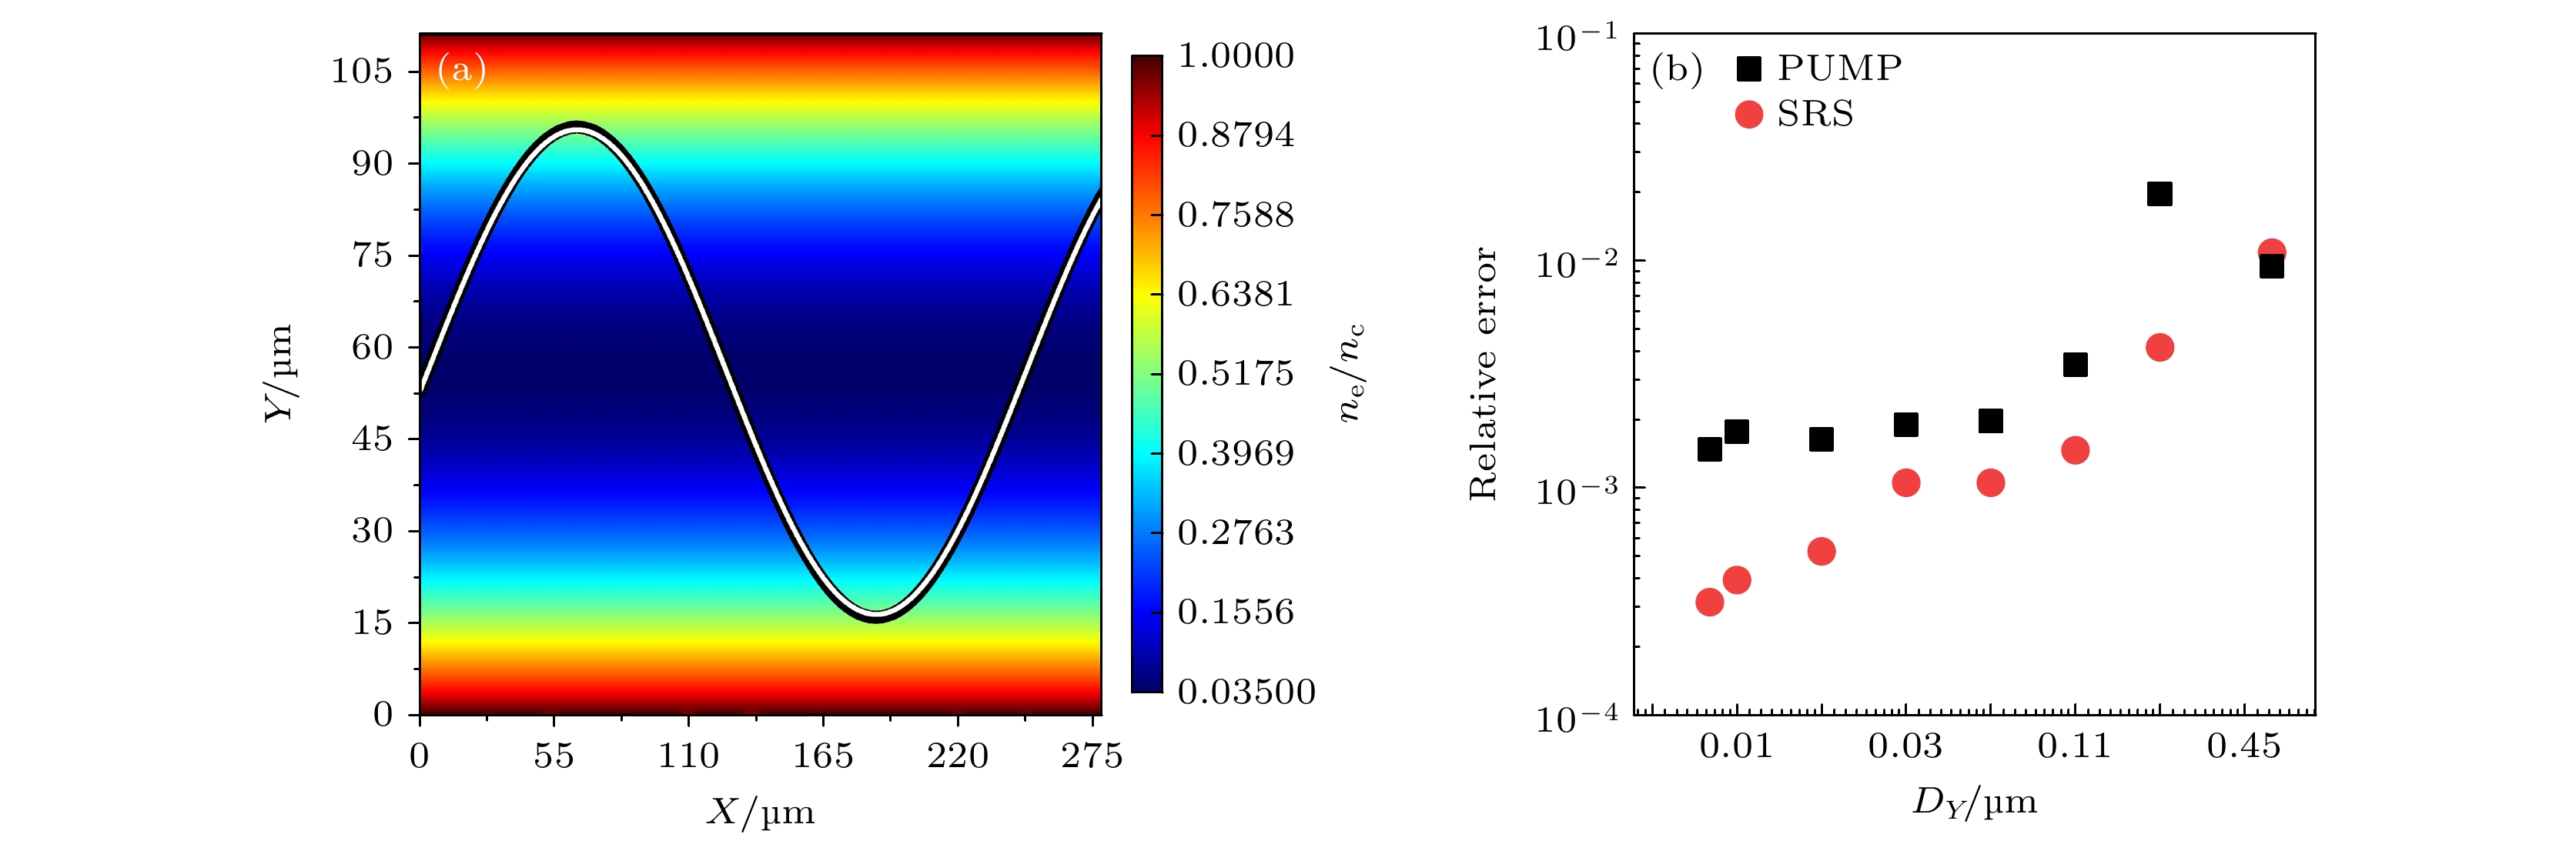
图 1 光线追踪模块校验结果 (a)入射光轨迹在等离子体中传播的轨迹图, 背景为等离子体的电子密度分布, 白线和黑线分别代表DX = DY = 0.05 μm时, 入射光轨迹的模拟结果和理论结果; (b)模拟结果和理论结果在一个周期内的相对误差随DY的变化. DX和DY分别代表X方向和Y方向的网格精度, 定义为DX = $ {\rm{X}}_{max} $/${\rm{N}} _{X} $, DY = ${\rm{Y}} _{max} $/${\rm{N}} _{Y} $, $ {\rm{X}}_{max} $, ${\rm{Y}} _{max} $分别为X方向和Y方向的长度, ${\rm{N}} _{X} $和${\rm{N}} _{Y} $则分别代表X方向和Y方向的网格数
Fig. 1. Benchmark results of the ray tracing module. (a) The pump ray trajectory of simulation(white line) and theory(black line) superimposed on the electron density with DX = DY = 0.05 μm; (b) relative error between the theory and simulation results over a period vs DY. The grid size DX and DY are defined as DX = $ {\rm{X}}_{max} $/${\rm{N}} _{X} $ and DY = ${\rm{Y}} _{max} $/${\rm{N}} _{Y} $, the $ {\rm{X}}_{max} $ and ${\rm{Y}} _{max} $ are the lengths of the X and Y directions, the ${\rm{N}} _{X} $ and ${\rm{N}} _{Y} $ are the number of grids in the X and Y directions, respectively.

图 2 均匀等离子体中SRBS的增益因子($ G_{B} $)随电子温度或电子密度的变化 (a)$ G_{B} $随电子温度的变化, 此时固定电子密度为$ n_{e0} $ = 0.05 $ n_{c} $; (b)$ G_{B} $随电子密度的变化, 此时固定电子温度为$ T_{e} $ = 3.0 keV. 红色实线、黑色实点分别代表增益因子的理论值、增益因子的模拟值.
Fig. 2. SRBS Gain($ G_{B} $) vs electron temperature or electron density for the uniform plasma. (a) $ G_{B} $ vs electron temperature for the const density $ n_{e0} $ = 0.05 $ n_{c} $; (b) $ G_{B} $ vs electron density for the const temperature $ T_{e} $ = 3.0 keV. The red line and black dots are the results of theory and simulation, respectively.

图 3 SRSS的增益因子($ G_{S} $)随λ的变化. 其中$ \lambda = 2\pi c/ \omega_{s} $为真空中SRSS的波长, 红色实线、黑色实点分别代表增益因子的理论值、增益因子的模拟值
Fig. 3. SRSS Gain($ G_{S} $) vs λ. $ \lambda = 2\pi c/ \omega_{s} $ is SRSS wavelength in the vacuum, the red line and black dots are the results of theory and simulation, respectively.
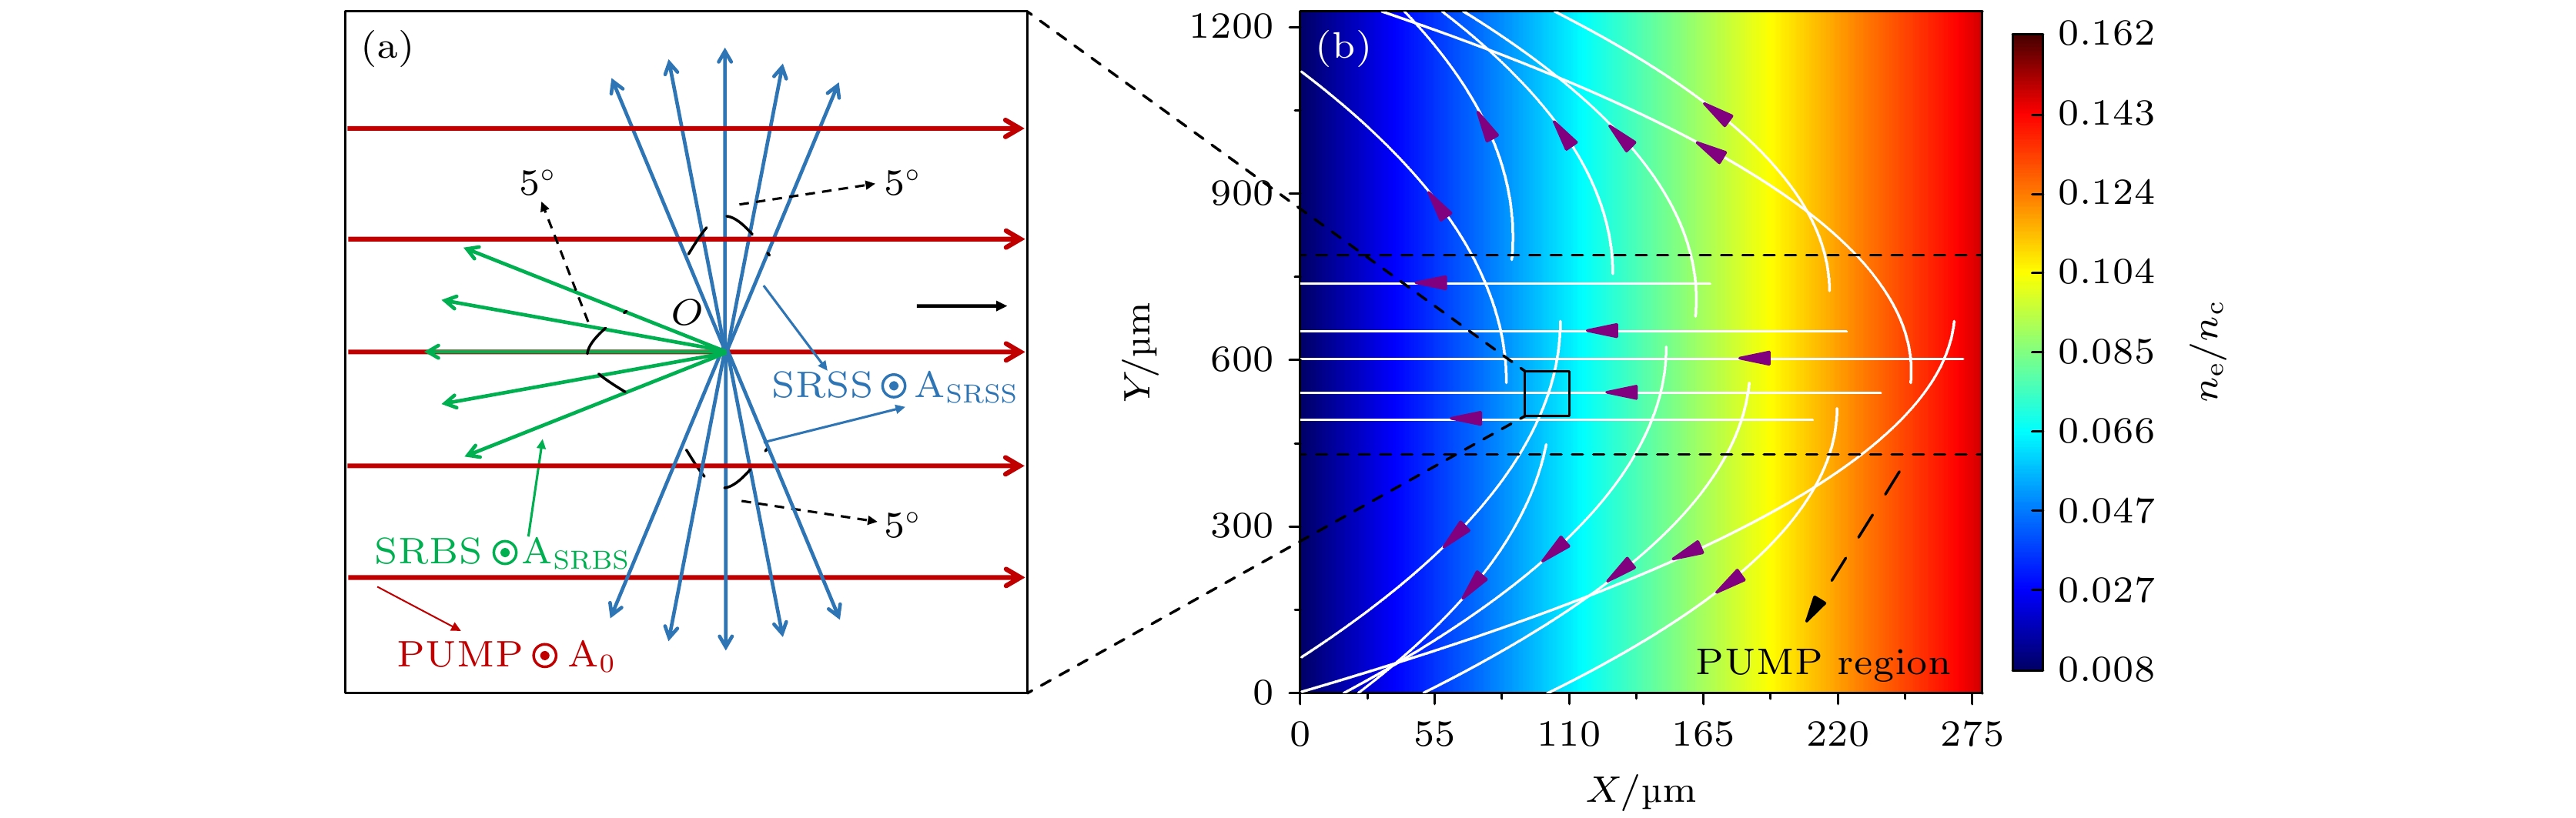
图 4 SRS散射光设置示意图 (a)散射光初始传播方向示意图, 红色箭头代表入射光的传播方向, 蓝色、绿色箭头代表SRSS和SRBS的初始传播方向, 红色、蓝色、绿色的圆圈则代表入射光、SRSS、SRBS散的偏振方向; (b)散射光传播轨迹示意图, 背景为等离子体的电子密度分布, 白色实线代表散射光的传播轨迹, 紫色的箭头代表散射光传播的方向, 黑色虚线代表入射光经过的区域
Fig. 4. Schematic of SRS configuration. (a) Schematic of the initial propagation direction of SRS, the red arrow represents the propagation direction of the incident light, the blue and green arrows represent the initial propagation direction of SRSS and SRBS, and the red, blue and green circles represent the polarisation direction of the incident light, SRSS and SRBS; (b) schematic of the SRS ray trajectory, superimposed on a plot of the electron density, the white line and violet arrow are the trajectory and direction of SRS ray, the black dashed line represents the region incident light passes.

图 5 SRSS阈值随入射角度的变化. 蓝色线条、红色实点分别代表本文所用公式、Short所用公式计算出的阈值随入射光入射角度的变化
Fig. 5. SRSS threshold vs incidence angle. The blue line and the red dots are the results of this article and Short, respectively.

图 6 真空腔模拟结果 (a) SRS散射光光强的空间分布(焦斑直径取200 μm, 与Case I对应), 白色长虚线区域为SRSS光强较大的区域, 白色短点虚线区域为入射光所在区域; (b) SRS散射光光强的空间分布(焦斑直径取1200 μm, 与Case II对应); (c) SRBS频谱(D = 200 μm时与Case I对应, D = 1200 μm时与Case II对应); (d) SRSS频谱
Fig. 6. The simulation results of empty hohlraum. (a) Profile of SRS light intensity(spot diameter is taken as 200 μm, corresponds to Case I), the white dashed line is the region where the SRSS light intensity is stronger, and the white dotted line is the region where the incident light is located; (b) profile of SRS light intensity(spot diameter is taken as 1200 μm, corresponds to Case II); (c) spectrum of SRBS(D = 200 μm corresponds to Case I, and D = 1200 μm corresponds to Case II); (d) spectrum of SRSS.

图 7 0.1 $ n_{c} $处产生的SRS的相关统计量随平均路程的变化, 实线代表SRSS, 虚线代表SRBS (a)散射光对流增益与耦合系数随传播路程的变化; (b)入射光光强, 以及等离子体的密度和温度随传播路程的变化. 除$ \bar{G}_{path} $[式(19)]外, 其余各个物理量的统计方式与$ \bar{\Gamma}_{\alpha} $保持一致, 详见式(20)
Fig. 7. Statistical physical quantities vs average distance of SRS generated at 0.1 $ n_{c} $, the solid line and the dashed line are the physical quantities of SRSS and SRBS, respectively. (a) $ \bar{G}_{path} $ and coupling coefficient vs average distance; (b) incident light intensity, electron density, and electron temperature of plasma vs average distance. The statistical methods of each physical quantity are consistent with $ \bar{\Gamma}_{\alpha} $ shown in Eq. (20), except for $ \bar{G}_{path} $ defined in Eq. (19).

图 8 充气腔模拟结果 (a) SRS散射光光强的空间分布(焦斑直径取200 μm, 与Case III对应), 白色长虚线区域为SRSS光强较大的区域, 白色短点虚线区域为入射光所在区域; (b) SRS散射光光强的空间分布(焦斑直径取1200 μm, 与Case IV对应); (c) SRBS频谱(D = 200 μm时与Case III对应, D = 1200 μm时与Case IV对应); (d) SRSS频谱, 黑色虚线左侧为对流模区间, 而虚线右侧通常被认为是绝对模区间
Fig. 8. The simulation results of gas-filled hohlraum. (a) Profile of SRS light intensity(spot diameter is taken as 200 μm, corresponds to Case III), the white dashed line is the region where the SRSS or SRBS light intensity is stronger, and the white dotted line is the region where the incident light is located; (b) profile of SRS light intensity(spot diameter is taken as 1200 μm); (c) spectrum of SRBS(D = 200 μm corresponds to Case III, and D = 1200 μm corresponds to Case IV); (d) spectrum of SRSS, the left side of the black dotted line is convective mode dominant region, and the right side is usually treated as absolute mode region.

图 9 充气腔在0.05 $ n_{c} $处产生的SRSS的平均增益($ \bar{G}_{path} $), 在不同焦斑下随SRSS的平均路程的变化
Fig. 9. Average Gain($ \bar{G}_{path} $) vs average distance for SRSS generated at 0.05 $ n_{c} $ with different spot size in the gas-filled hohlraum.

图 10 光强保持不变的条件下SRSS增益随焦斑直径的变化 (a)真空腔; (b)充气腔. 红色实点、蓝色实点分别代表入射光光强$ I_{0, max} $取1.5$ \times10^{15} $ W/cm2、2.0$ \times10^{14} $ W/cm2时的模拟结果, 红色虚线、蓝色虚线则代表对数据点的拟合
Fig. 10. SRSS Gain vs spot diameter for the constant light intensity in the (a) empty hohlraum and (b) gas-filled hohlraum. The red dots and blue dots are the simulation results of $ I_{0, max} $ = 1.5$ \times10^{15} $ W/cm2 and $ I_{0, max} $ = 2.0$ \times10^{14} $ W/cm2, the red dashed line and the blue dashed line represent the fitting results of data points, respectively.
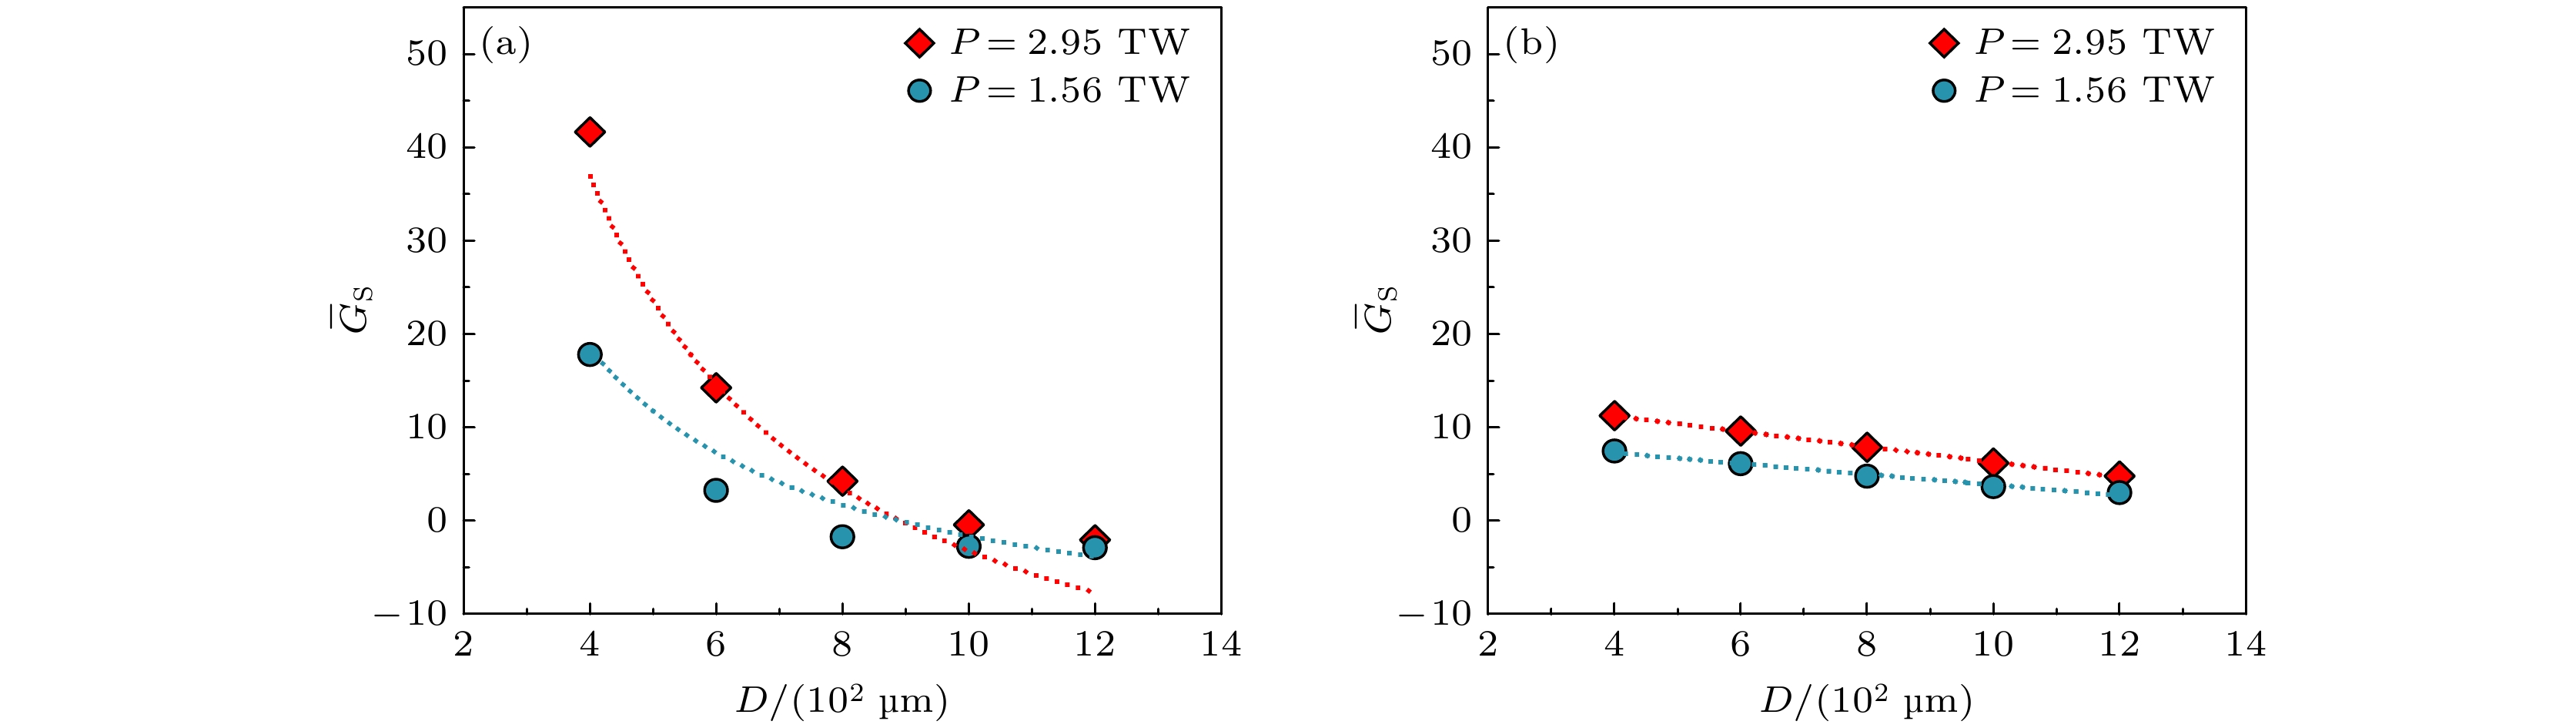
图 11 功率保持不变的条件下SRSS增益随焦斑直径的变化 (a)真空腔; (b)充气腔. 红色实点、蓝色实点分别代表入射光功率取2.95 TW、1.56 TW时的模拟结果, 红色虚线、蓝色虚线则代表对数据点的拟合
Fig. 11. SRSS Gain vs spot diameter for the constant power in the (a) empty hohlraum and (b) gas-filled hohlraum. The red dots and blue dots are the simulation results of P = 2.95 TW and P = 1.56 TW, the red dashed line and the blue dashed line represent the fitting results of data points, respectively.
表 1 部分模拟算例参数设置
Table 1. Parameters setting of several simulation cases.
Case $ I_{0, max} $/1015 W/cm2 D/μm 腔类型 I 1.5 200 真空腔 II 1.5 1200 真空腔 III 1.5 200 充气腔 IV 1.5 1200 充气腔  下载: 导出CSV
-
[1] Betti R, Hurricane O A 2016 Nat. Phys. 12 435
 Google Scholar
[2] Craxton R S, Anderson K S, Boehly T R, Goncharov V N, Harding D R, Knauer J P, McCrory R L, McKenty P W, Meyerhofer D D, Myatt J F et al 2015 Phys. Plasmas 22 110501
Google Scholar
[3] Lindl J D, Amendt P, Berger R L, Glendinning S G, Glenzer S H, Haan S W, Kauffman R L, Landen O L, Suter L J 2004 Phys. Plasmas 11 339
Google Scholar
[4] Zylstra A B, Hurricane O A, Callahan D A, Kritcher A L, Ralph J E, Robey H F, Ross J S, Young C V, Baker K L, Casey D T et al 2022 Nature 601 542
Google Scholar
[5] Abu-Shawareb H, Acree R, Adams P, Adams J, Addis B, Aden R, Adrian P, Afeyan B B, Aggleton M, Aghaian L et al 2022 Phys. Rev. Lett. 129 075001
Google Scholar
[6] Betti R 2022 Nat. Rev. Phys. 5 6
Google Scholar
[7] Tollefson J, Gibney E 2022 Nature 612 597
Google Scholar
[8] Hayes A C, Kyrala G, Gooden M, Wilhelmy J B, Kot L, Volegov P, Wilde C, Haines B, Jungman G, Rundberg R S et al 2023 Phys. Plasmas 30 072704
Google Scholar
[9] Kruer W L 1988 The physics of laser plasma interactions (New York: Addison-Wesley) pp. 73–85
[10] Strozzi D J, Bailey D S, Michel P, Divol L, Sepke S M, Kerbel G D, Thomas C A, Ralph J E, Moody J D, Schneider M B 2017 Phys. Rev. Lett. 118 025002
Google Scholar
[11] Montgomery D S 2016 Phys. Plasmas 23 055601
Google Scholar
[12] Rosenberg M J, Solodov A A, Seka W, Follett R K, Myatt J F, Maximov A V, Ren C, Cao S, Michel P, Hohenberger M et al 2020 Phys. Plasmas 27 042705
Google Scholar
[13] Yan R, Li J, Ren C 2014 Phys. Plasmas 21 062705
Google Scholar
[14] Liu C S, Rosenbluth M N, White R B 1973 Phys. Rev. Lett. 31 697
Google Scholar
[15] Afeyan B B, Williams E A 1985 Phys. Fluids 28 3397
Google Scholar
[16] Figueroa H, Joshi C, Azechi H, Ebrahim N A, Estabrook K 1984 Phys. Fluids 27 1887
Google Scholar
[17] Drake R P, Turner R E, Lasinski B F, Estabrook K G, Campbell E M, Wang C L, Phillion D W, Williams E A, Kruer W L 1984 Phys. Rev. Lett. 53 1739
Google Scholar
[18] Drake R P, Turner R E, Lasinski B F, Williams E A, Phillion D W, Estabrook K G, Kruer W L, Campbell E M, Manes K R, Hildum J S et al 1988 Phys. Fluids 31 3130
Google Scholar
[19] Renard N, Labaune C, Baldis H A, Bauer B S, Quesnel B, Schifano E, Michard A, Seka W, Estabrook K G 1996 Phys. Rev. Lett. 77 3807
[20] Michel P, Rosenberg M J, Seka W, Solodov A A, Short R W, Chapman T, Goyon C, Lemos N, Hohenberger M, Moody J D et al 2019 Phys. Rev. E 99 033203
Google Scholar
[21] Rosenberg M J, Solodov A A, Myatt J F, Hironaka S, Sivajeyan J, Follett R K, Filkins T, Maximov A V, Ren C, Cao S et al 2023 Phys. Plasmas 30 042710
Google Scholar
[22] Depierreux S, Neuville C, Baccou C, Tassin V, Casanova M, Masson-Laborde P E, Borisenko N, Orekhov A, Colaitis A, Debayle A et al 2016 Phys. Rev. Lett. 117 235002
Google Scholar
[23] Hironaka S, Sivajeyan J, Wang J, Rosenberg M J, Solodov A, Filkins T, Xiao C, Wang Q, Seka W, Myatt J F 2023 Phys. Plasmas 30 022708
Google Scholar
[24] Short R W 2020 Phys. Plasmas 27 042703
Google Scholar
[25] Michel P, Divol L, Dewald E L, Milovich J L, Hohenberger M, Jones O S, Hopkins L B, Berger R L, Kruer W L, Moody J D 2015 Phys. Rev. Lett. 115 055003
Google Scholar
[26] Dewald E L, Hartemann F, Michel P, Milovich J, Hohenberger M, Pak A, Landen O L, Divol L, Robey H F, Hurricane O A et al 2016 Phys. Rev. Lett. 116 075003
Google Scholar
[27] Moody J D, Datte P, Krauter K, Bond E, Michel P A, Glenzer S H, Divol L, Niemann C, Suter L, Meezan N et al 2010 Rev. Sci. Instrum 81 10D921
Google Scholar
[28] Hall G N, Jones O S, Strozzi D J, Moody J D, Turnbull D, Ralph J, Michel P A, Hohenberger M, Moore A S, Landen O L et al 2017 Phys. Plasmas 24 052706
Google Scholar
[29] Hao L, Zhao Y, Yang D, Liu Z, Hu X, Zheng C, Zou S, Wang F, Peng X, Li Z et al 2014 Phys. Plasmas 21 072705
Google Scholar
[30] Strozzi D J, Williams E A, Hinkel D E, Froula D H, London R A, Callahan D A 2008 Phys. Plasmas 15 102703
Google Scholar
[31] 龚韬 2015 博士学位论文 (合肥: 中国科学技术大学)
Gong T 2015 Ph. D. Dissertation (Hefei: University of Science and Technology of China
[32] Xiao C Z, Wang Q, Myatt J F 2023 Phys. Rev. E 107 025203
Google Scholar
[33] Hao L, Yang D, Li X, Li Z, Liu Y, Cai H, Liu Z, Gu P, Xu T, Li S et al 2019 AIP Adv. 9 095201
Google Scholar
[34] Colaïtis A, Igumenshchev I, Mathiaud J, Goncharov V 2021 J. Comput. Phys. 443 110537
Google Scholar
[35] Debayle A, Ruyer C, Morice O, Masson-Laborde P E, Loiseau P, Benisti D 2019 Phys. Plasmas 26 092705
Google Scholar
[36] Colaïtis A, Follett R K, Palastro J P, Igumenschev I, Goncharov V 2019 Phys. Plasmas 26 072706
Google Scholar
[37] Follett R K, Edgell D H, Froula D H, Goncharov V N, Igumenshchev I V, Shaw J G, Myatt J F 2017 Phys. Plasmas 24 103128
Google Scholar
[38] Ji Y, Lian C W, Zhou F X, Zeng J L, Yan R, Yang D, Cao S H, Ren C, Zheng J To be submitted
[39] Kaiser T B 2000 Phys. Rev. E 61 895
Google Scholar
[40] Forslund D W, Kindel J M, Lindman E L 1975 The Physics of Fluids 18 1002
Google Scholar
[41] Drake J F, Kaw P K, Lee Y C, Schmid G, Liu C S, Rosenbluth M N 1974 Phys. Fluids 17 778
Google Scholar
[42] Rosenbluth M N 1972 Phys. Rev. Lett. 29 565
Google Scholar
[43] Huo W Y, Ren G, Lan K, Li X, Wu C, Li Y, Zhai C, Qiao X, Meng X, Lai D et al 2010 Physics of Plasmas 17 123114
Google Scholar
[44] Huo W Y, Lan K, Li Y, Yang D, Li S, Li X, Wu C, Ren G, Zhao Y, Zou S et al 2012 Phys. Rev. Lett. 109 145004
Google Scholar
[45] Huo W Y, Yang D, Lan K, Li S, Li Y, Li X, Wu C, Ren G, Zhao Y, Zou S et al 2014 Physics of Plasmas 21 022704
Google Scholar
[46] Xiao C Z, Zhuo H B, Yin Y, Liu Z J, Zheng C Y, Zhao Y, He X T 2018 Plasma Phys. Control. Fusion 60 025020
Google Scholar
[47] Landau L D, Ter-Haar D 1965 Collected Papers of L.D. Landau (Oxford: Pergamon) pp. 445–460

 下载:
下载:
计量
- 文章访问数: 218
- PDF下载量: 6
- 被引次数: 0
