


-
Understanding the intrinsic correlation between helium concentration and the evolution of defects as well as mechanical properties in low-activation steel on an atomic scale is crucial for designing fusion materials with excellent resistance to swelling and embrittlement. This study investigates the effect of helium concentration on single-crystal iron through molecular dynamics simulations, thereby clarifying the mechanisms by which helium concentration affects helium defect evolution, mechanical properties, and plastic deformation behavior of low-activation steel on an atomic scale. Models of body-centered cubic (BCC) iron with different helium concentrations (0.5%—4.5%) are established. Wigner-Seitz cell analysis and cluster clustering methods are employed to track the evolution of Frenkel Pairs (FPs) and cluster defects, revealing the mechanism of helium concentration-induced FPs and cluster formation at 500 ℃. Furthermore, combined with tensile mechanical simulations, the effects of helium behavior on the mechanical properties of single-crystal iron, such as elastic modulus, yield strength, and toughness, are analyzed, and the correlation mechanisms between helium concentration-induced defect evolution, mechanical properties, and plastic deformation behavior are revealed. The results show that when NHe < 3.0%, the number of FPs linearly reaches to a peak and then stabilizes. This is because helium behavior causes a rapid increase in the number of FPs and a large number of interstitial atoms are generated, some of which recombine. The annihilation rate of FPs increases with their number increasing and eventually equals the generation rate, resulting in a stable number of FPs. When NHe ≥ 3.0%, the initial increase and stabilization are the same as those for NHe < 3.0%. However, after the formation of large interstitial clusters, they absorb interstitial atoms and grow, hindering recombination and reducing the annihilation rate of FPs, thus leading to a secondary increase. The large clusters are surrounded by vacancies and no longer hinder FP recombination, and a new balance is achieved, resulting in a secondary stabilization of the FP number. When NHe increases to 3.0%, the elastic modulus, yield strength, and toughness of single-crystal iron decrease by 21%, 88%, and 57%, respectively; beyond this concentration, the mechanical properties no longer decrease. This is because when NHe < 3.0%, as helium concentration increases, helium-induced defects increase, leading to a decrease in toughness and promoting dislocation nucleation, thus reducing the elastic modulus and yield strength. When NHe ≥ 3.0%, dislocations exist in the initial defects, and the number of clusters changes slightly; toughness no longer decreases, and dislocation nucleation is not affected, leading to the stabilization of elastic modulus and yield strength. At NHe = 3.0%, the formation of large clusters hinders the movement of slip systems, changes the orientation of slip planes, weakens the effectiveness of the main slip system, which leads to an increase in small slip bands and causes the plastic deformation mechanism to transform from cross-slip to decomposition into discrete dislocations and point defects once the slip bands intersect with each other. This study reveals the influence patterns and key mechanisms of helium concentration on defect evolution and mechanical properties of single-crystal iron, providing a theoretical basis for designing fusion iron-based materials.
-
Keywords:
- single-crystal iron /
- helium concentration /
- defect evolution /
- mechanical properties
-
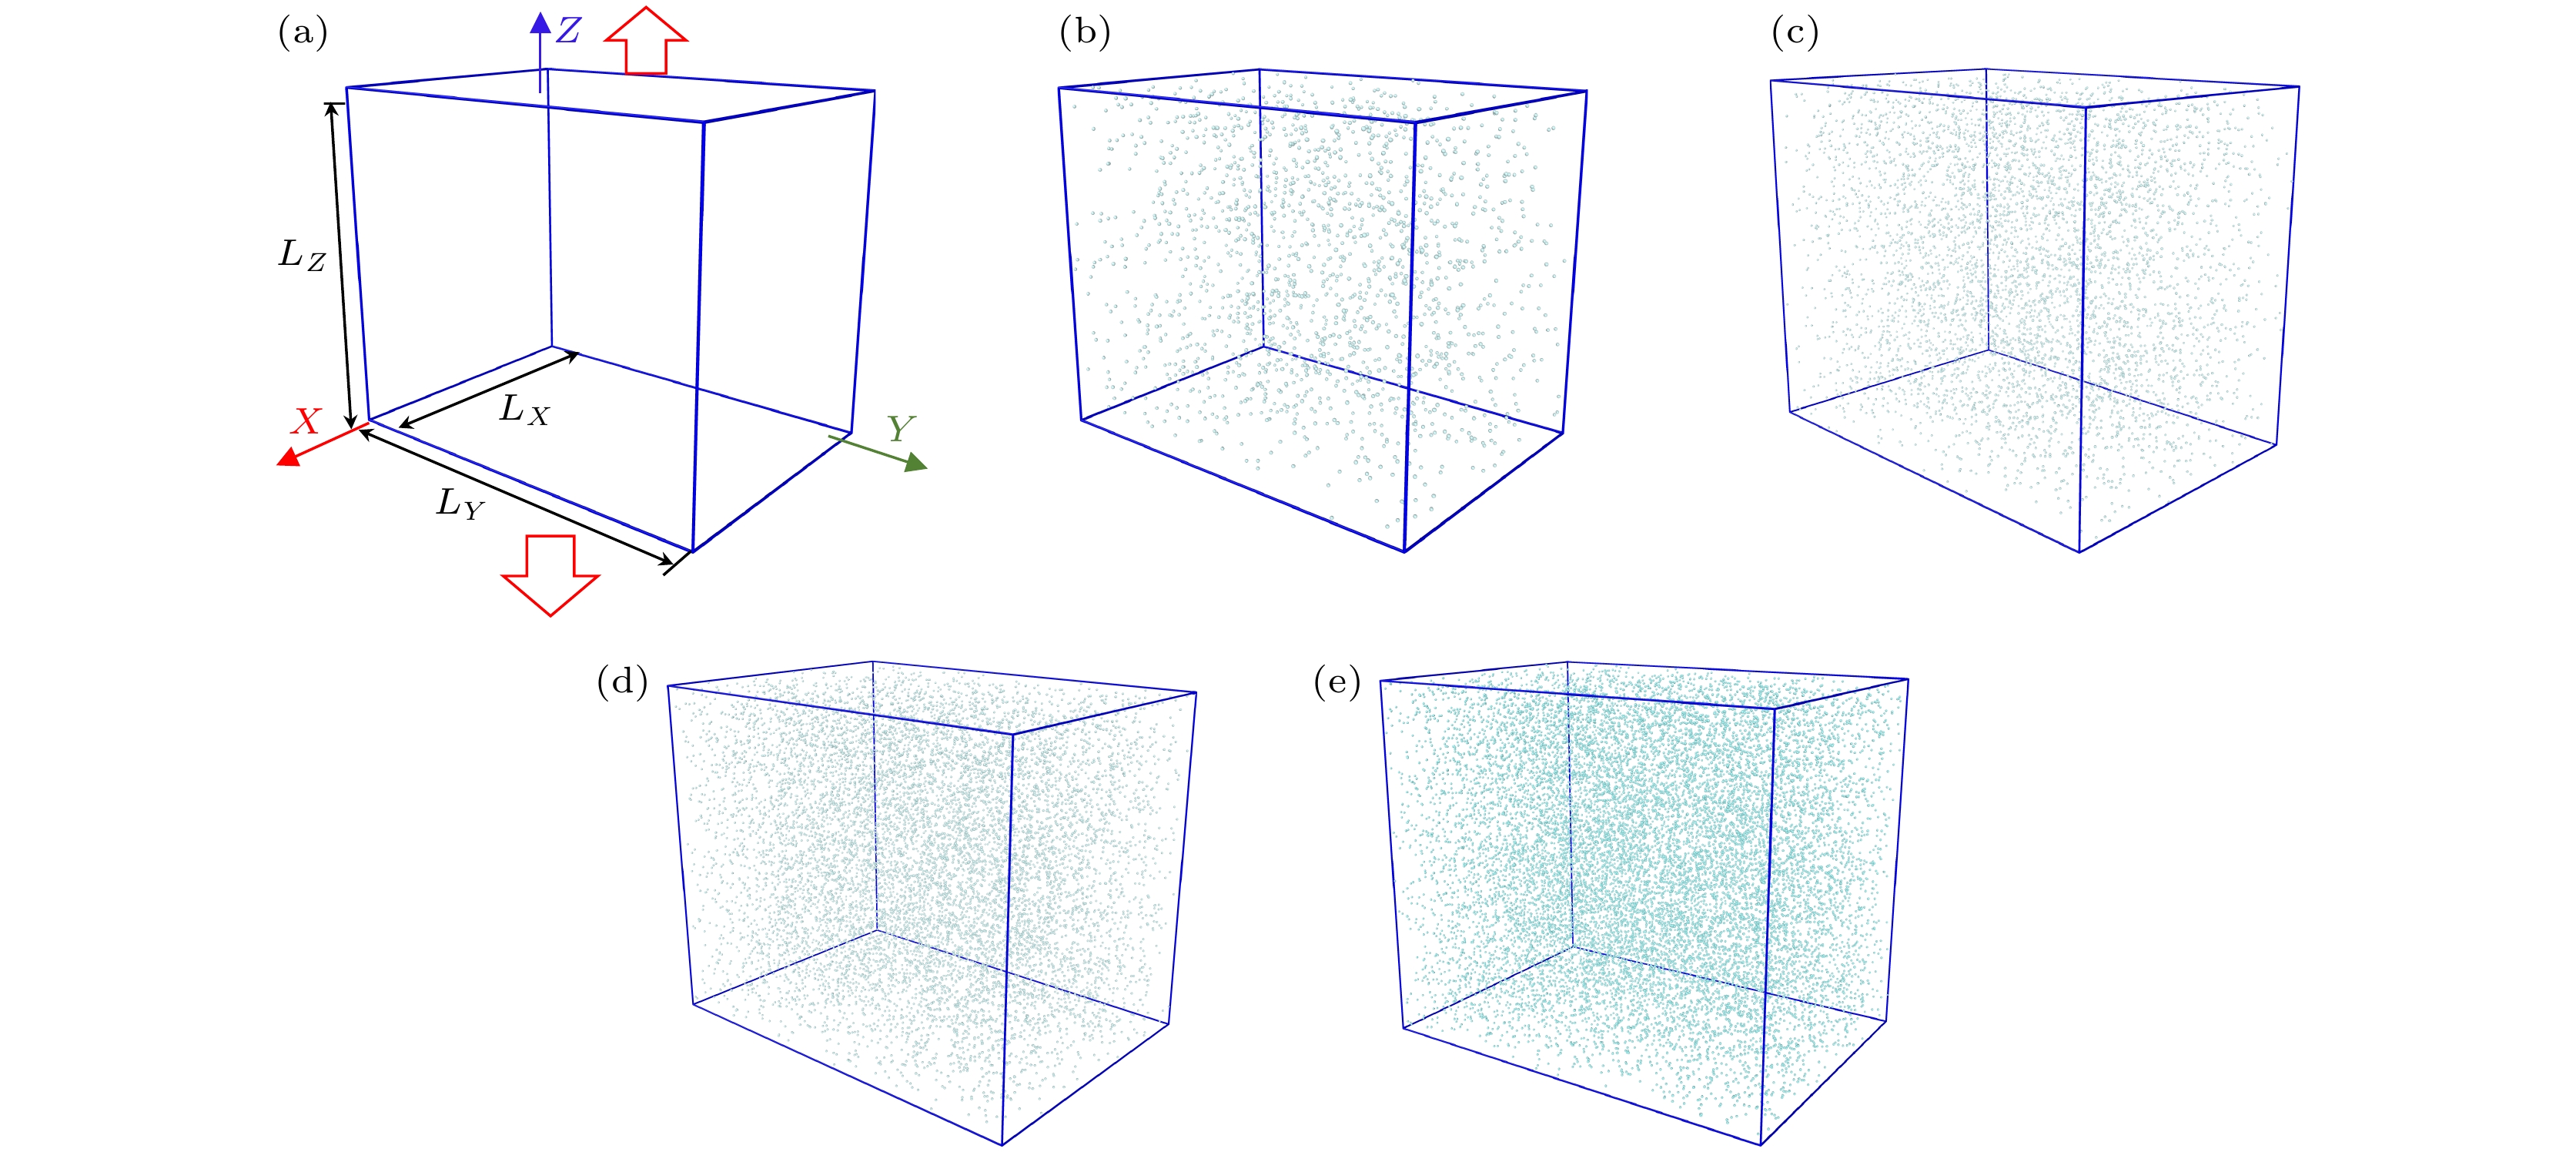
图 1 含有不同氦浓度的单晶铁拉伸的分子动力学模型示意图及对应氦浓度模型 (a) 模型示意图; (b) NHe = 0.5%; (c) NHe = 1.5%; (d) NHe = 3.0%; (e) NHe = 4.5%. Fe原子被隐藏以更好地观察氦原子分布和形貌
Figure 1. Schematic of molecular dynamics models for tensile deformation of single-crystal iron with different helium concentrations and corresponding models (a) Schematic of the model; (b) NHe = 0.5%; (c) NHe = 1.5%; (d) NHe = 3.0%; (e) NHe = 4.5%. Fe atoms are hidden to better observe the distribution and morphology of helium atoms.
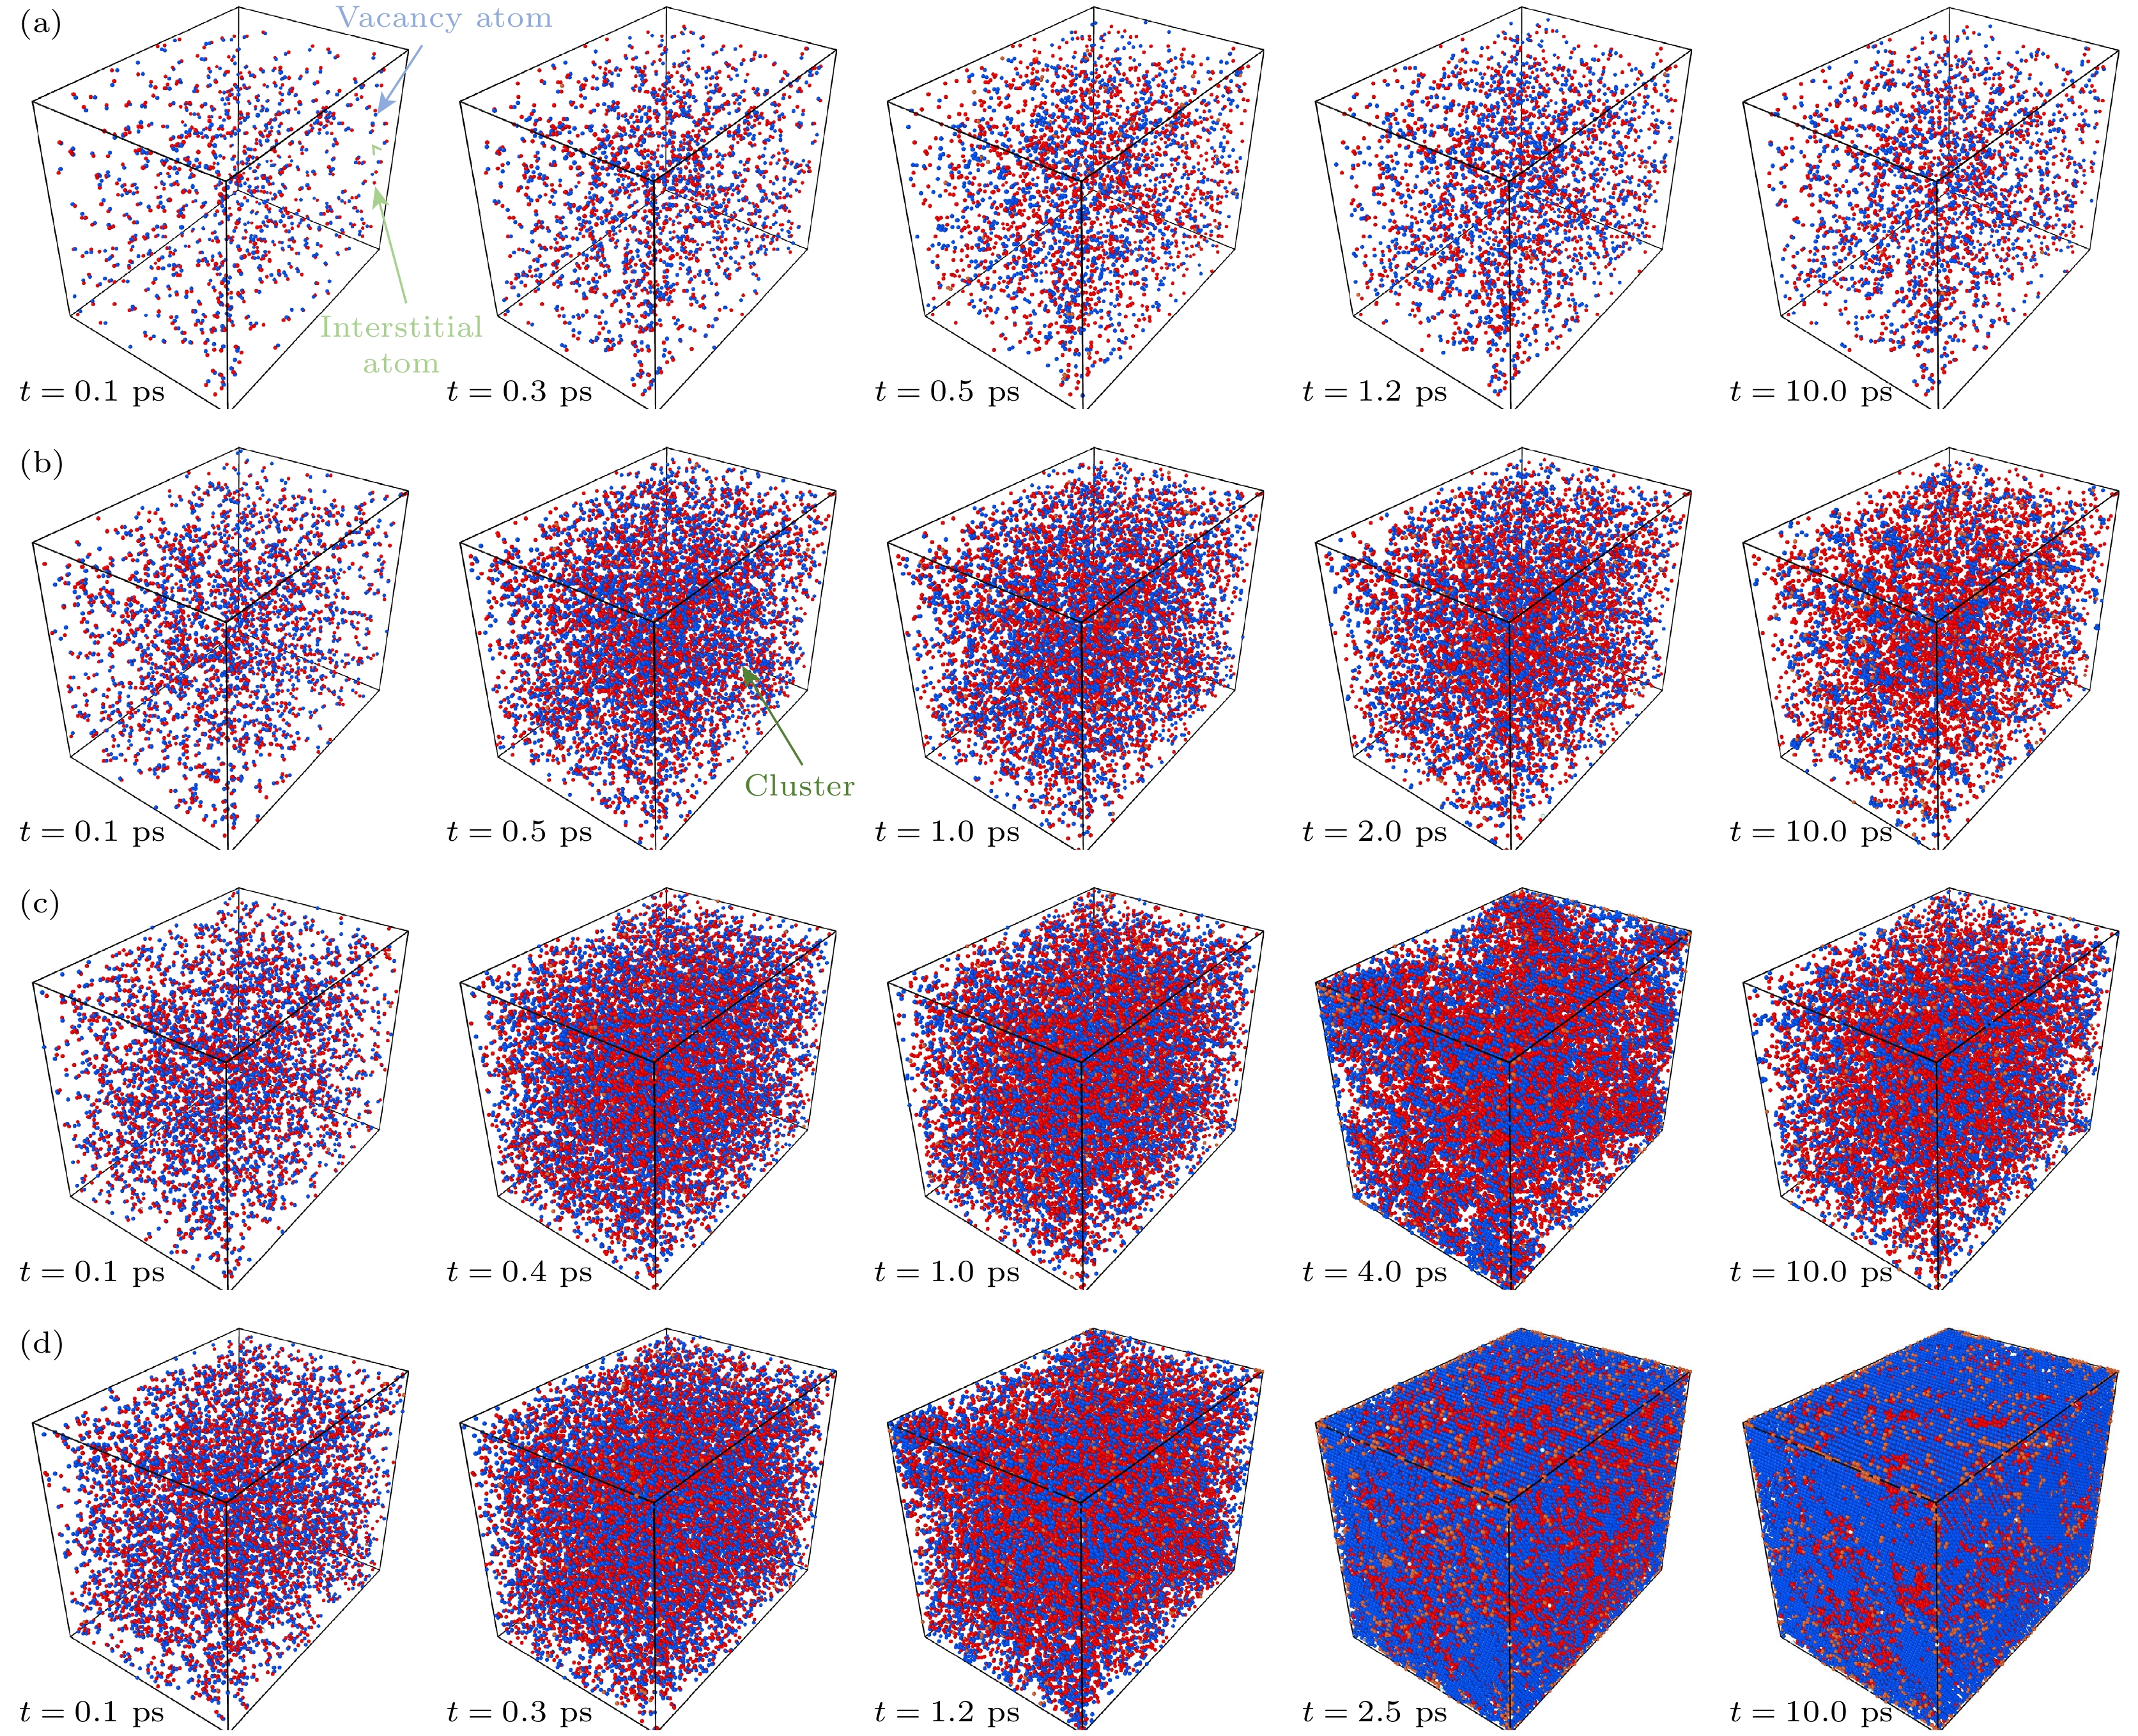
图 2 不同氦浓度单晶铁中缺陷演化过程 (a) NHe = 0.5%; (b) NHe = 1.5%; (c) NHe = 3.0%; (d) NHe = 4.5%. 红色小球代表空位, 蓝色小球代表间隙原子
Figure 2. Defect evolution processes in single-crystal iron with different helium concentrations: (a) NHe = 0.5%; (b) NHe = 1.5%; (c) NHe = 3.0%; (d) NHe = 4.5%. Red spheres represent vacancies, and blue spheres represent interstitial atoms.
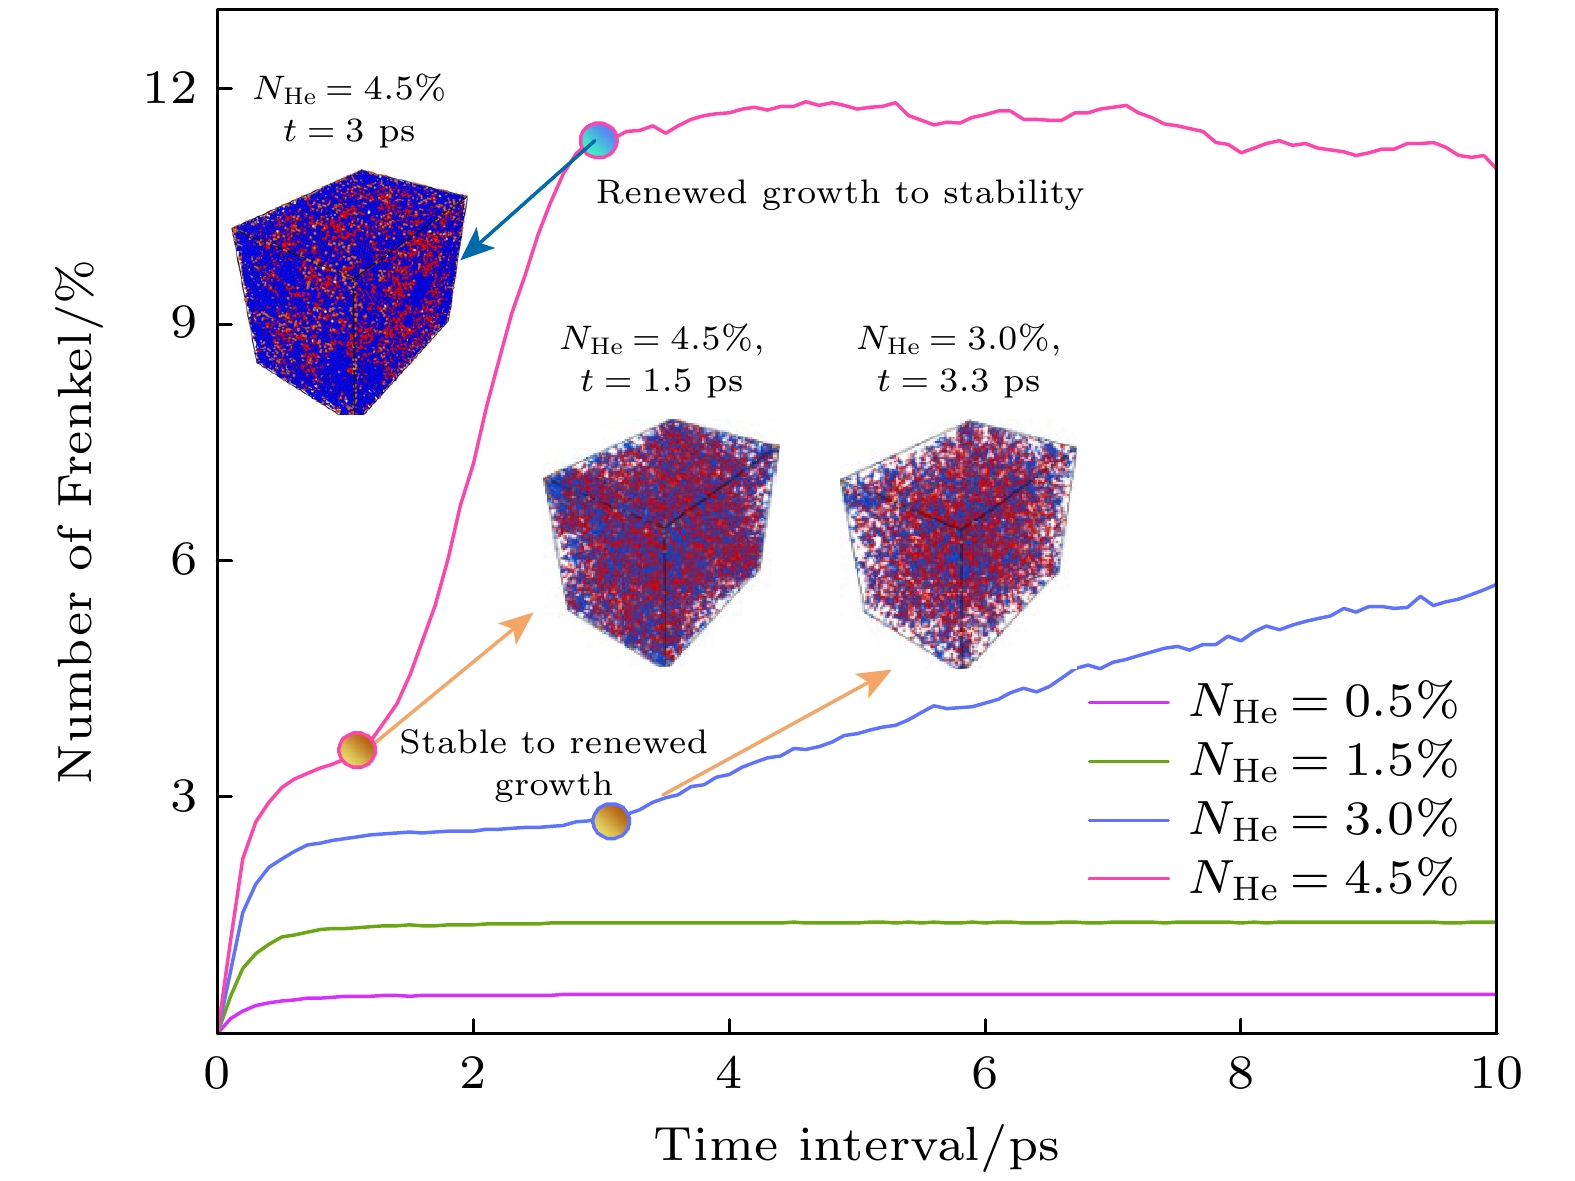
图 3 弗仑克尔缺陷对数量
Figure 3. Number of Frenkel pairs.
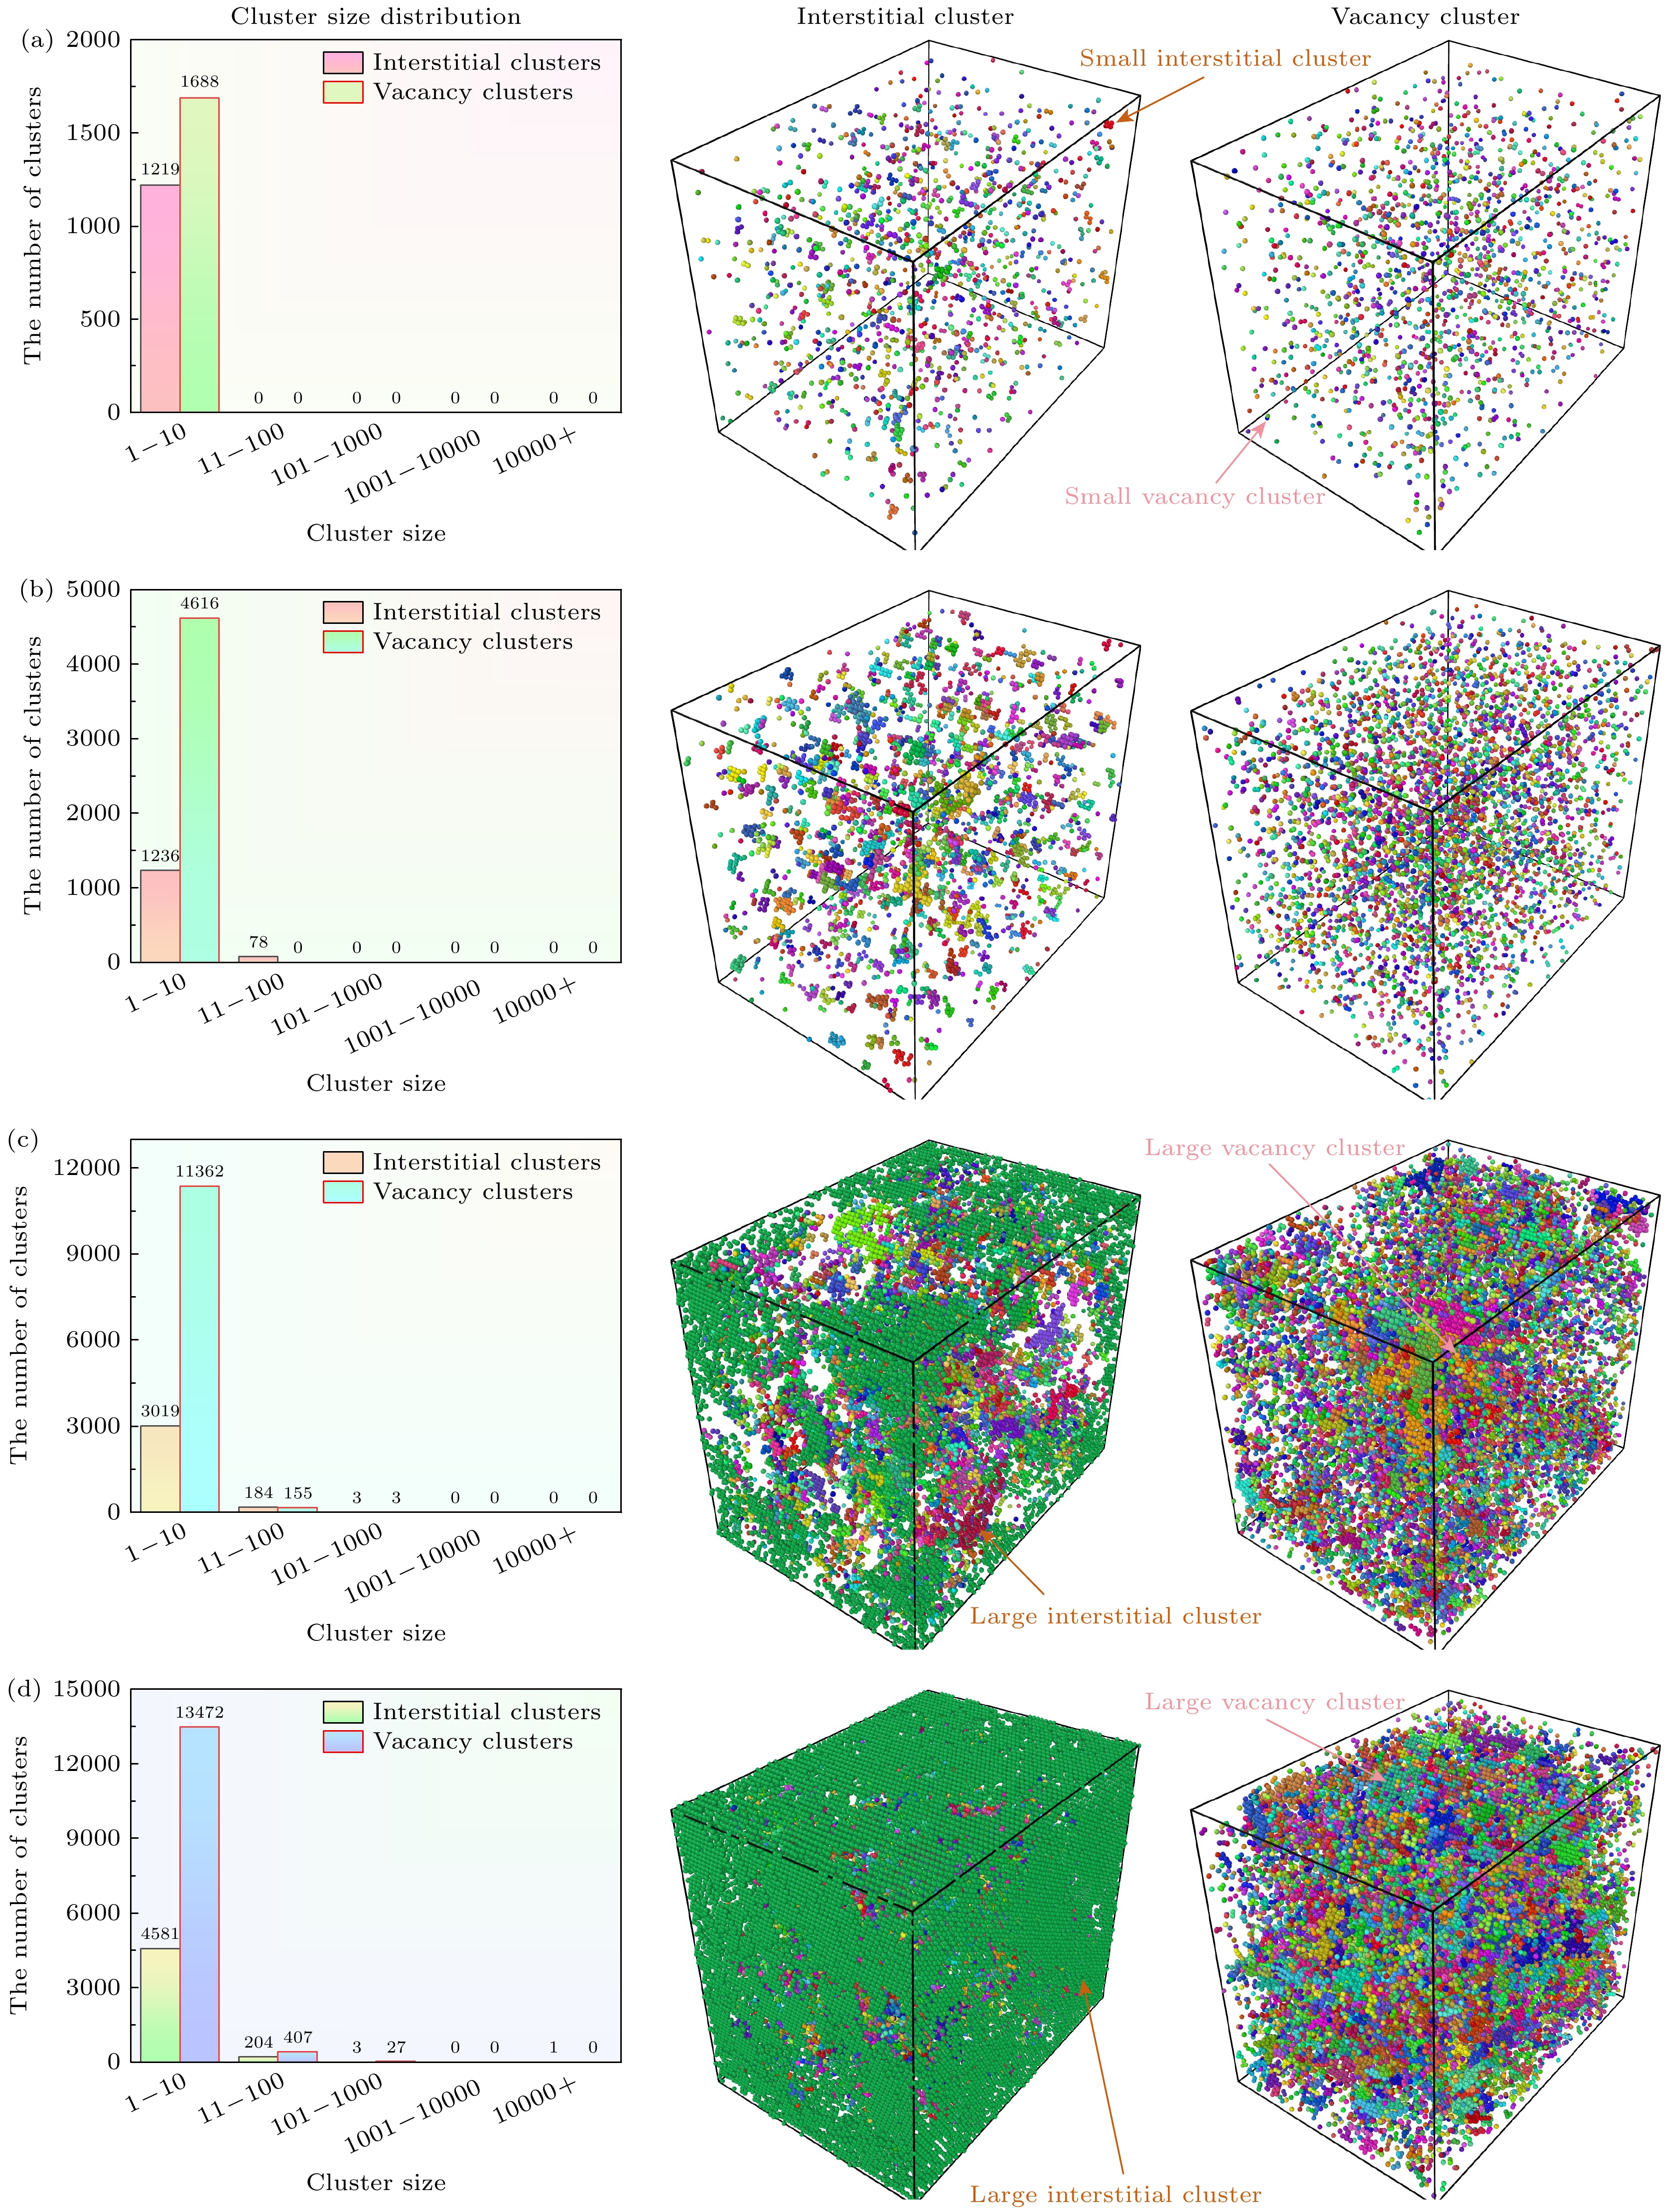
图 4 缺陷演化最后阶段不同氦浓度的团簇分布图 (a) NHe = 0.5%; (b) NHe = 1.5%; (c) NHe = 3.0%; (d) NHe = 4.5%
Figure 4. Distribution maps of clusters at the final stage of defect evolution with different helium concentrations: (a) NHe = 0.5%; (b) NHe = 1.5%; (c) NHe = 3.0%; (d) NHe = 4.5%.
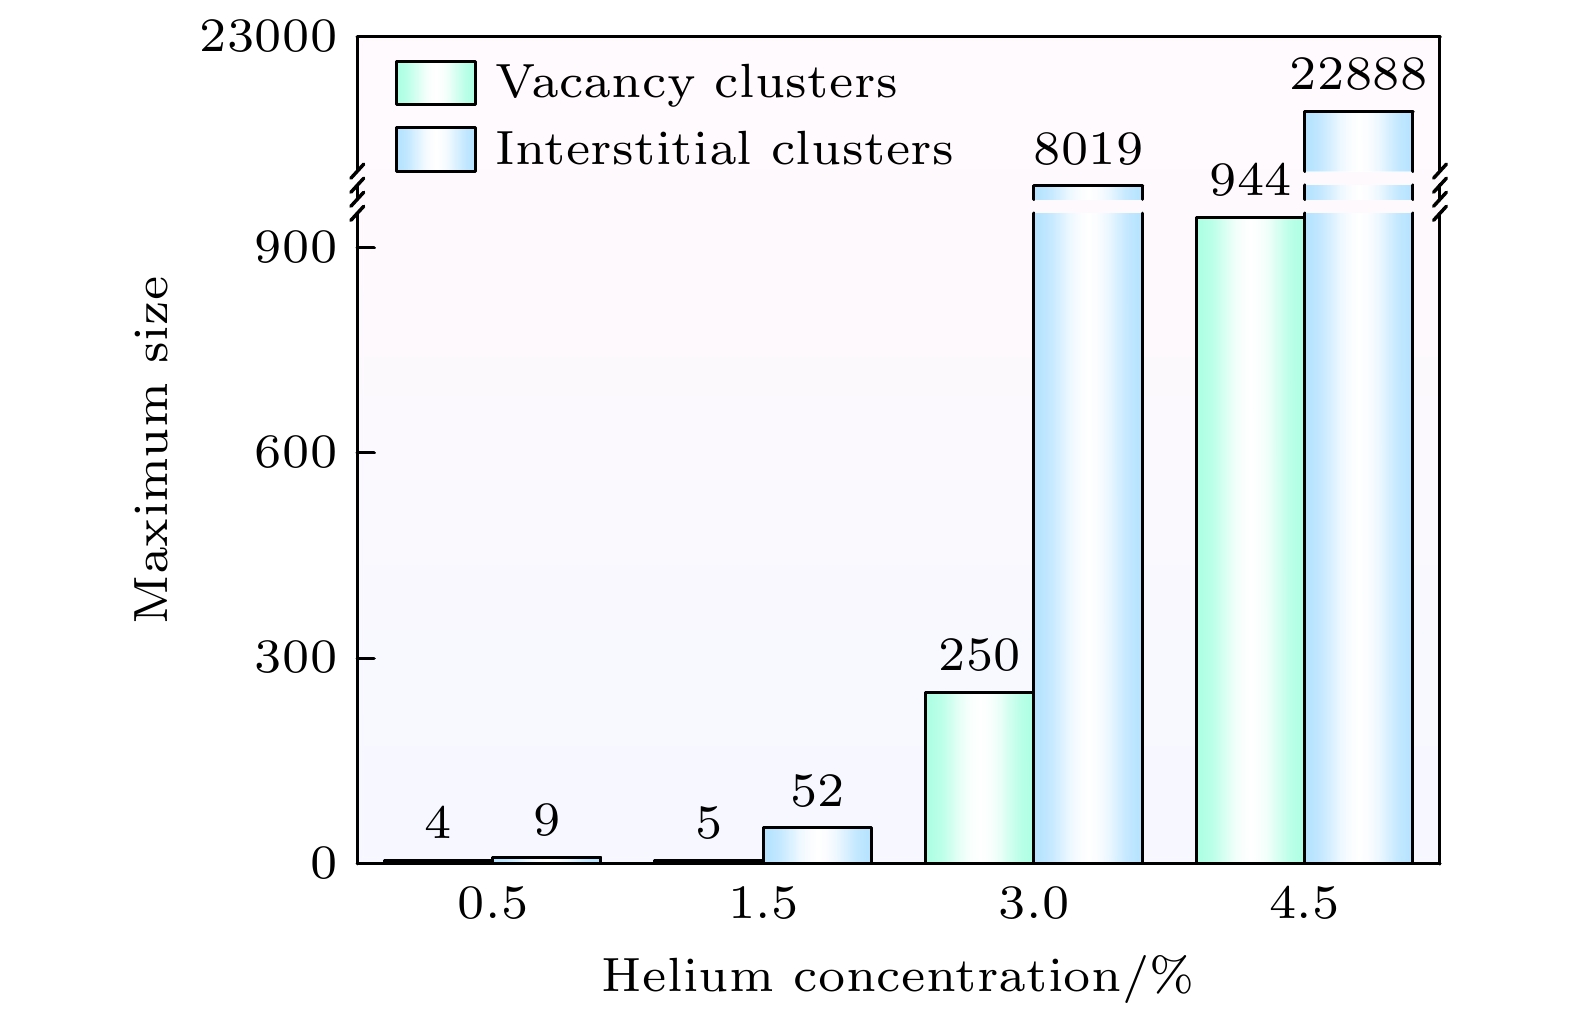
图 5 不同氦浓度单晶铁在稳定阶段的最大团簇尺寸
Figure 5. Maximum cluster size of single-crystal iron with different helium concentrations at the stable stage.
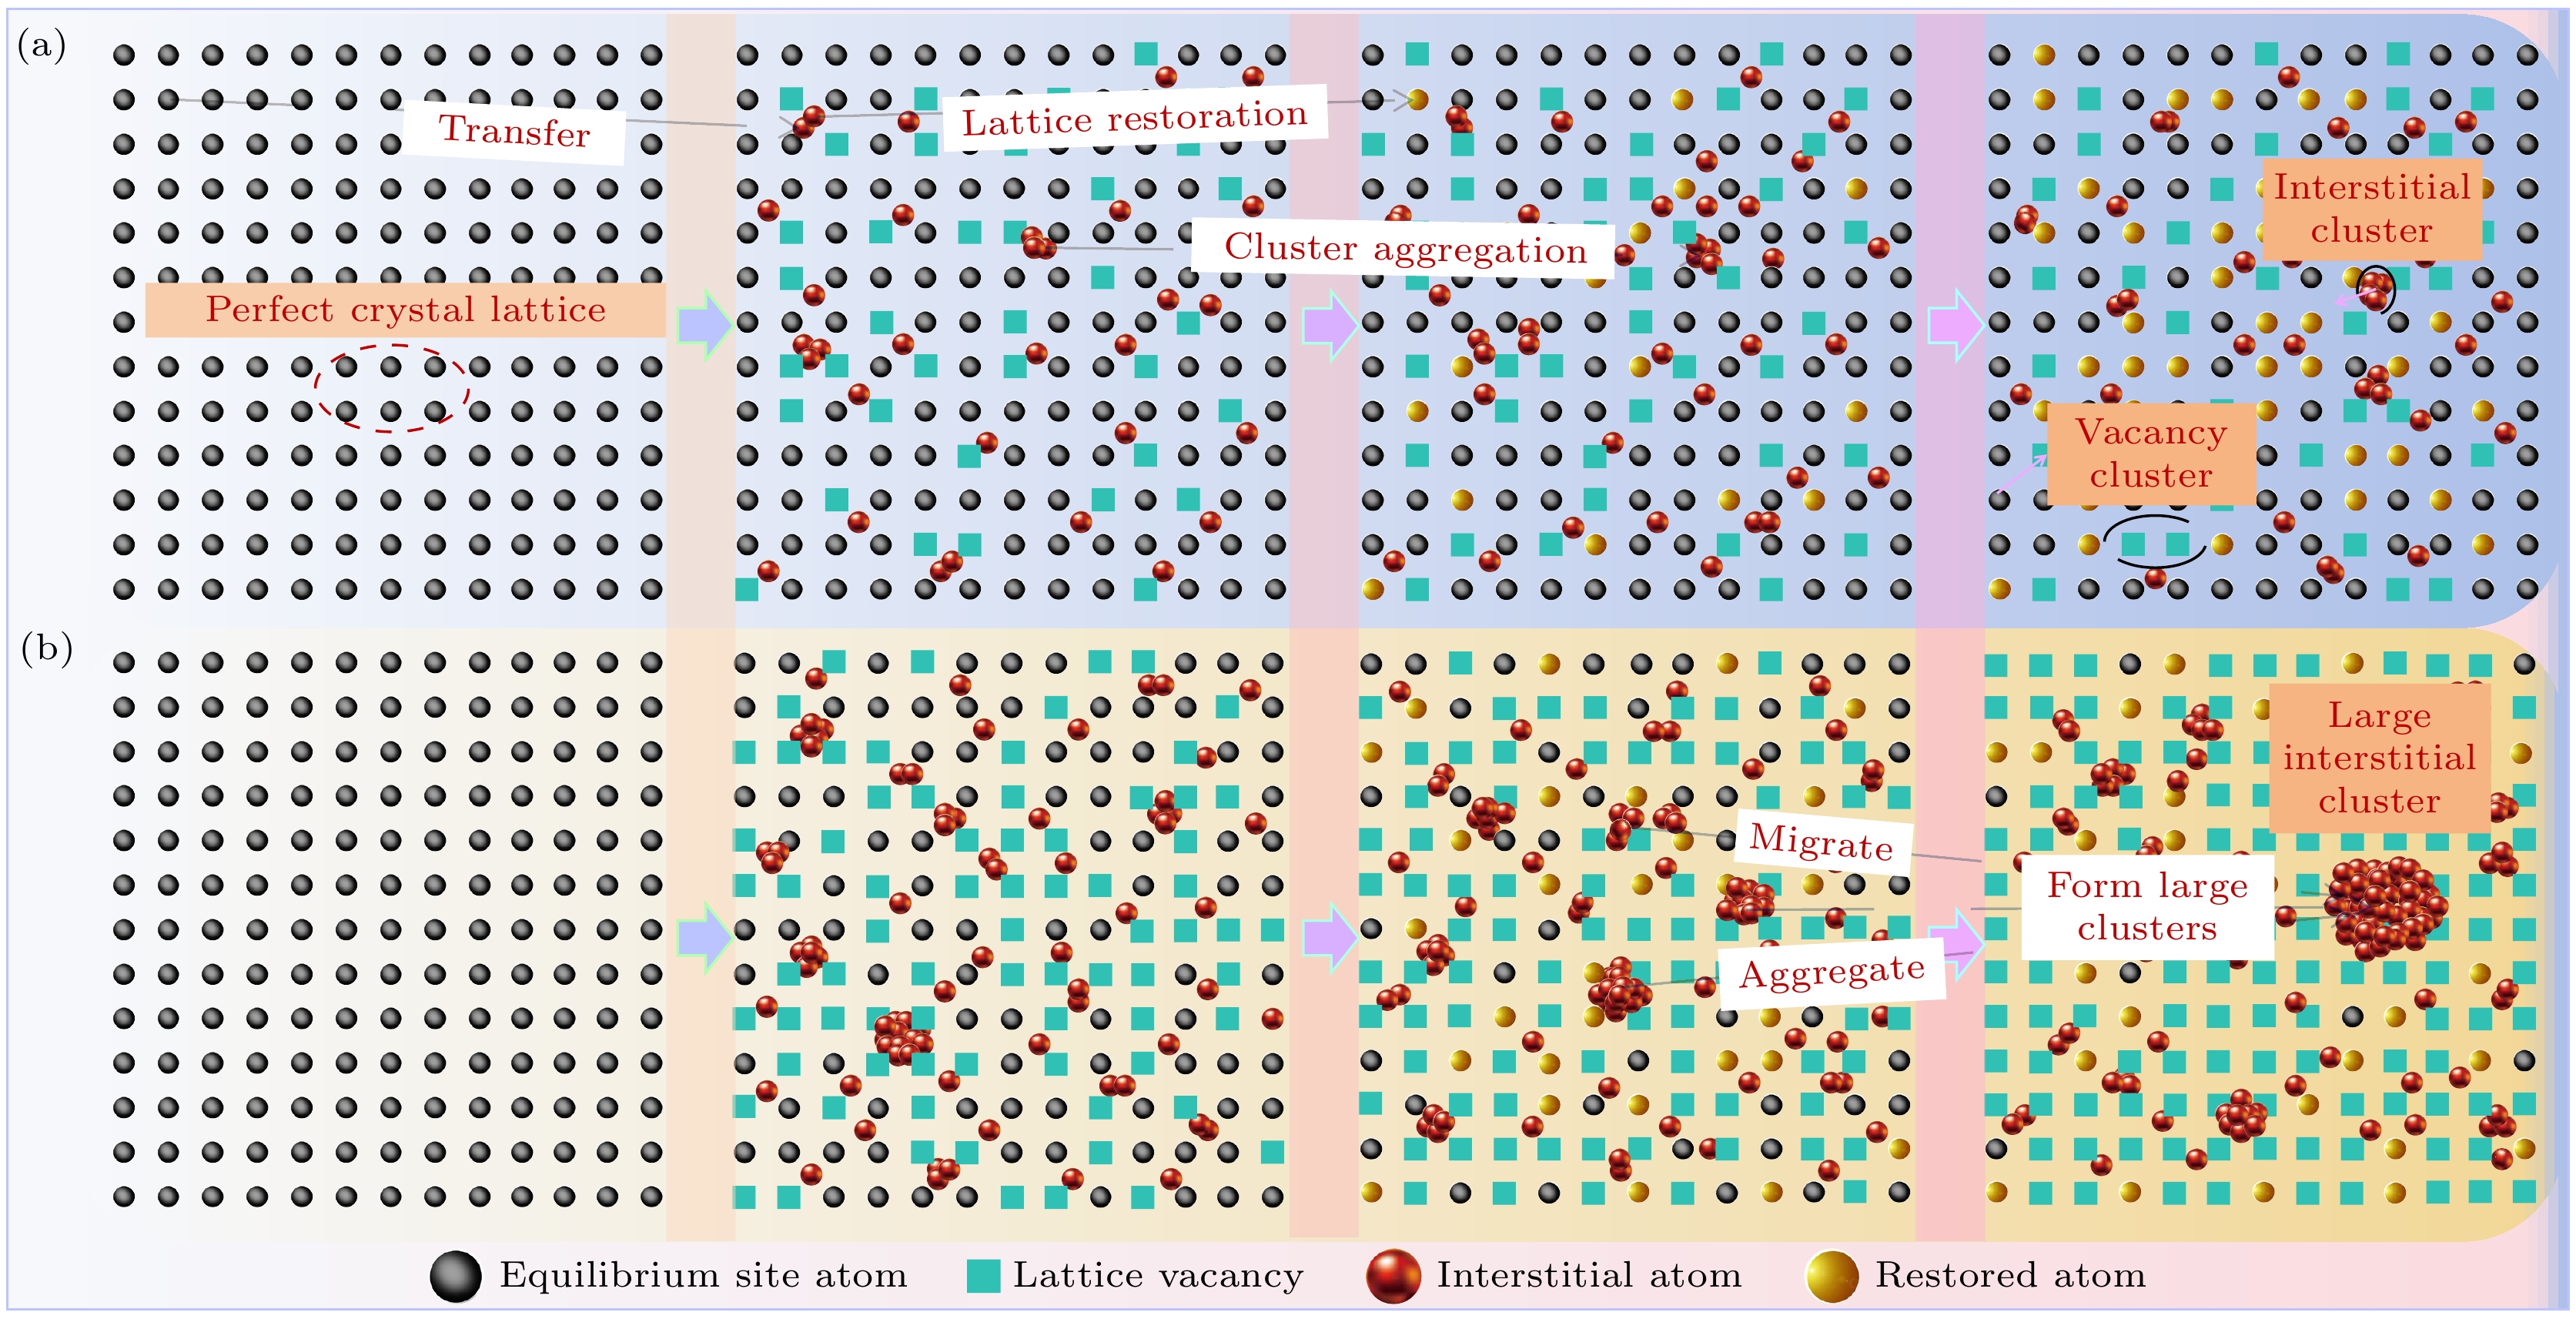
图 6 缺陷演化示意图 (a) NHe < 3.0%; (b) NHe ≥ 3.0%
Figure 6. Schematic of defect evolution: (a) NHe < 3.0%; (b) NHe ≥ 3.0%.
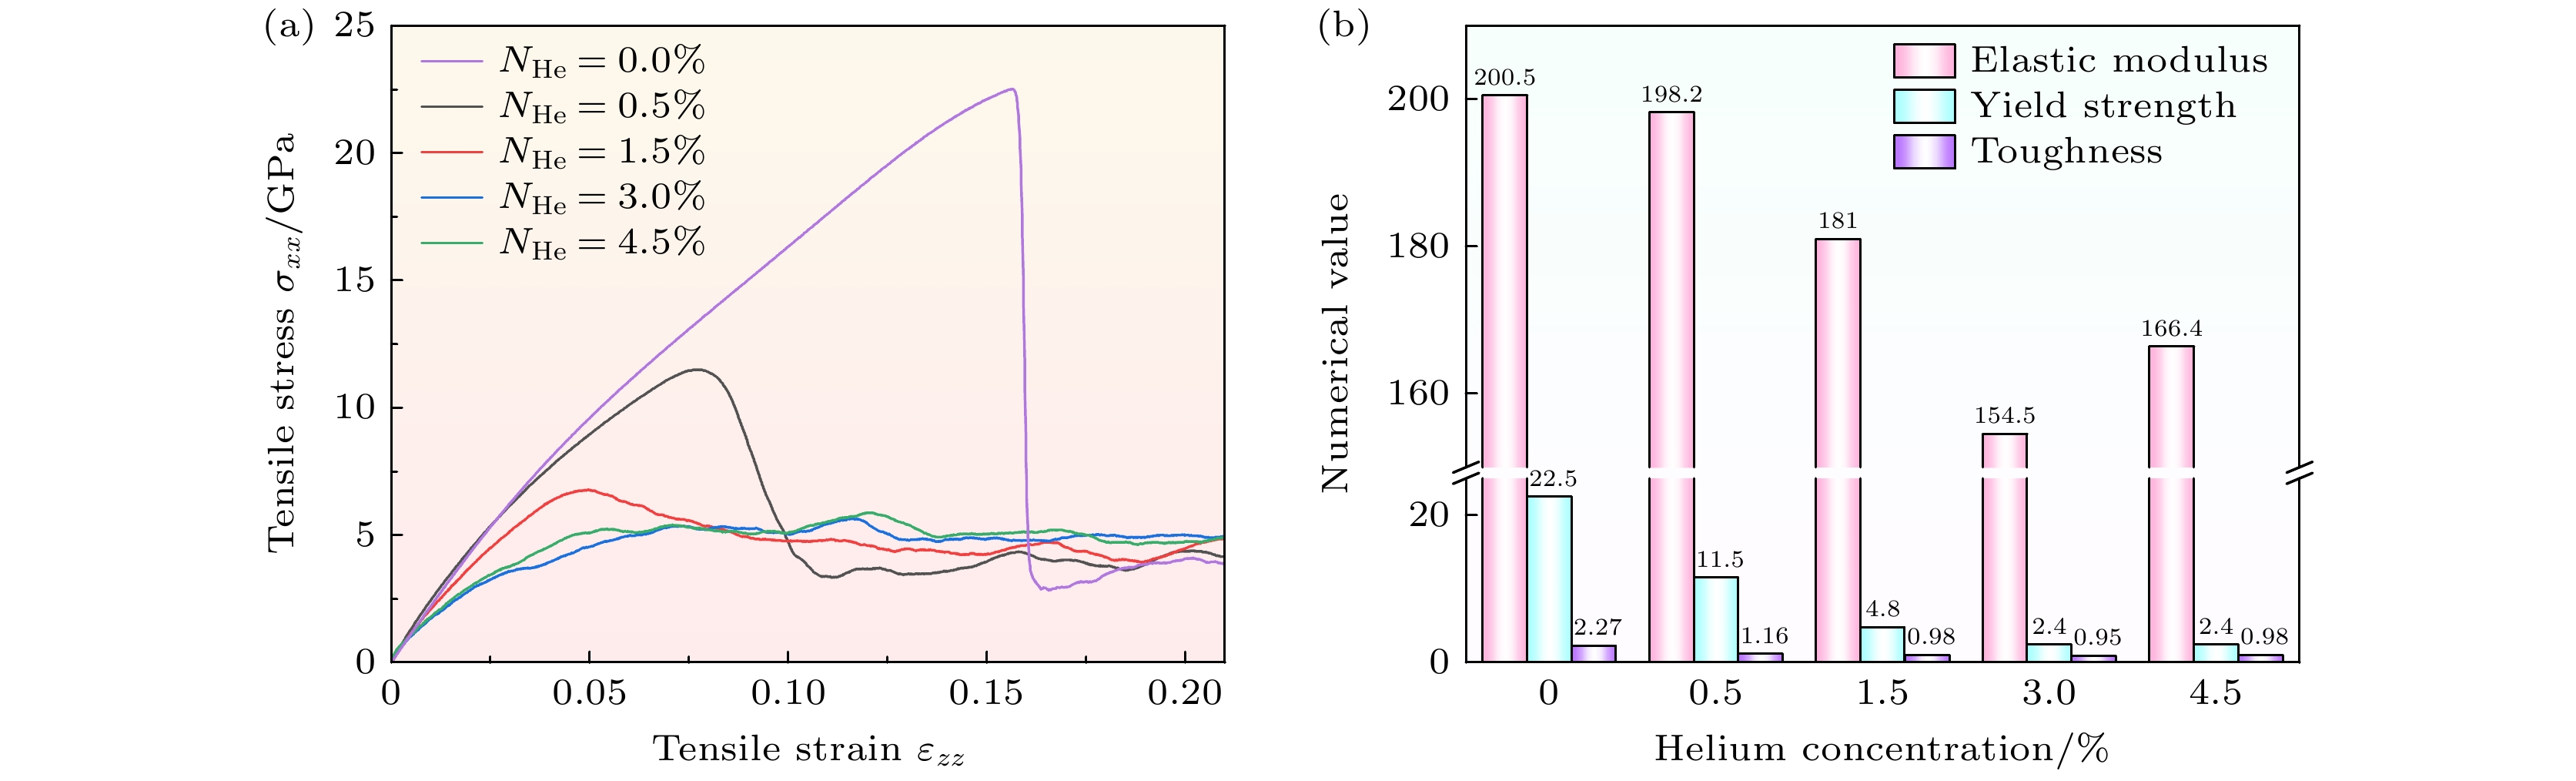
图 7 氦浓度对单晶铁力学行为的影响 (a) 应力应变曲线; (b) 弹性模量、屈服强度、韧性
Figure 7. Effect of helium concentration on mechanical behavior of single-crystal iron: (a) Stress-strain curves; (b) elastic modulus, yield strength, and toughness.
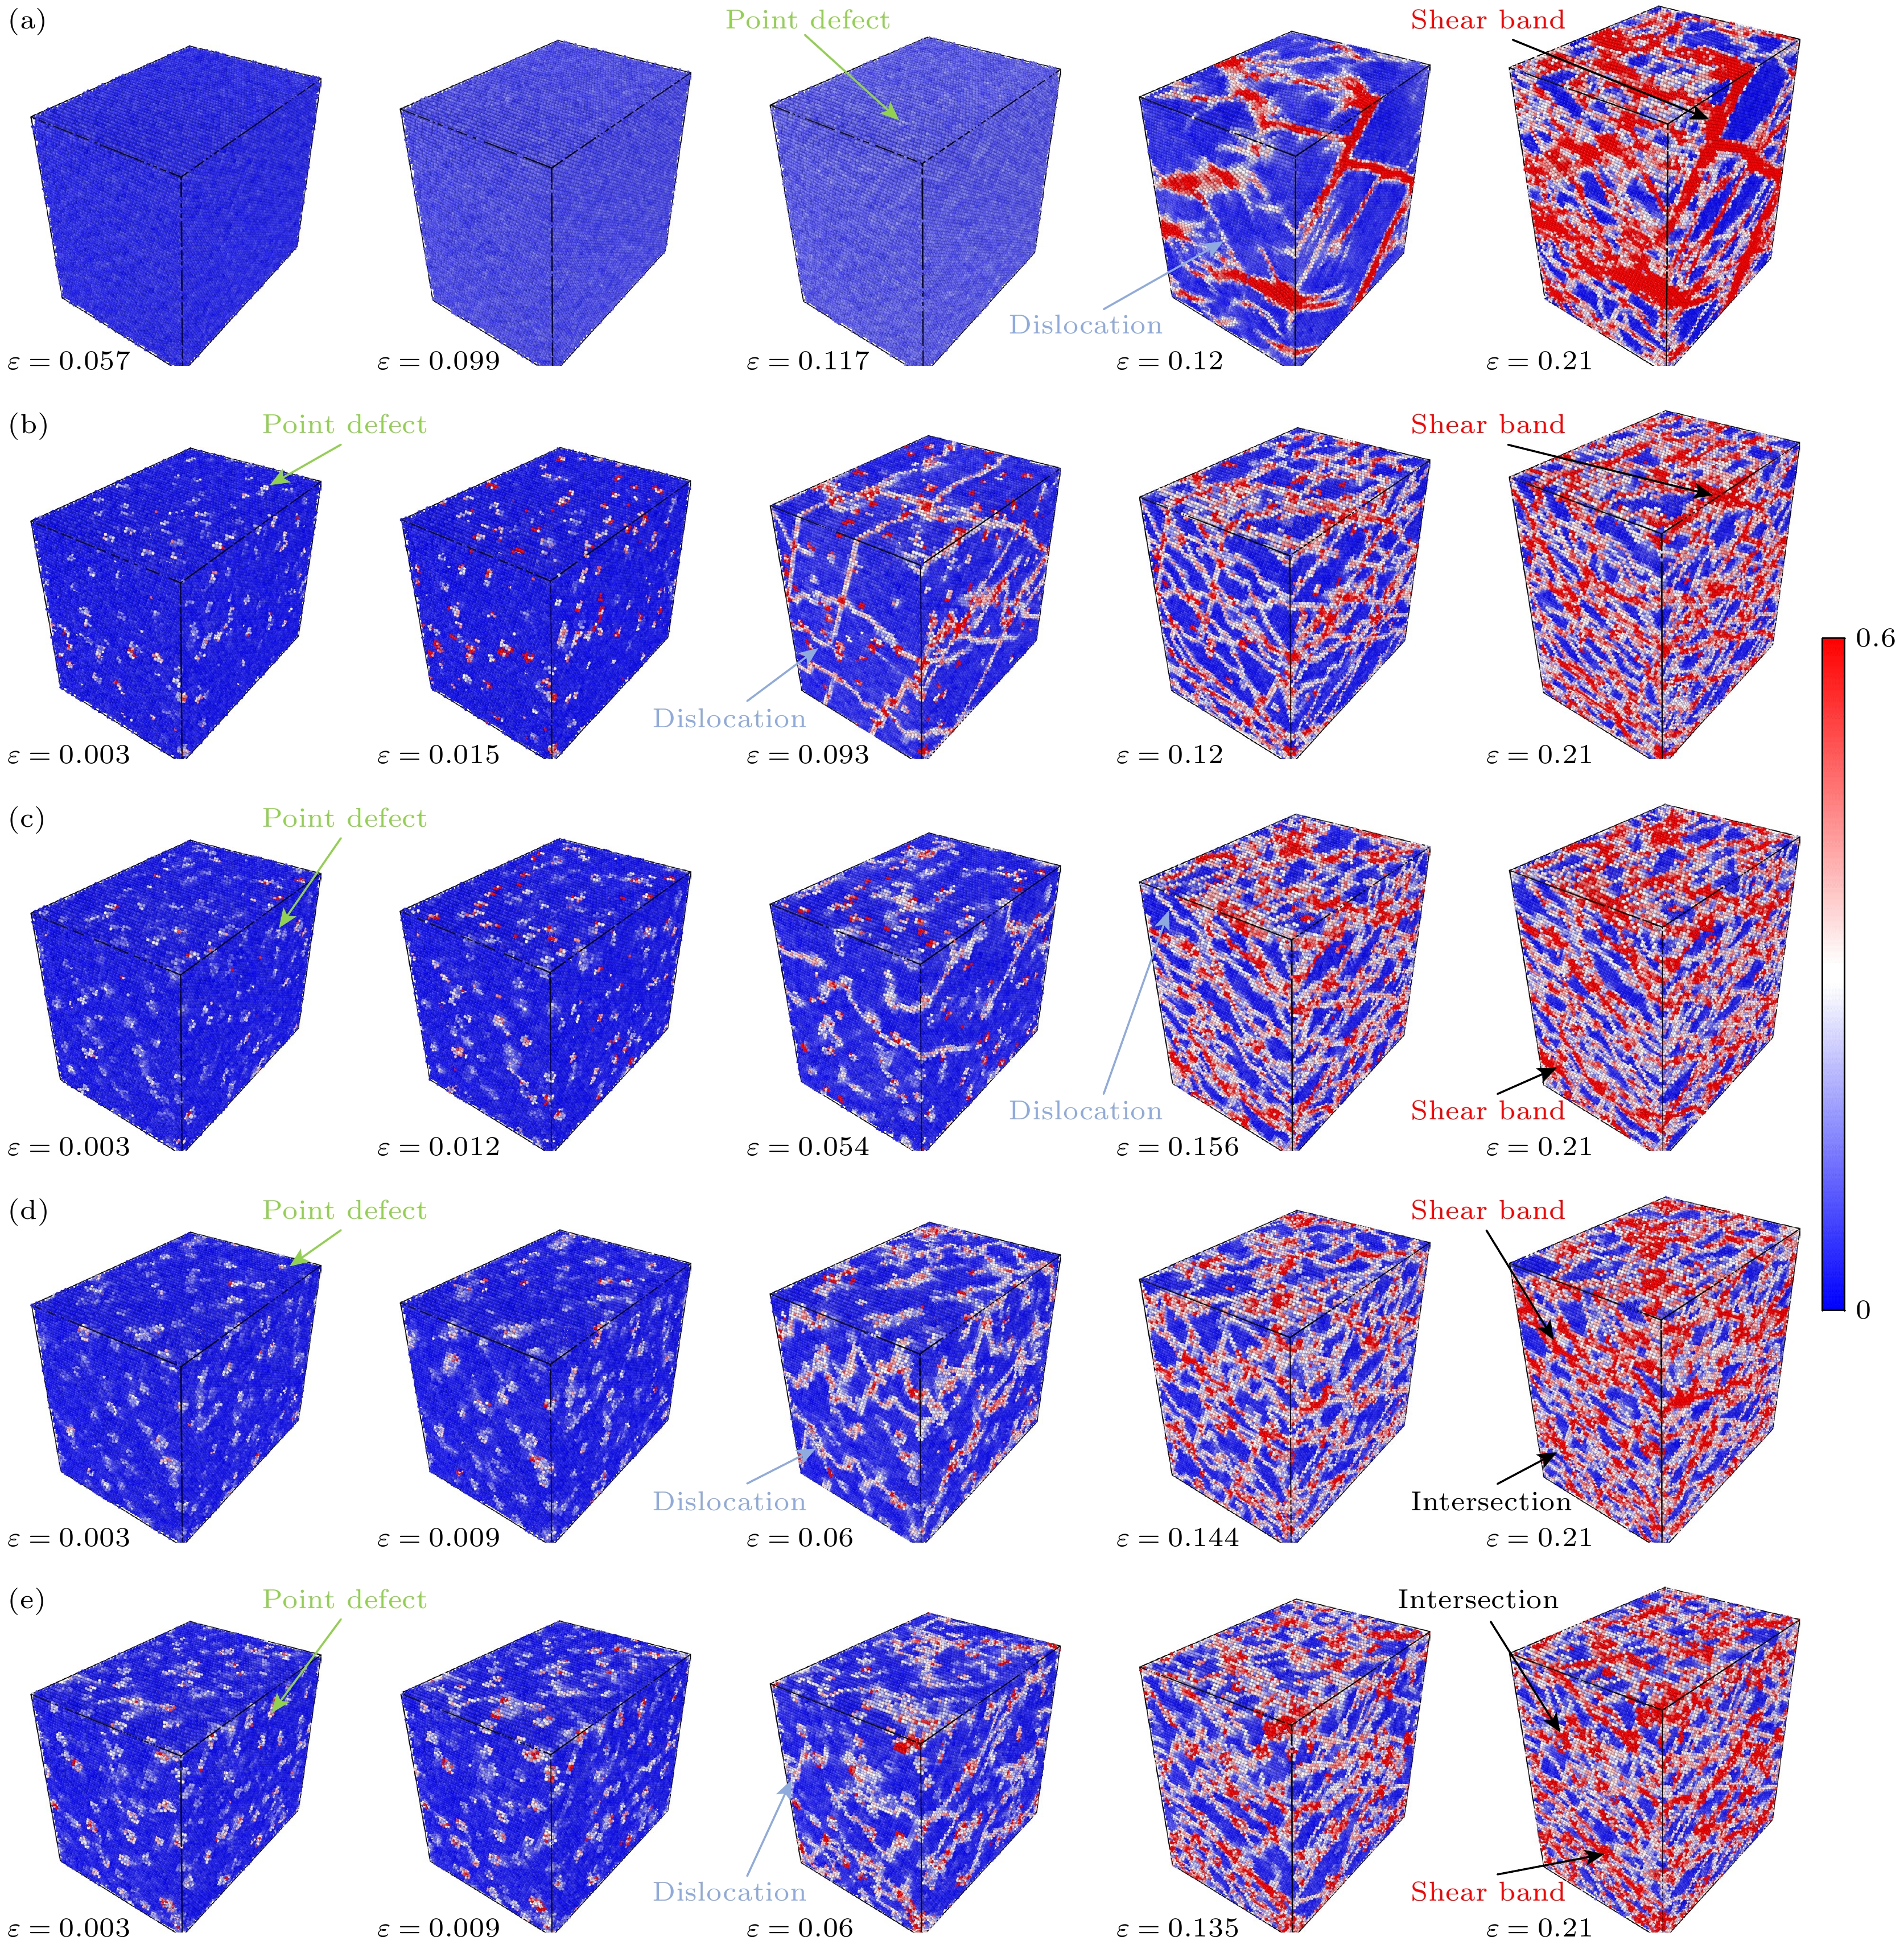
图 8 不同氦浓度的剪切应变云图 (a) 原始单晶铁; (b) NHe = 0.5%; (c) NHe = 1.5%; (d) NHe = 3.0%; (e) NHe = 4.5%
Figure 8. Shear stress-strain contour plots after helium concentration effect: (a) Original single-crystal iron; (b) NHe = 0.5%; (c) NHe = 1.5%; (d) NHe = 3.0%; (e) NHe = 4.5%.
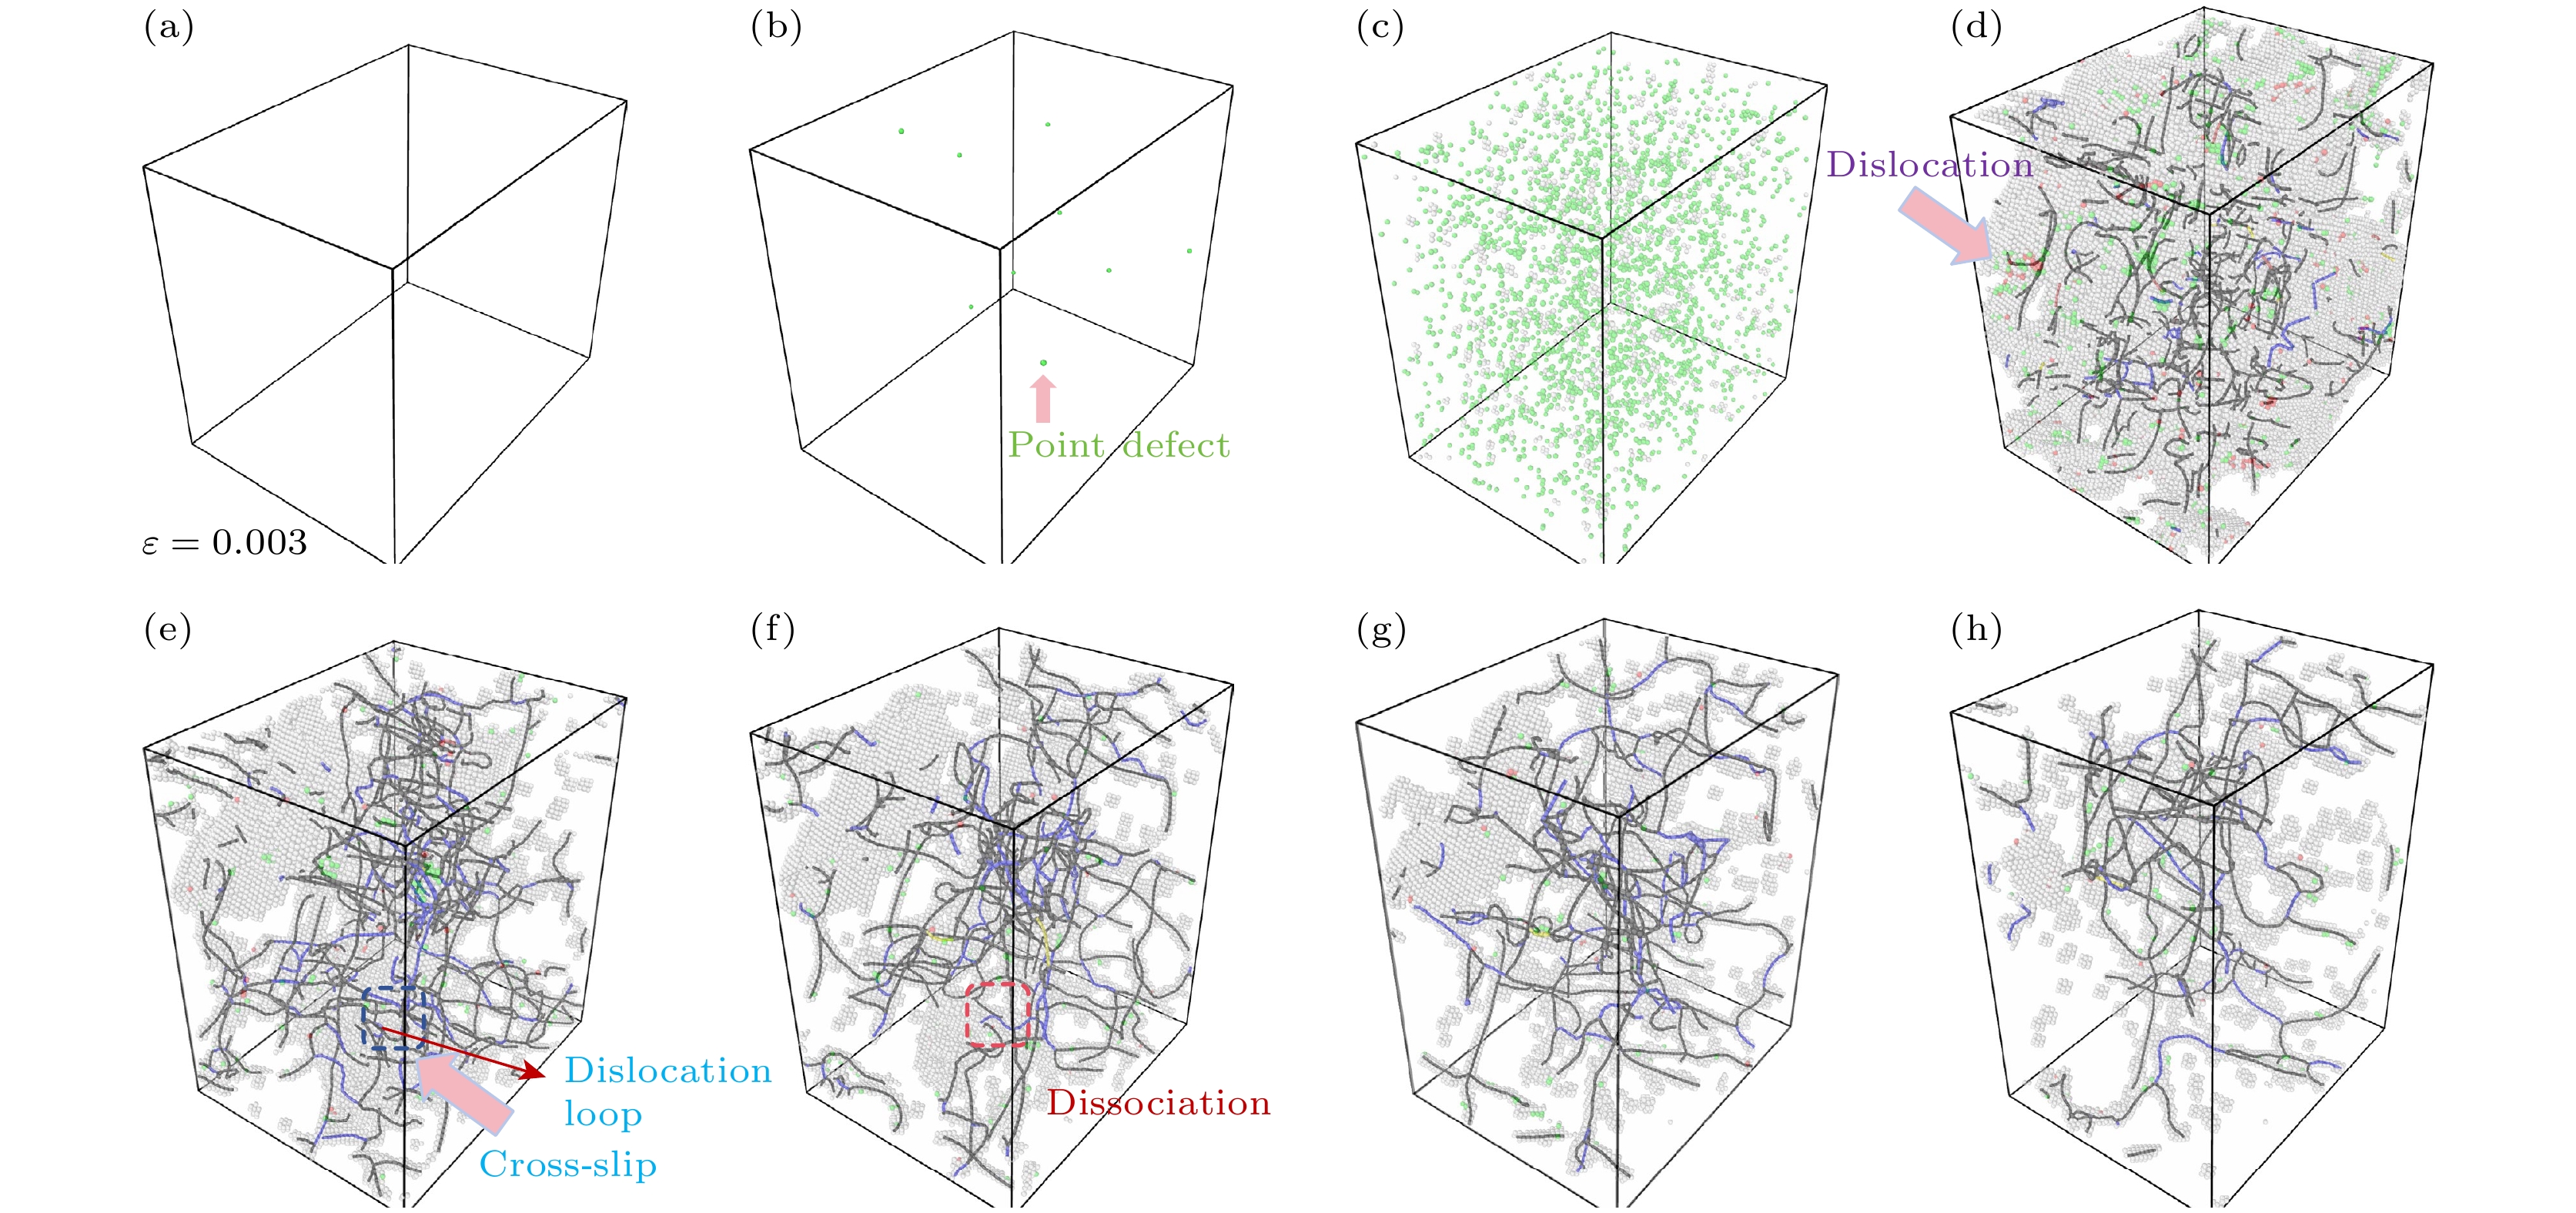
图 9 无氦的单晶铁在拉伸过程中的原子构型演化 (a) ε = 0.003; (b) ε = 0.054; (c) ε = 0.108; (d) ε = 0.12; (e) ε = 0.135; (f) ε = 0.165; (g) ε = 0.189; (h) ε = 0.21; 灰白色原子表示“other”, 绿色表示“fcc”; 线条为位错线, 黑色表示“1/2$ \left\langle {111} \right\rangle $”, 蓝色表示“$ \left\langle {100} \right\rangle $”, 黄色表示“$ \left\langle {110} \right\rangle $”
Figure 9. Atomic configuration evolution of single-crystal iron without helium concentration effect during tensile deformation: (a) ε = 0.003; (b) ε = 0.054; (c) ε = 0.108; (d) ε = 0.12; (e) ε = 0.135; (f) ε = 0.165; (g) ε = 0.189; (h) ε = 0.21; gray-white atoms denote “other”, green denotes “fcc”; lines are dislocation lines, black denotes “1/2$ \left\langle {111} \right\rangle $”, blue denotes “$ \left\langle {100} \right\rangle $”, and yellow denotes “$ \left\langle {110} \right\rangle $”.
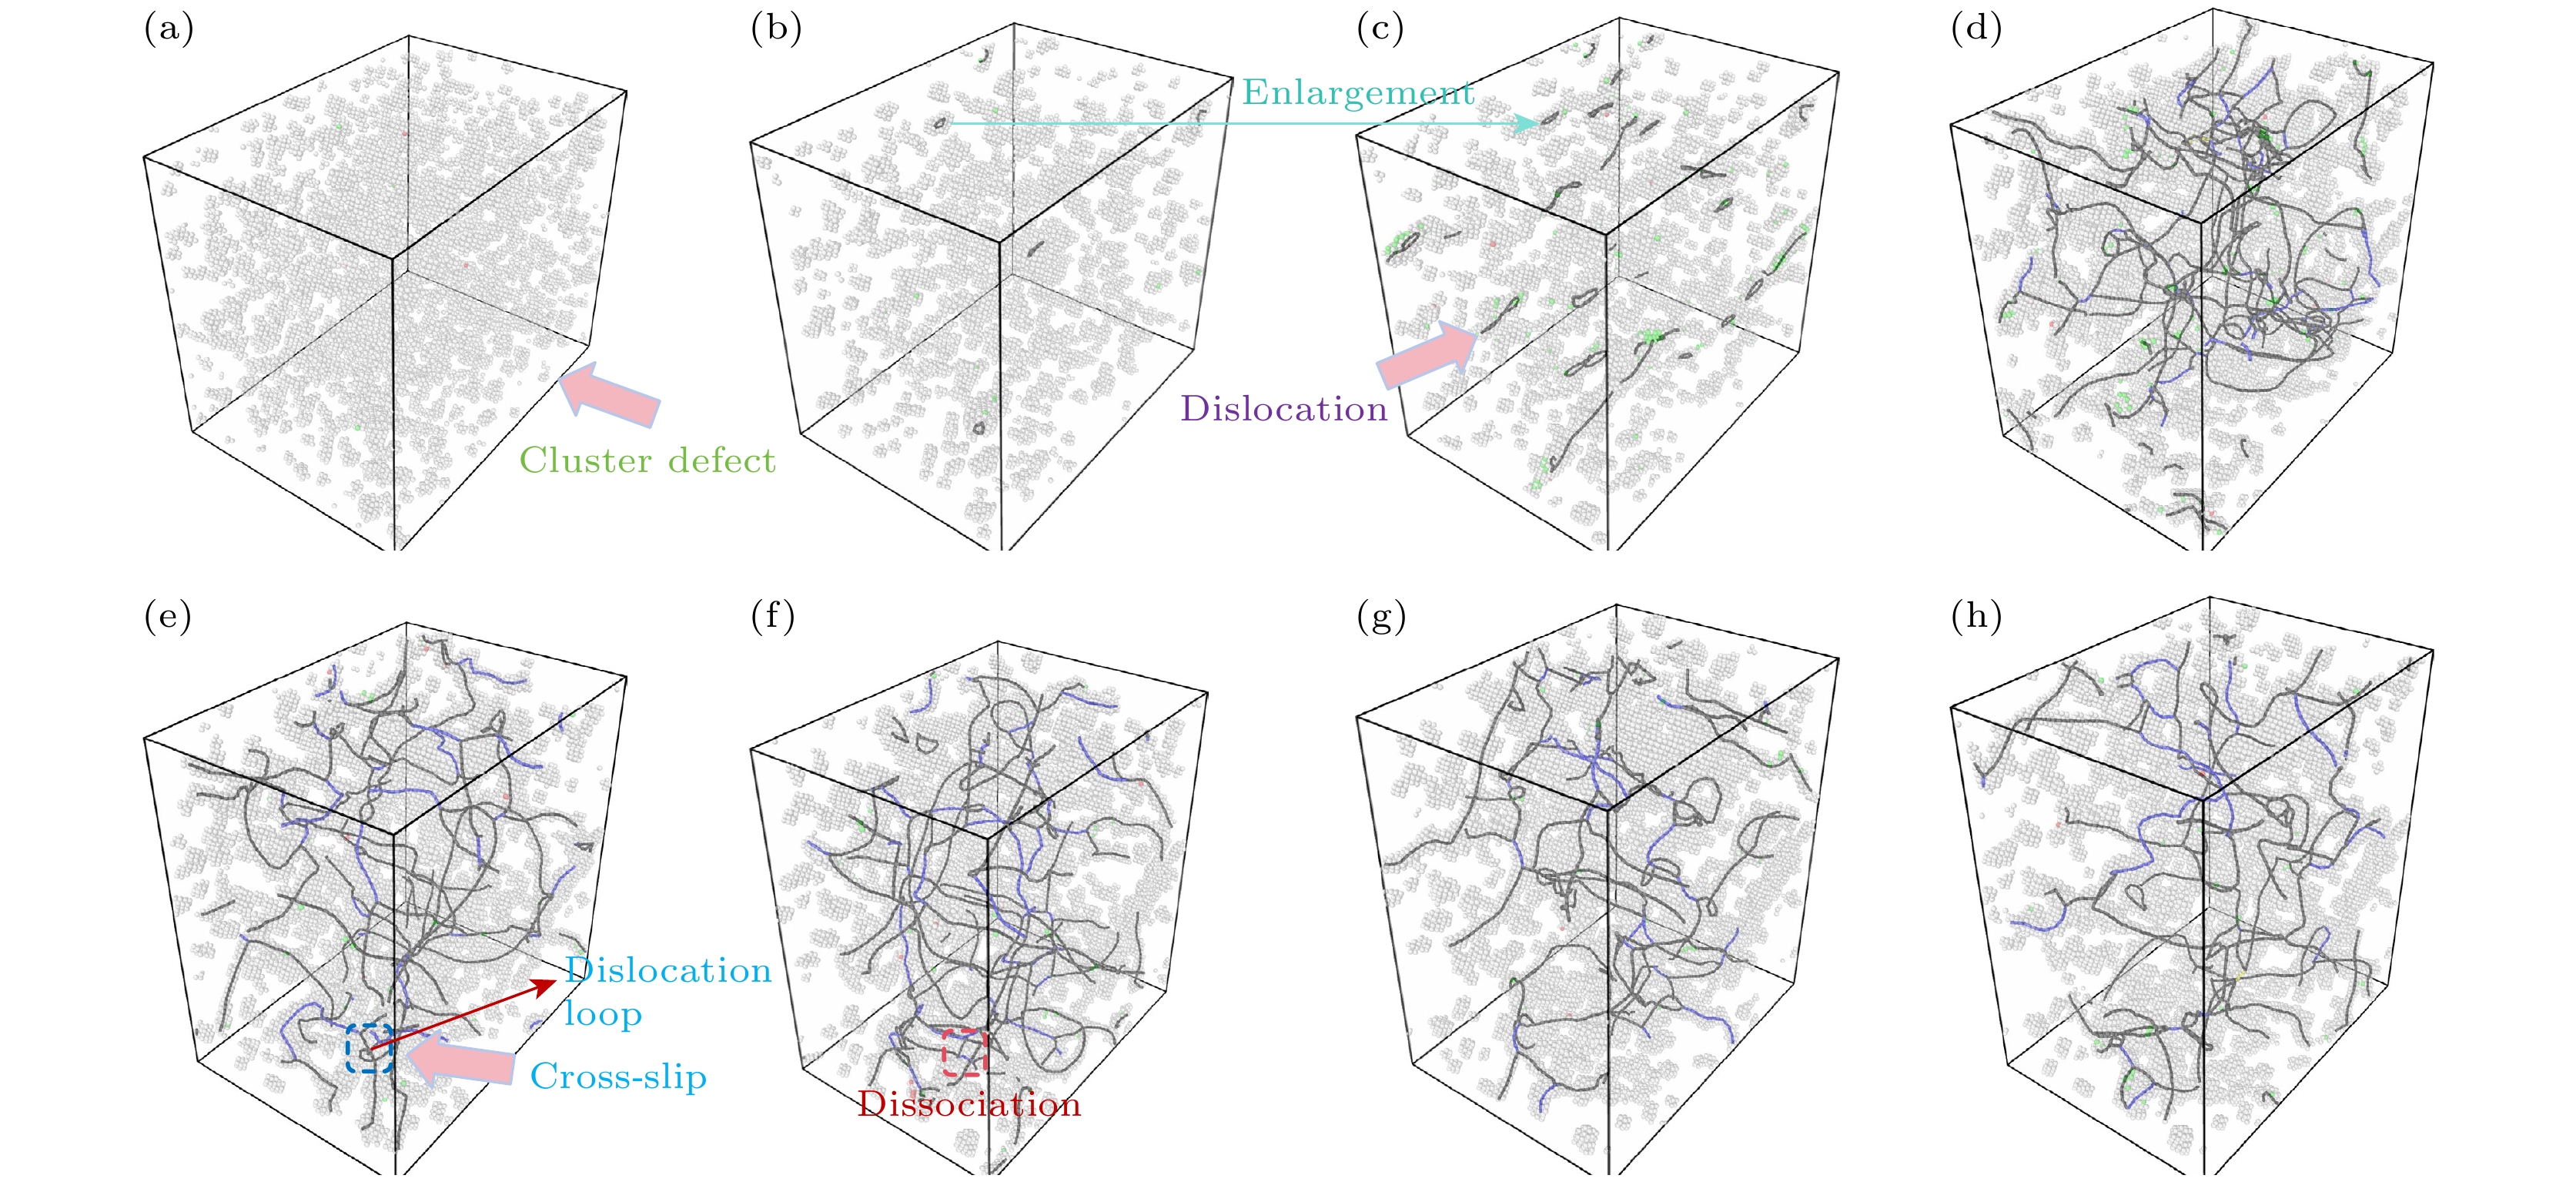
图 10 NHe = 0.5%单晶铁在拉伸过程中的原子构型演化 (a) ε = 0; (b) ε = 0.048; (c) ε = 0.075; (d) ε = 0.096; (e) ε = 0.126; (f) ε = 0.162; (g) ε = 0.186; (h) ε = 0.21
Figure 10. Atomic configuration evolution of single-crystal iron with 0.5% helium concentration during tensile deformation: (a) ε = 0; (b) ε = 0.048; (c) ε = 0.075; (d) ε = 0.096; (e) ε = 0.126; (f) ε = 0.162; (g) ε = 0.186; (h) ε = 0.21.
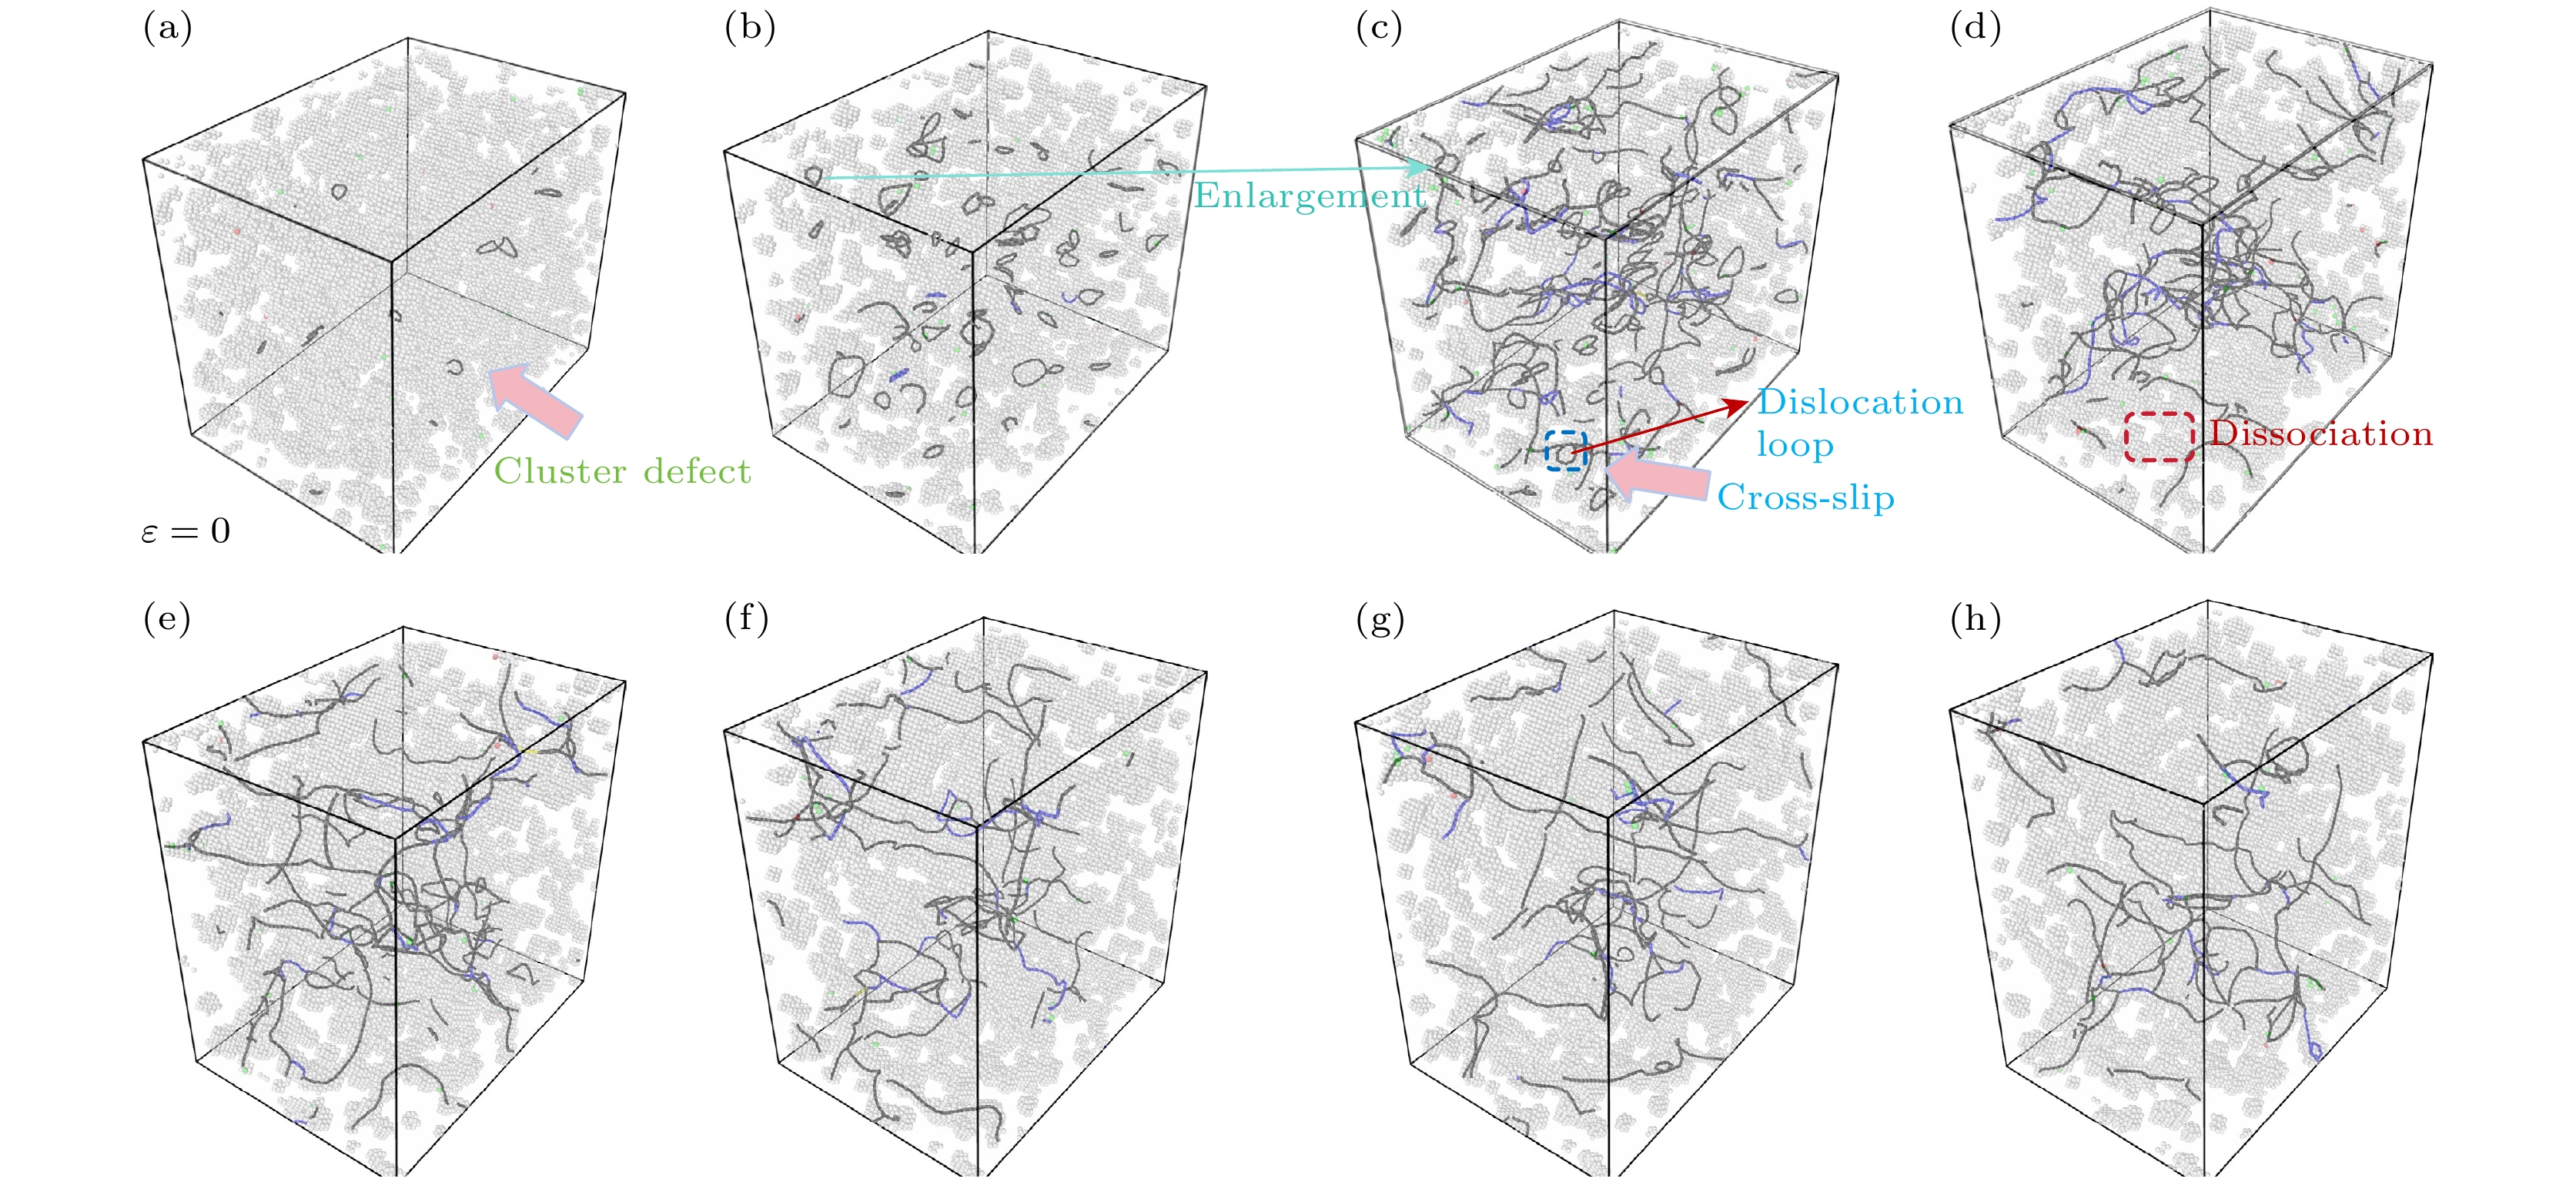
图 11 NHe = 1.5%单晶铁在拉伸过程中的原子构型演化 (a) ε = 0; (b) ε = 0.024; (c) ε = 0.06; (d) ε = 0.096; (e) ε = 0.126; (f) ε = 0.15; (g) ε = 0.174; (h) ε = 0.21
Figure 11. Atomic configuration evolution of single-crystal iron with 1.5% helium concentration during tensile deformation: (a) ε = 0; (b) ε = 0.024; (c) ε = 0.06; (d) ε = 0.096; (e) ε = 0.126; (f) ε = 0.15; (g) ε = 0.174; (h) ε = 0.21.
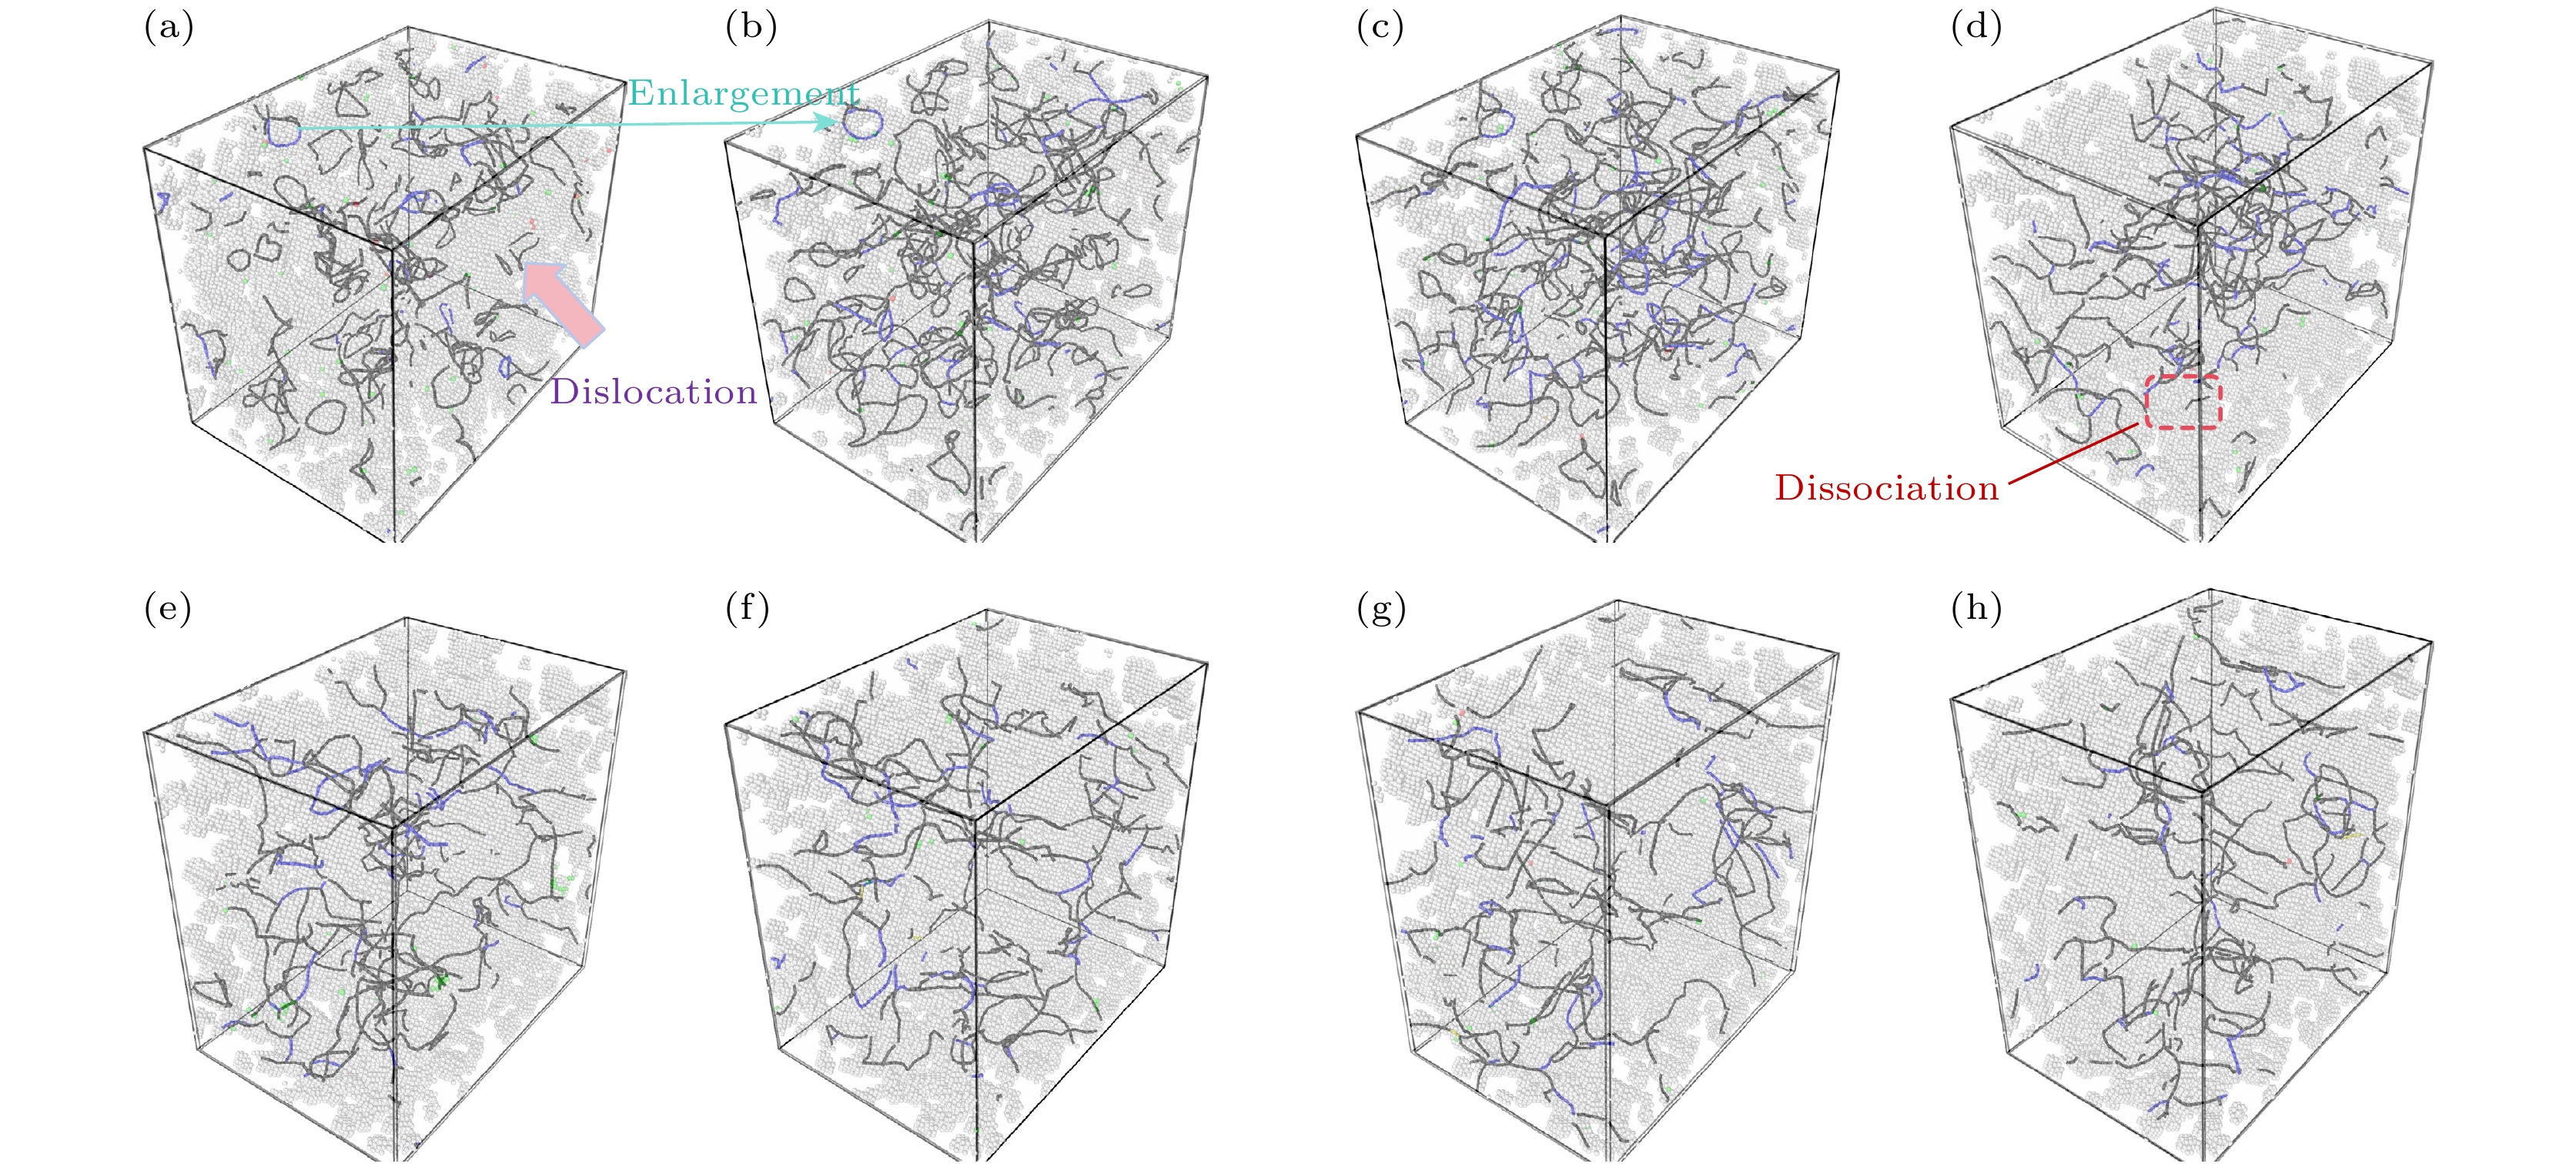
图 12 NHe = 3.0%单晶铁在拉伸过程中的原子构型演化 (a) ε = 0; (b) ε = 0.012; (c) ε = 0.03; (d) ε = 0.072; (e) ε = 0.12; (f) ε = 0.135; (g) ε = 0.18; (h) ε = 0.21
Figure 12. Atomic configuration evolution of single-crystal iron with 3.0% helium concentration during tensile deformation: (a) ε = 0; (b) ε = 0.012; (c) ε = 0.03; (d) ε = 0.072; (e) ε = 0.12; (f) ε = 0.135; (g) ε = 0.18; (h) ε = 0.21.
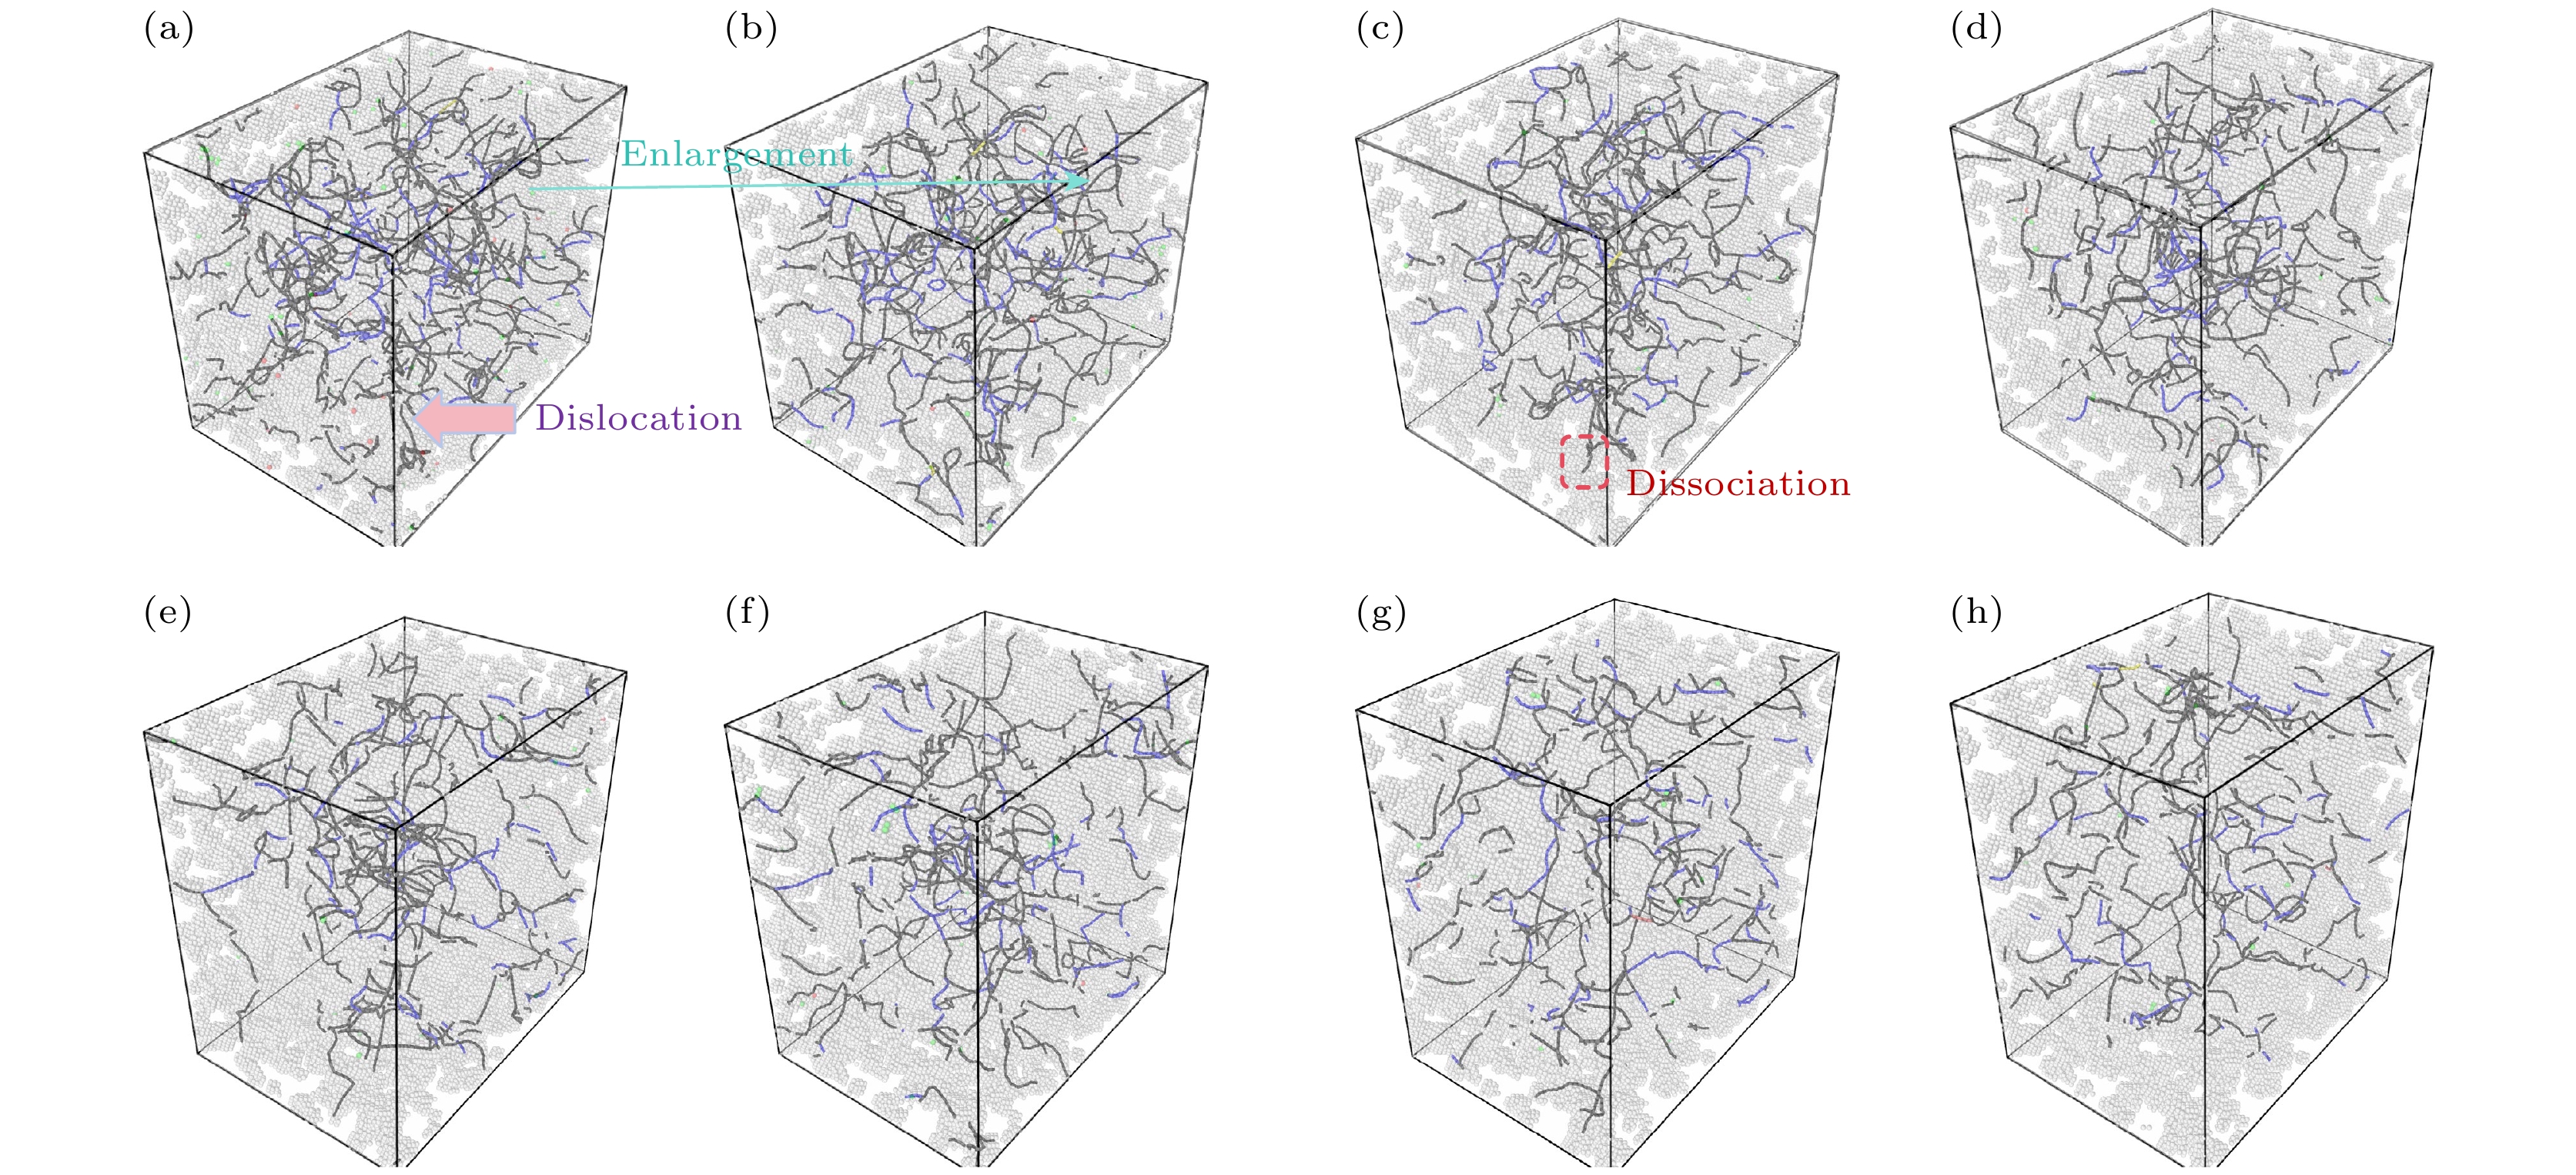
图 13 NHe = 4.5%单晶铁在拉伸过程中的原子构型演化 (a) ε = 0; (b) ε = 0.012; (c) ε = 0.03; (d) ε = 0.075; (e) ε = 0.126; (f) ε = 0.144; (g) ε = 0.189; (h) ε = 0.210
Figure 13. Atomic configuration evolution of single-crystal iron with 4.5% helium concentration during tensile deformation: (a) ε = 0; (b) ε = 0.012; (c) ε = 0.03; (d) ε = 0.075; (e) ε = 0.126; (f) ε = 0.144; (g) ε = 0.189; (h) ε = 0.210.
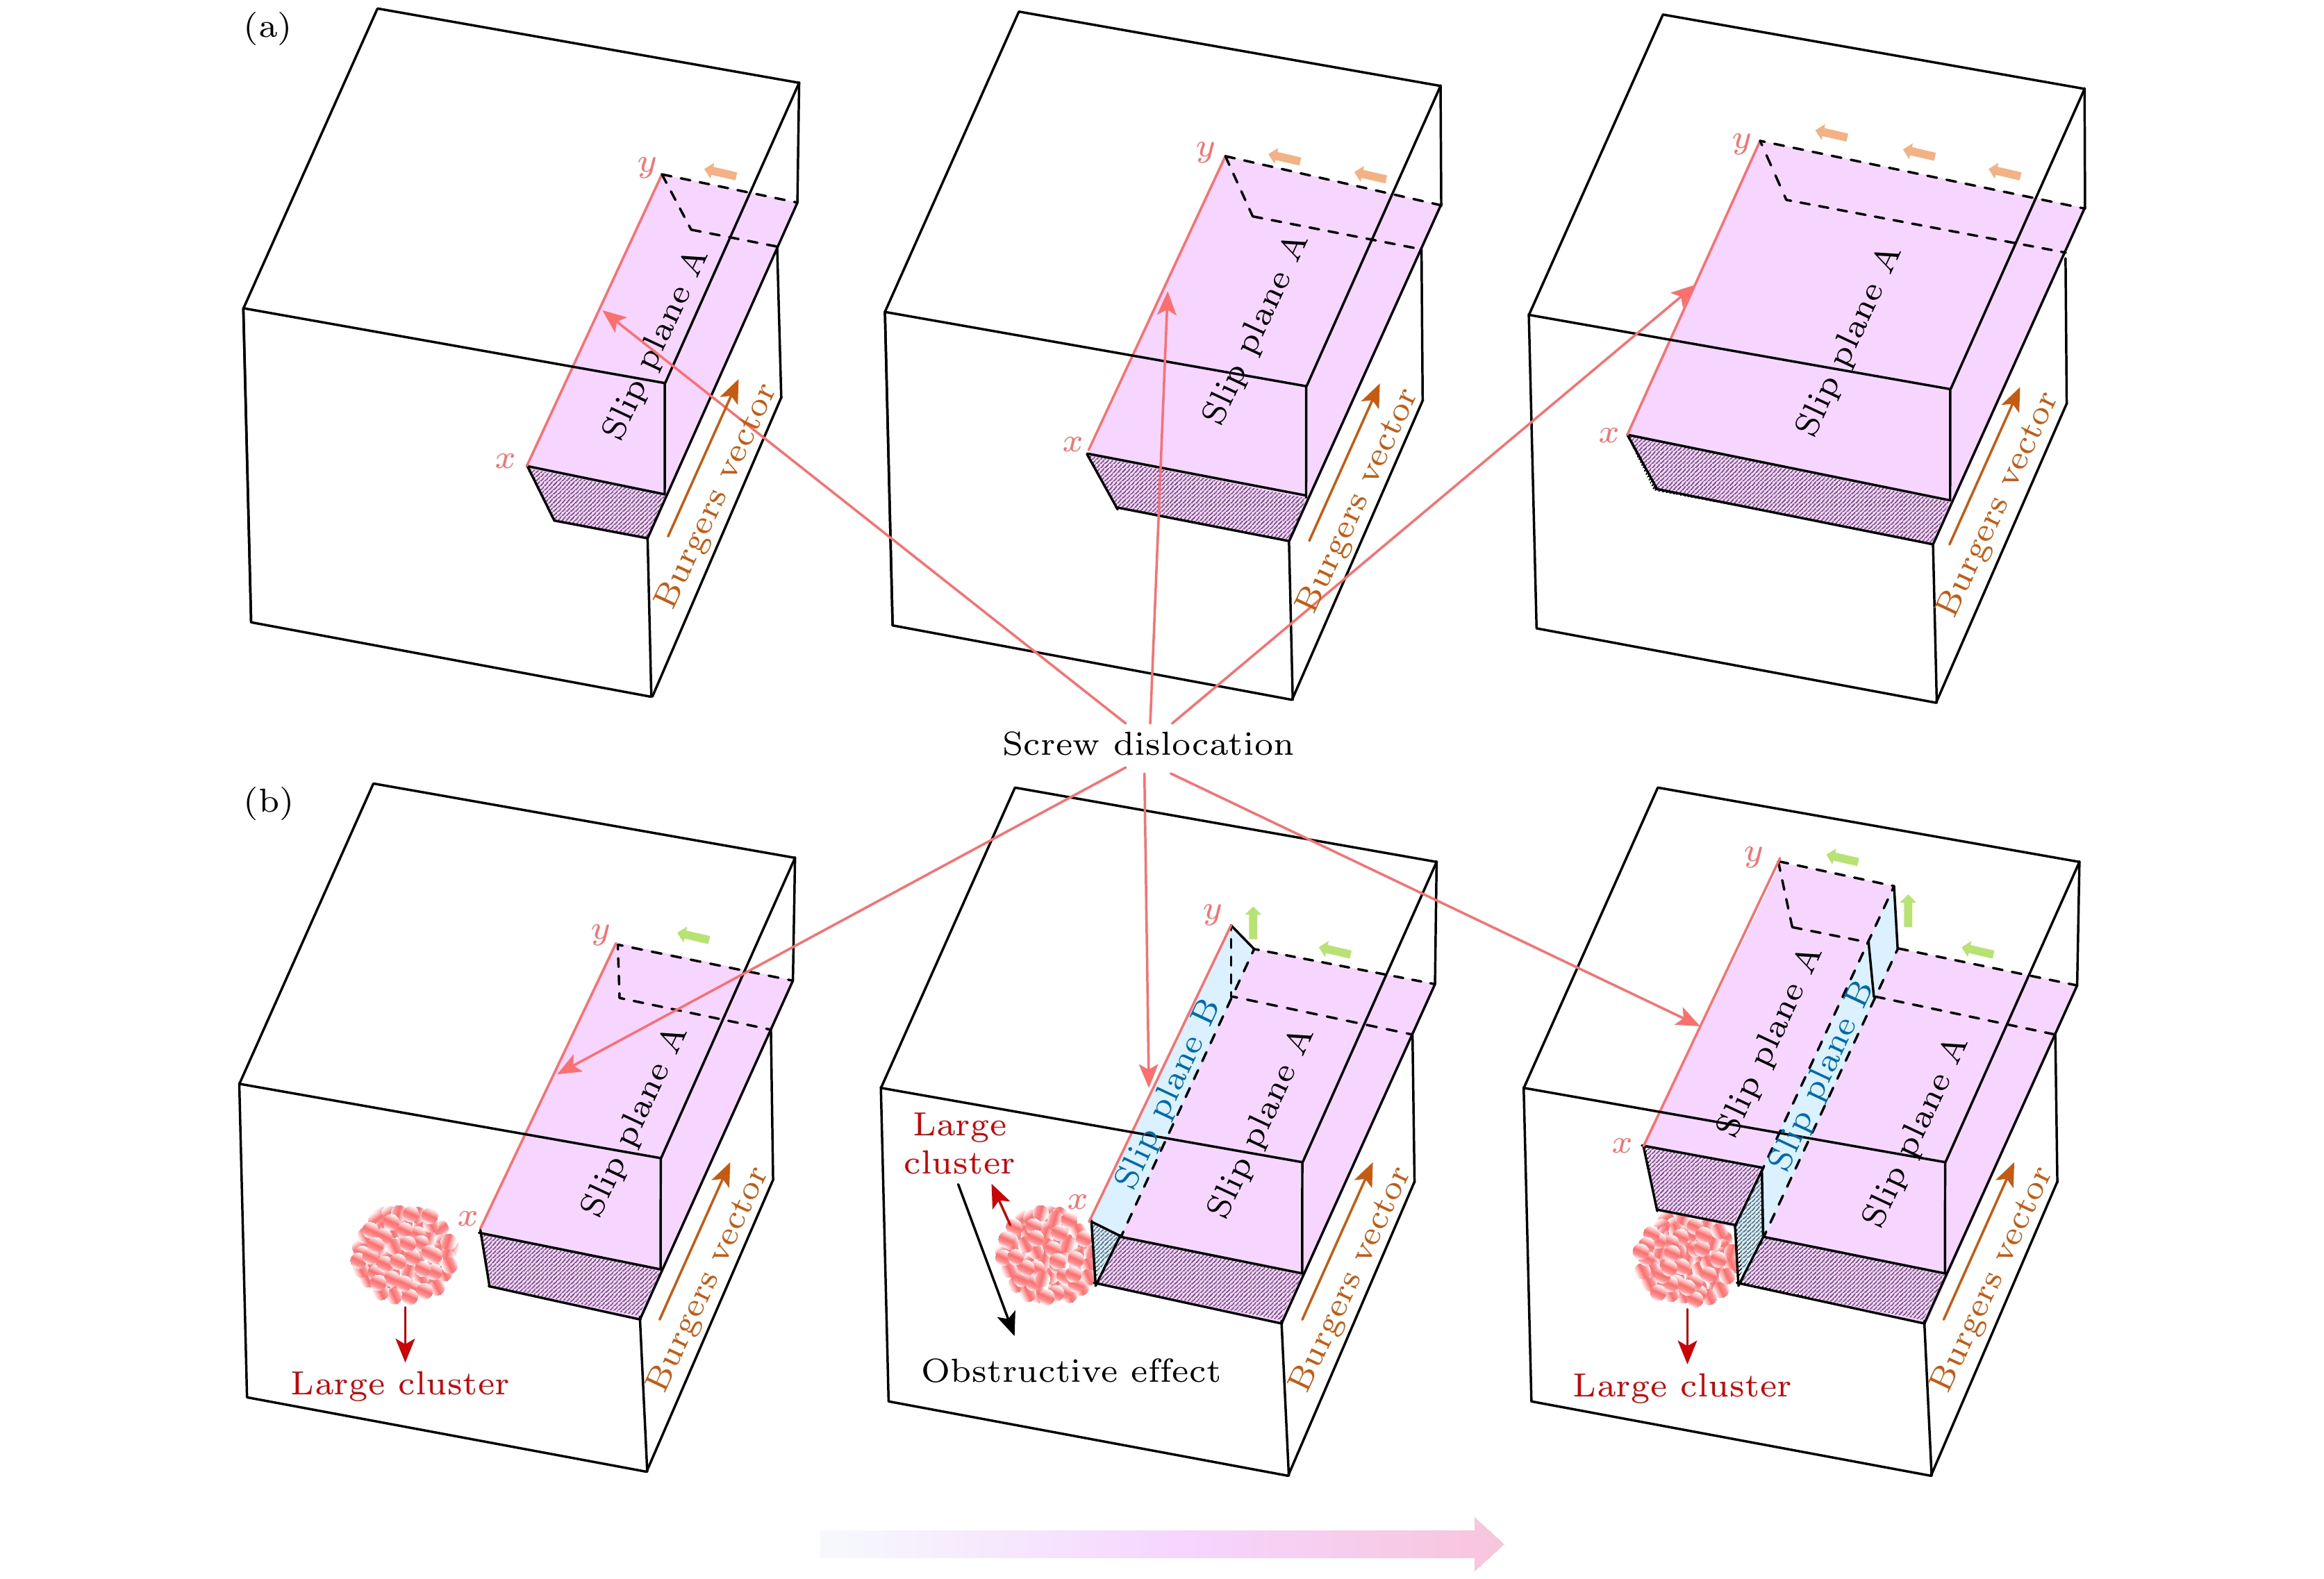
图 14 氦致塑性影响微观机制示意图 (a) NHe < 3.0%; (b) NHe ≥ 3.0%
Figure 14. Schematic of micro-mechanisms for helium-induced plasticity: (a) NHe < 3.0%; (b) NHe ≥ 3.0%.
-
[1] Xie X Y, Mao C L, Liu C X, Luo J T, Liu Y C 2025 Int. J. Plast. 188 104313
 Google Scholar
[2] Yu M, Liu X K, Liu H Z, Jin S X, Xiong Y, Guo L P, Zhang W P 2025 Radiat. Phys. Chem. 237 113035
Google Scholar
[3] Zhou H B, Wang J L, Jiang W, Lu G H, Aguiar J A, Liu F 2016 Acta Mater. 119 1
Google Scholar
[4] Yamamoto T, Odette G R, Miao P, Edwards D J, Kurtz R J 2009 J. Nucl. Mater. 386-388 338
[5] Wang Y X, Xu Q, Yoshiie T, Pan Z Y 2008 J. Nucl. Mater. 376 133
Google Scholar
[6] Hetherly J, Martinez E, Di Z F, Nastasi M, Caro A 2012 Scr. Mater. 66 17
Google Scholar
[7] Han W Z, Demkowicz M J, Fu E G, Wang Y Q 2012 Misra A Acta Mater. 60 6341
Google Scholar
[8] Ullmaier H 1984 Nucl. Fusion 24 1039
Google Scholar
[9] Xia L D, Liu W B, Liu H P, Zhang J H, Chen H, Yang Z G, Zhang C 2018 Nucl. Eng. Technol. 50 132
Google Scholar
[10] Wei Y P, Liu P P, Zhu Y M, Wang Z Q, Wan F R, Zhan Q 2016 J. Alloys Compd. 676 481
Google Scholar
[11] Yang Z, Yang J Y, Liao Q, Xu S, Li B S 2021 Chin. Phys. B 30 056517
[12] 郭洪燕, 夏敏, 燕青芝, 郭立平, 陈济红, 葛昌纯 2016 物理学报 65 077803
Google Scholar
Guo H Y, Xia M, Yan Q Z, Guo L P, Chen J H, Ge C C 2016 Acta Phys. Sin. 65 077803
Google Scholar
[13] Agarwal S, Bhattacharya A, Trocellier P, Zinkle S J 2019 Acta Mater. 163 14
Google Scholar
[14] Harrison R W, Greaves G, Hinks J A, Donnelly S E 2017 J. Nucl. Mater. 495 492
Google Scholar
[15] Morishita K, Sugano R, Wirth B D 2003 J. Nucl. Mater. 323 243
Google Scholar
[16] Tschopp M, Gao F, Solanki K 2016 Acta Mater. 124 544
[17] Zhou Y L, Wang J, Hou Q, Deng A H 2014 J. Nucl. Mater. 446 49
Google Scholar
[18] 陈敏, 汪俊, 侯氢 2009 物理学报 58 1149
Google Scholar
Chen M, Wang J, Hou Q 2009 Acta Phys. Sin. 58 1149
Google Scholar
[19] Kobayashi R, Hattori T, Tamura T, Ogata S 2015 J. Nucl. Mater. 463 1071
Google Scholar
[20] Galloway G J, Ackland G J 2013 Phys. Rev. B 87 104106
Google Scholar
[21] Yu J N, Yu G, Yao Z W, Schäublin R 2007 J. Nucl. Mater. 367–370 462
[22] Lucas G, Schäublin R 2008 J. Phys. Condens. Matter 20 415206
Google Scholar
[23] Hu N W, Deng H Q, Xiao S F, Hu W Y 2013 Nucl. Instrum. Methods Phys. Res. Sect. B 303 72
Google Scholar
[24] Hu N W, Deng H Q, Wang C L, Hu W Y 2016 RSC Adv. 6 27113
Google Scholar
[25] Yang L, Deng H Q, Gao F, Heinisch H L, Kurtz R J, Hu S Y, Li Y L, Zu X T 2013 Nucl. Instrum. Methods Phys. Res. Sect. B 303 68
Google Scholar
[26] Gao C, Tian D F, Li M S, Qian D Z 2018 Nucl. Instrum. Methods Phys. Res. Sect. B 418 46
Google Scholar
[27] Chen Y T, Morishita K 2022 Nucl. Mater. Energy 30 101150
Google Scholar
[28] Yang Y S, Wang L S 2022 Int. J. Hydrogen Energy 47 24398
Google Scholar
[29] Plimpton S 1995 J. Comput. Phys. 117 1
Google Scholar
[30] Martínez E, Schwen D, Caro A 2015 Acta Mater. 84 208
Google Scholar
[31] Caro A, Hetherly J, Stukowski A, Caro M, Martínez E, Srivilliputhur S, Zepeda-Ruiz L, Nastasi M 2011 J. Nucl. Mater. 418 261
Google Scholar
[32] Wang L S, Yan S L, Meng M, Xue K M, Li P 2022 J. Nucl. Mater. 567 153818
Google Scholar
[33] Anento N, Serra A 2020 Comput. Mater. Sci. 179 109679
Google Scholar
[34] Li P, Wang L S, Yan S L, Meng M, Zhou Y F, Xue K M 2021 Int. J. Refract. Met. Hard Mater. 94 105376
Google Scholar
[35] Hoover W G 1985 Phys. Rev. A 31 1695
Google Scholar
[36] Hoover W G 1986 Phys. Rev. A 34 2499
Google Scholar
[37] Gibson J B, Goland A N, Milgram M, Vineyard G H 1960 Phys. Rev. 120 1229
Google Scholar
[38] Nordlund K, Ghaly M, Averback R S, Caturla M, Diaz de la Rubia T, Tarus J 1998 Phys. Rev. B 57 7556
Google Scholar
[39] Barrett C D, Tschopp M A, El Kadiri H 2012 Scr. Mater. 66 666
Google Scholar
[40] Stukowski A 2010 Modelling Simul. Mater. Sci. Eng. 18 015012
Google Scholar
[41] Honeycutt J D, Andersen H C 1987 J. Phys. Chem. 91 4950
Google Scholar
[42] Stukowski A 2012 Modelling Simul. Mater. Sci. Eng. 20 045021
Google Scholar
[43] Stukowski A, Albe K 2010 Modelling Simul. Mater. Sci. Eng. 18 085001
Google Scholar
[44] Stukowski A, Bulatov V V, Arsenlis A 2012 Modelling Simul. Mater. Sci. Eng. 20 085007
Google Scholar

 DownLoad:
Metrics
- Abstract views: 179
- PDF Downloads: 1
- Cited By: 0
