


-
为了提出性能优异的图像质量评价(IQA)模型, 本文基于人类视觉感知特性和图像的灰度梯度、局部对比度和清晰度特征, 提出了一种基于图像内容对比感知的IQA方法. 在该方法中, 首先结合视觉感知特性, 基于物理学中对比度定义, 提出一种图像质量定义及其值计算方法; 之后, 基于灰度梯度共生矩阵, 提出一种图像灰度梯度熵的概念及其值的计算方法, 并基于图像灰度梯度熵、局部对比度和清晰度, 提出一种图像内容及其视觉感知的描述方法; 最后, 基于图像内容特征和图像质量定义, 综合分析, 提出IQA方法及其数学模型. 并且采用5个开源图像数据库中的119幅参考图像和6395幅失真图像对其进行了仿真测试, 同时分析和探讨了52种失真类型对IQA的影响; 另外, 为了说明所提IQA模型的优势, 将其与现有的7个典型IQA模型, 从精度、复杂性和泛化性能上进行了对比分析. 实验结果表明, 所提IQA模型的精度PLCC值在5个数据库中最低可以实现0.8616, 最高可达到0.9622, 其性能综合效益优于7个现有IQA模型. 研究结果表明, 所提IQA方法是有效的、可行的, 所提IQA模型是一个性能优异的IQA模型.Image quality assessment (IQA) plays a very important role in acquiring, storing, transmitting and processing image and video. Using the characteristics of human visual perception and the features of the gray, gradient, local contrast, and blurring of image, an IQA method based on the image content contrast perception is proposed in the paper, which is called MPCC. In the proposed method, firstly, combining with the characteristics of human visual perception, based on the definition of the contrast in physics, a novel definition for image quality and its calculation method are proposed. Then, based on the gray gradient co-occurrence matrix, a novel concept, namely the gray-gradient entropy of image, and its calculation method, are proposed. And based on the gray-gradient entropy, local contrast and blurring of image, a method of describing the image content and their visual perception are proposed. Finally, based on the image content features and the image quality definition, an IQA method and its mathematical model are proposed by comprehensive analysis. Further, the proposed IQA model MPCC is tested by using 119 reference images and 6395 distorted images from the five open image databases (LIVE, CSIQ, TID2008, TID2013 and IVC). Moreover, the influences of the 52 distortion types on IQA are analyzed. In addition, in order to illustrate the advantages of the MPCC model, it is compared with the seven existing typical IQA models in terms of the accuracy, complexity and generalization performance of model. The experimental results show that the accuracy PLCC of the MPCC model can achieve 0.8616 at lowest and 0.9622 at most in the five databases; among the 52 distortion types, the two distortion types, namely the change of color saturation and the local block-wise distortions of different intensity, have the greatest influence on IQA, and the accuracy PLCC values of the seven existing IQA models are almost all below 0.6, but the PLCC of the MPCC model can reach more than 0.68; and the comprehensive benefit of the performance of the MPCC model is better than those of the seven existing IQA models. These results of test and comparison above show that the proposed IQA method is effective and feasible, and the corresponding model has an excellent performance.
-
Keywords:
- image quality assessment /
- human visual perception characteristic /
- image content /
- contrast
[1] Nightingale J, Salva P, Alcarazcalero J M, Wang Q 2018 IEEE Trans. Broadcast. 64 621
 Google Scholar
[2] 丰卉, 孙彪, 马书根 2017 物理学报 66 180202
Google Scholar
Feng H, Sun B, Ma S G 2017 Acta Phys. Sin. 66 180202
Google Scholar
[3] Yao J C, Liu G Z 2019 IEEE Trans. Broadcast. 65 546
Google Scholar
[4] Chandler D M, Hemami S S 2007 IEEE Trans. Image Process. 16 2284
Google Scholar
[5] Wang Z, Bovik A C, Sheikh H R, Simoncelli E P 2004 IEEE Trans. Image Process. 13 600
[6] Zhang L, Zhang L, Mou X, Zhang D 2011 IEEE Trans. Image Process. 20 2378
Google Scholar
[7] Xue W, Zhang L, Mou X, Bovik A C 2014 IEEE Trans. Image Process. 23 684
Google Scholar
[8] Zhang L, Shen Y, Li H 2014 IEEE Trans. Image Process. 23 4270
Google Scholar
[9] Larson E C, Chandler D M 2010 J. Electron. Imaging 19 011006
Google Scholar
[10] Fang Y M, Yan J B, Li L D, Wu J J, Lin W S 2018 IEEE Trans. Image Process. 27 1600
Google Scholar
[11] 方志明, 崔荣一, 金璟璇 2017 物理学报 66 109501
Google Scholar
Fang Z M, Cui R Y, Jin J X 2017 Acta Phys. Sin. 66 109501
Google Scholar
[12] Qi H, Jiao S H, Lin W S, Tang L, Shen W H 2014 Electron. Lett. 50 1435
[13] Zheng L, Shen L, Chen J, An P, Luo J 2019 IEEE Trans. Multimedia 21 2057
Google Scholar
[14] Yang X, Wang T, Ji G 2020 IET Image Proc. 14 384
Google Scholar
[15] Ahar A, Barri A, Schelkens P 2018 IEEE Trans. Image Process. 27 879
Google Scholar
[16] Zhou W J, Yu L, Zhou Y, Qiu W W, Wu M W 2018 IEEE Trans. Image Process. 27 2086
[17] Yao J C, Liu G Z 2018 IET Image Proc. 12 872
Google Scholar
[18] Wang X, Meng F, Huang X Y 2018 Proceeding of the 11 th International Congress on Image and Signal Processing, BioMedical Engineering and Informatics (CISP-BMEI) Beijing, China, October 13—15, 2018 p1
[19] Ginesu G, Massidda F, Giusto D D 2006 Signal Process. Image Commun. 21 316
Google Scholar
[20] Nadenau M 2000 Ph. D Dissertation (Lausanne: École Polytechnique Fédérale de Lausanne)
[21] Niu Y Z, Zhang H F, Guo W Z, Ji R R 2018 IEEE Trans. Circuits Syst. Video Technol. 28 849
[22] 王鸿南, 钟文, 汪静, 夏德深 2004 中国图象图形学报 9 828
Google Scholar
Wang H N, Zhong W, Wang J, Xia D S 2004 J. Image Graph. 9 828
Google Scholar
[23] Sheikh H R, Wang Z, Cormack L LIVE Image Quality Assessment Database Release 2 Available: http://live.ece. utexas.edu/research/quality [2019-12-20]
[24] Larson E C, Chandler D M The CSIQ image database http://vision.okstate.edu/?loc=csiq [2019-12-20]
[25] Ponomarenko N, Lukin V, Zelensky A, Egiazarian K, Carli M, Battisti F Tampere Image Database 2008 TID2008, version 1.0 http://www.ponomarenko.info/tid2008.htm [2019-12-20]
[26] Ponomarenko N, Jin L, Ieremeiev O, Lukin V, Egiazarian K, Astola J, Vozel B, Chehdi K, Carli M, Battisti F, Kuo C C J 2015 Signal Process. Image Commun. 30 57
[27] Athar S, Wang Z 2019 IEEE Access 7 140030
Google Scholar
[28] Callet L, Patrick A F Subjective quality assessment IRCCyN /IVC database http://www2.irccyn.ec-nantes.fr/ivcdb/ [2019-12-20]
[29] Yi Z, Chandler D M 2018 IEEE Trans. Image Process. 27 5433
[30] Dai T, Gu K, Niu L, et al. 2018 Neurocomputing 290 185
[31] Zhang C, Cheng W, Hirakawa K 2019 IEEE Trans. Image Process. 28 1732
-

图 2 4个数据库中的图像主客观IQA结果之间的散点图 (a) LIVE; (b) CSIQ; (c) TID2008; (d) TID2013
Fig. 2. Scatter plots between the subjective and objective IQA results of images in four databases: (a) LIVE; (b) CSIQ; (c) TID2008; (d) TID2013
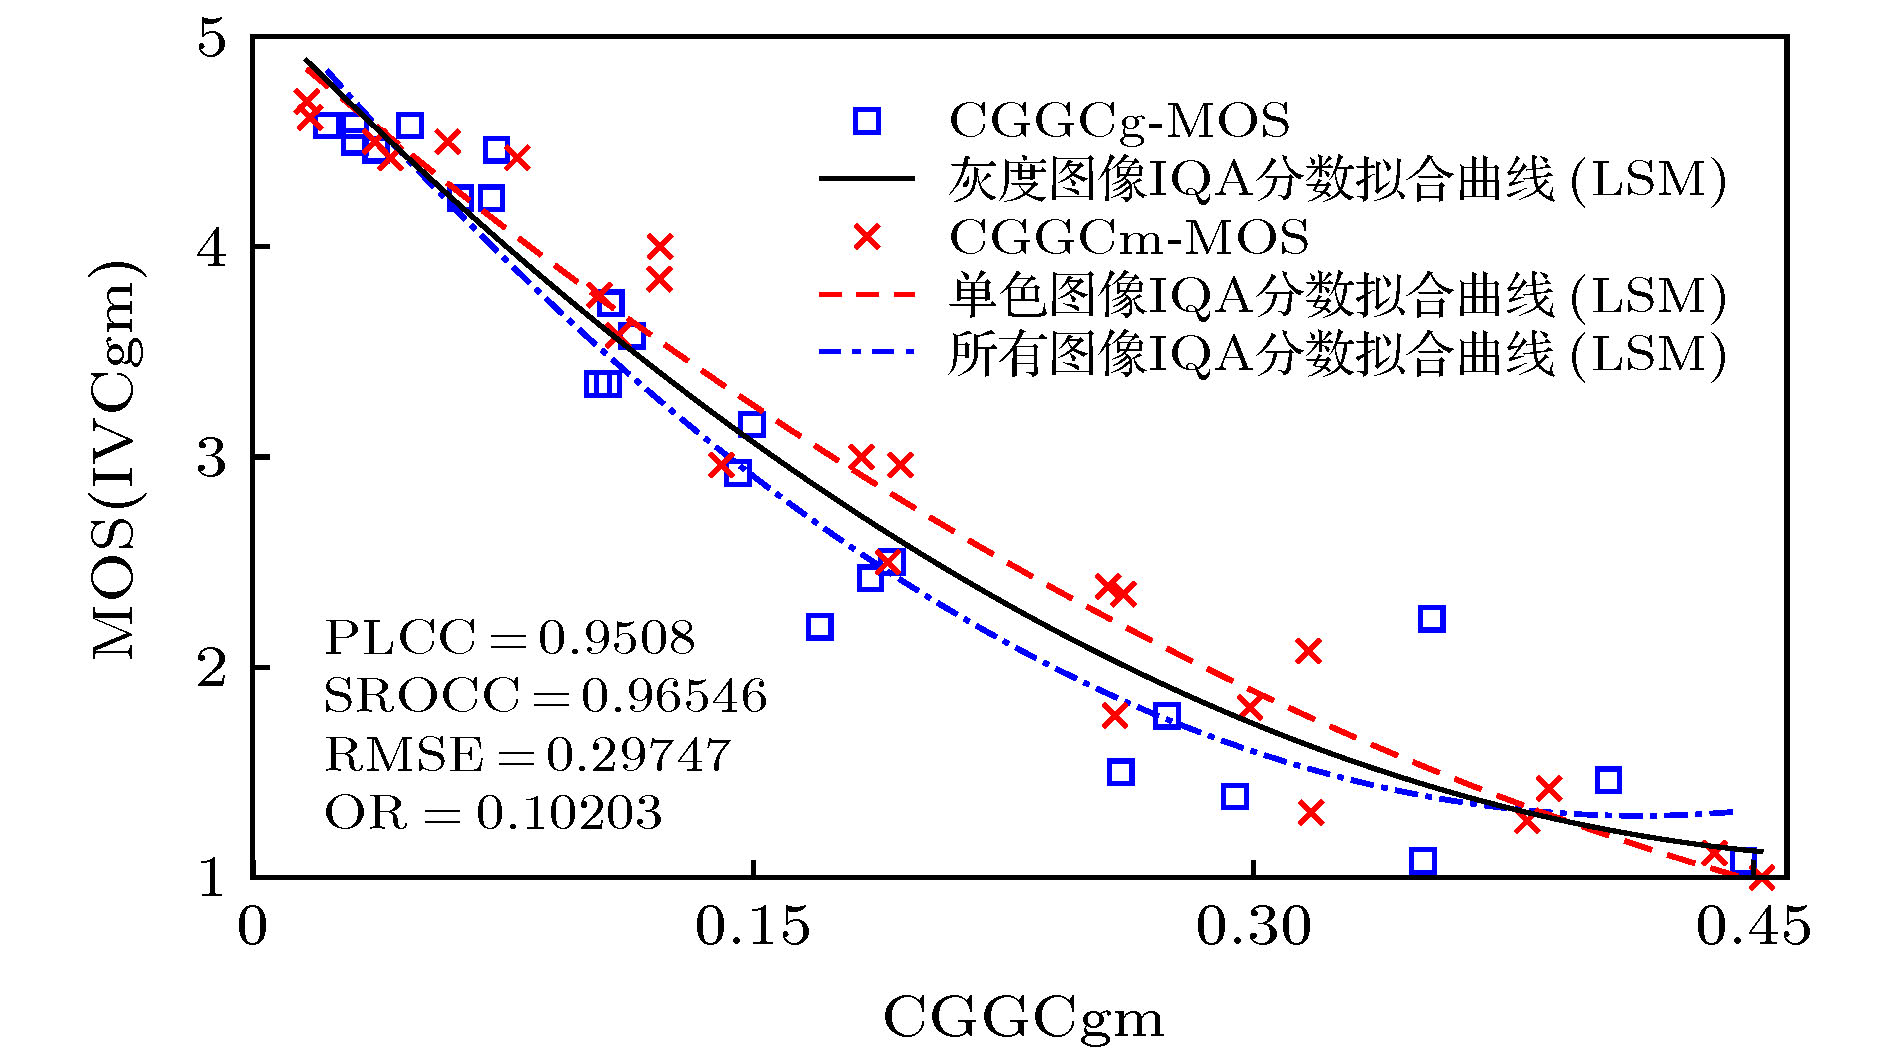
图 3 所提模型对IVC数据库中灰度和单色图像评价结果
Fig. 3. IQA results of the gray and monochrome images in IVC database by the proposed model.
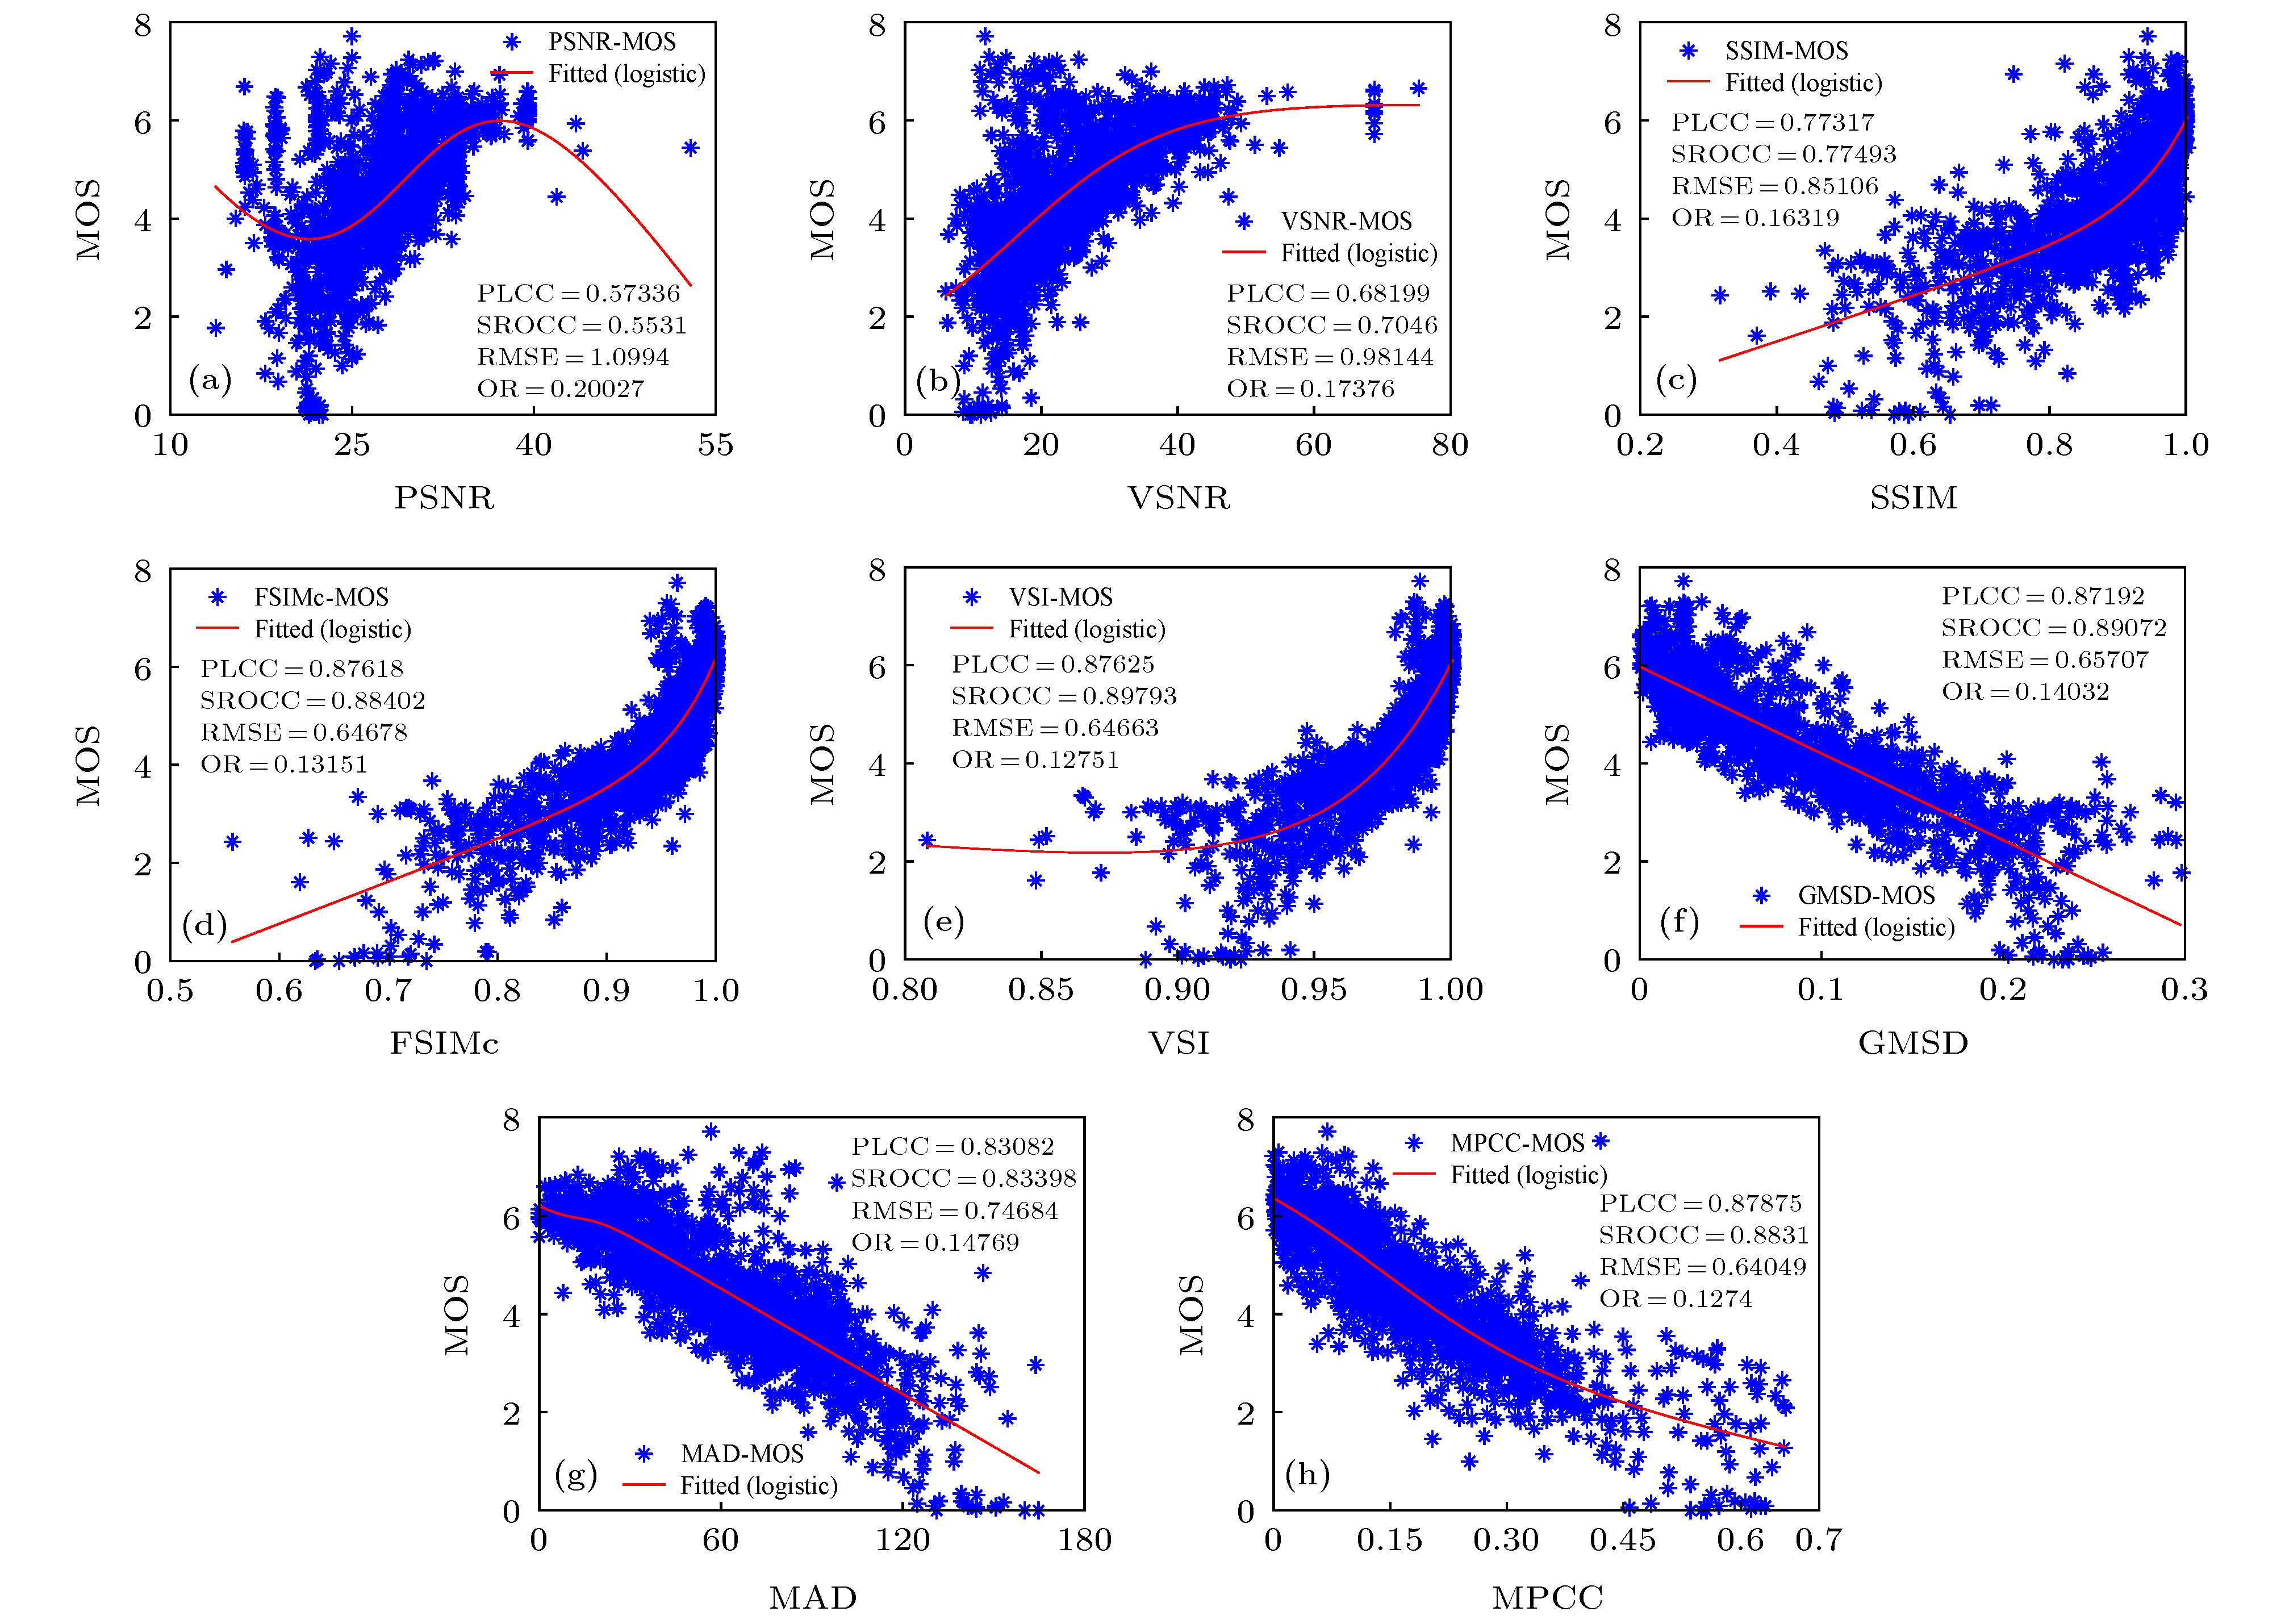
图 4 基于TID2008数据库中的图像IQA结果比较所提模型与现有7个模型的精度 (a) PSNR-TID2008; (b) VSNR-TID2008; (c) SSIM-TID2008; (d) FSIMc-TID2008; (e) VSI-TID2008; (f) GMSD-TID2008; (g) MAD-TID2008; (h) MPCC-TID2008
Fig. 4. Comparing the accuracy of the proposed model with those of the existing 7 models based on the IQA results in TID2008 database: (a) PSNR-TID2008; (b) VSNR-TID2008; (c) SSIM-TID2008; (d) FSIMc-TID2008; (e) VSI-TID2008; (f) GMSD-TID2008; (g) MAD-TID2008; (h) MPCC-TID2008.

图 5 基于平均每10幅图像的评价运行时间比较8个IQA模型的复杂性
Fig. 5. Comparison of the complexity of 8 IQA models based on the IQA running time per 10 images.
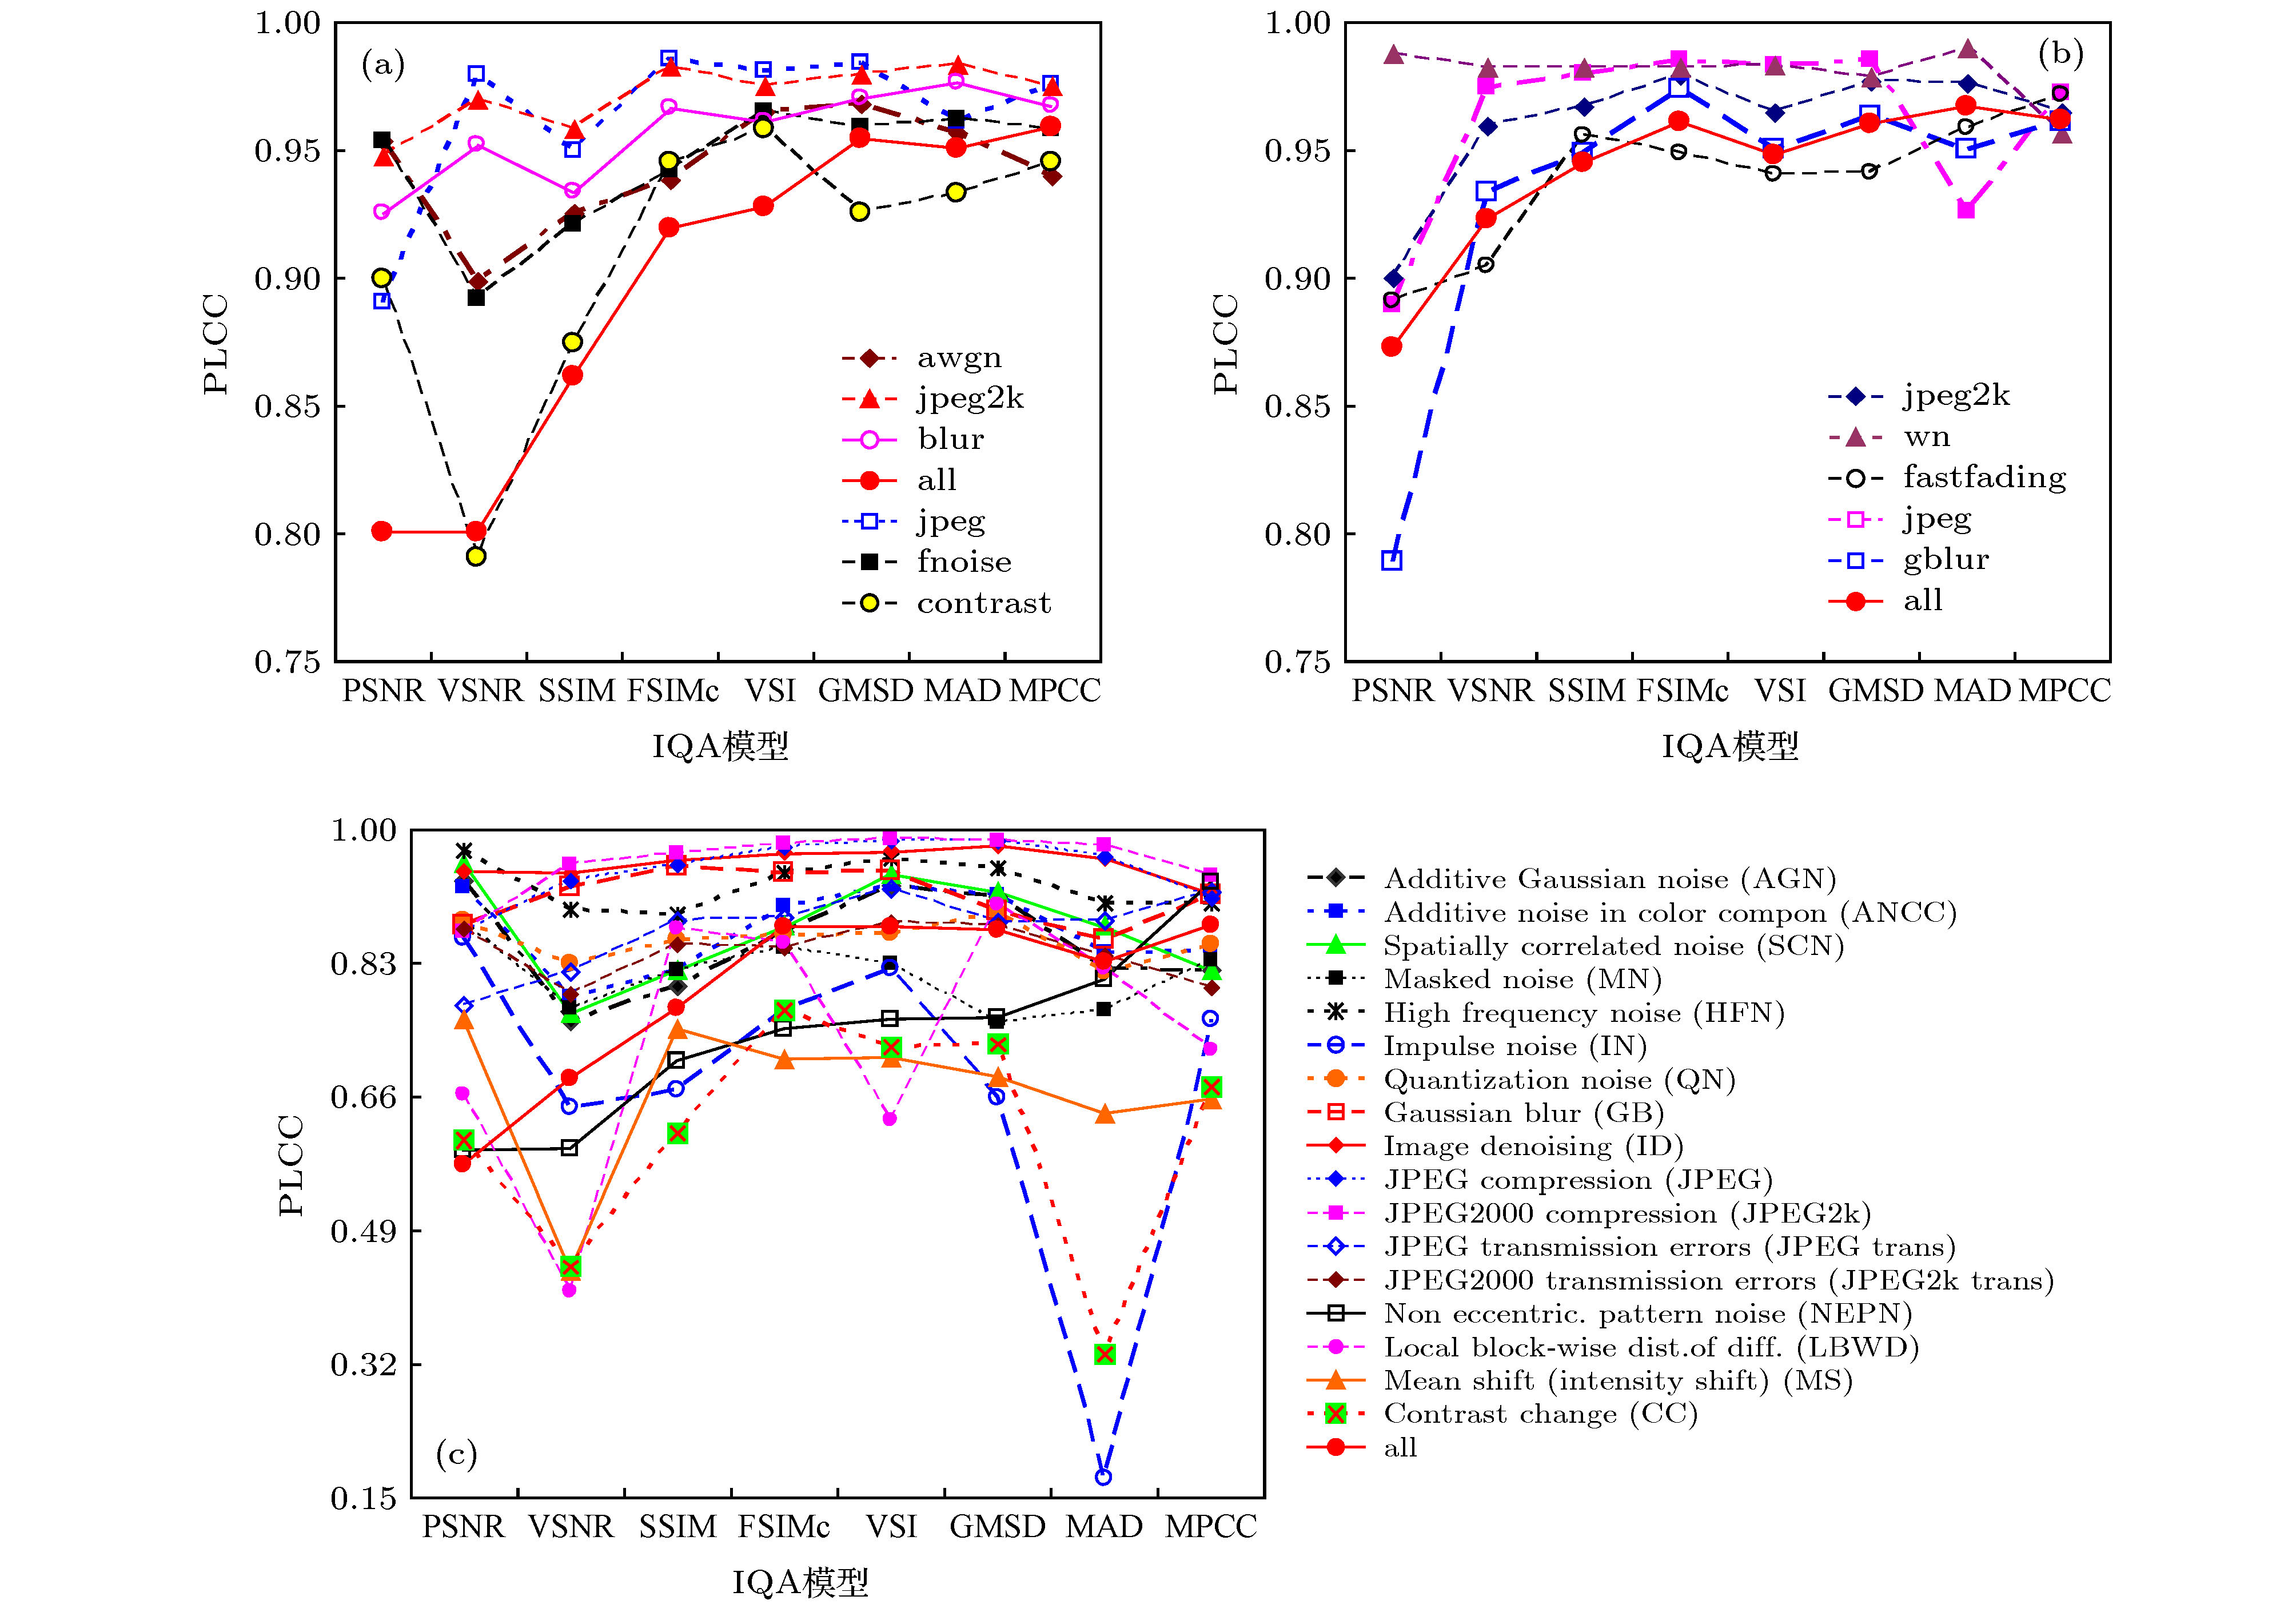
图 6 基于3个数据库中28类失真图像评价结果的PLCC值以8个IQA模型的精度对比 (a) CSIQ; (b) LIVE; (c) TID2008
Fig. 6. Accuracy comparisons among 8 IQA metrics based on PLCC of IQA results from 28 types of distortion images in three databases: (a) CSIQ; (b) LIVE; (c) TID2008.

图 7 所提IQA模型对CSIQ库中6种失真类型的失真图像评价结果的散点图 (a) awgn; (b) jpeg; (c) jpeg2k; (d) fnoise; (e) blur; (f) contrast
Fig. 7. Scatter plots of the IQA results of 6 kinds of distorted images in CSIQ database evaluating by the proposed IQA model: (a) awgn; (b) jpeg; (c) jpeg2k; (d) fnoise; (e) blur; (f) contrast.

图 10 所提IQA模型对TID2013库中24种失真类型的失真图像评价结果的散点图 (a) AGN; (b) NCC; (c) SCN; (d) MN; (e) HFN; (f) IN; (g) QN; (h) GB; (i) ID; (j) JPEG; (k) JPEG2k; (l) JPEGtrans; (m) JPEG2ktrans; (n) NEPN; (o) LBWD; (p) MS; (q) CC; (r) CCS; (s) MGN; (t) CN; (u) LCN; (v) CQWD; (w) CA; (x) SSR
Fig. 10. Scatter plots of the IQA results of 24 kinds of distorted images in TID2013 database evaluating by the proposed IQA model: (a) AGN; (b) NCC; (c) SCN; (d) MN; (e) HFN; (f) IN; (g) QN; (h) GB; (i) ID; (j) JPEG; (k) JPEG2k; (l) JPEGtrans; (m) JPEG2ktrans; (n) NEPN; (o) LBWD; (p) MS; (q) CC; (r) CCS; (s) MGN; (t) CN; (u) LCN; (v) CQWD; (w) CA; (x) SSR.
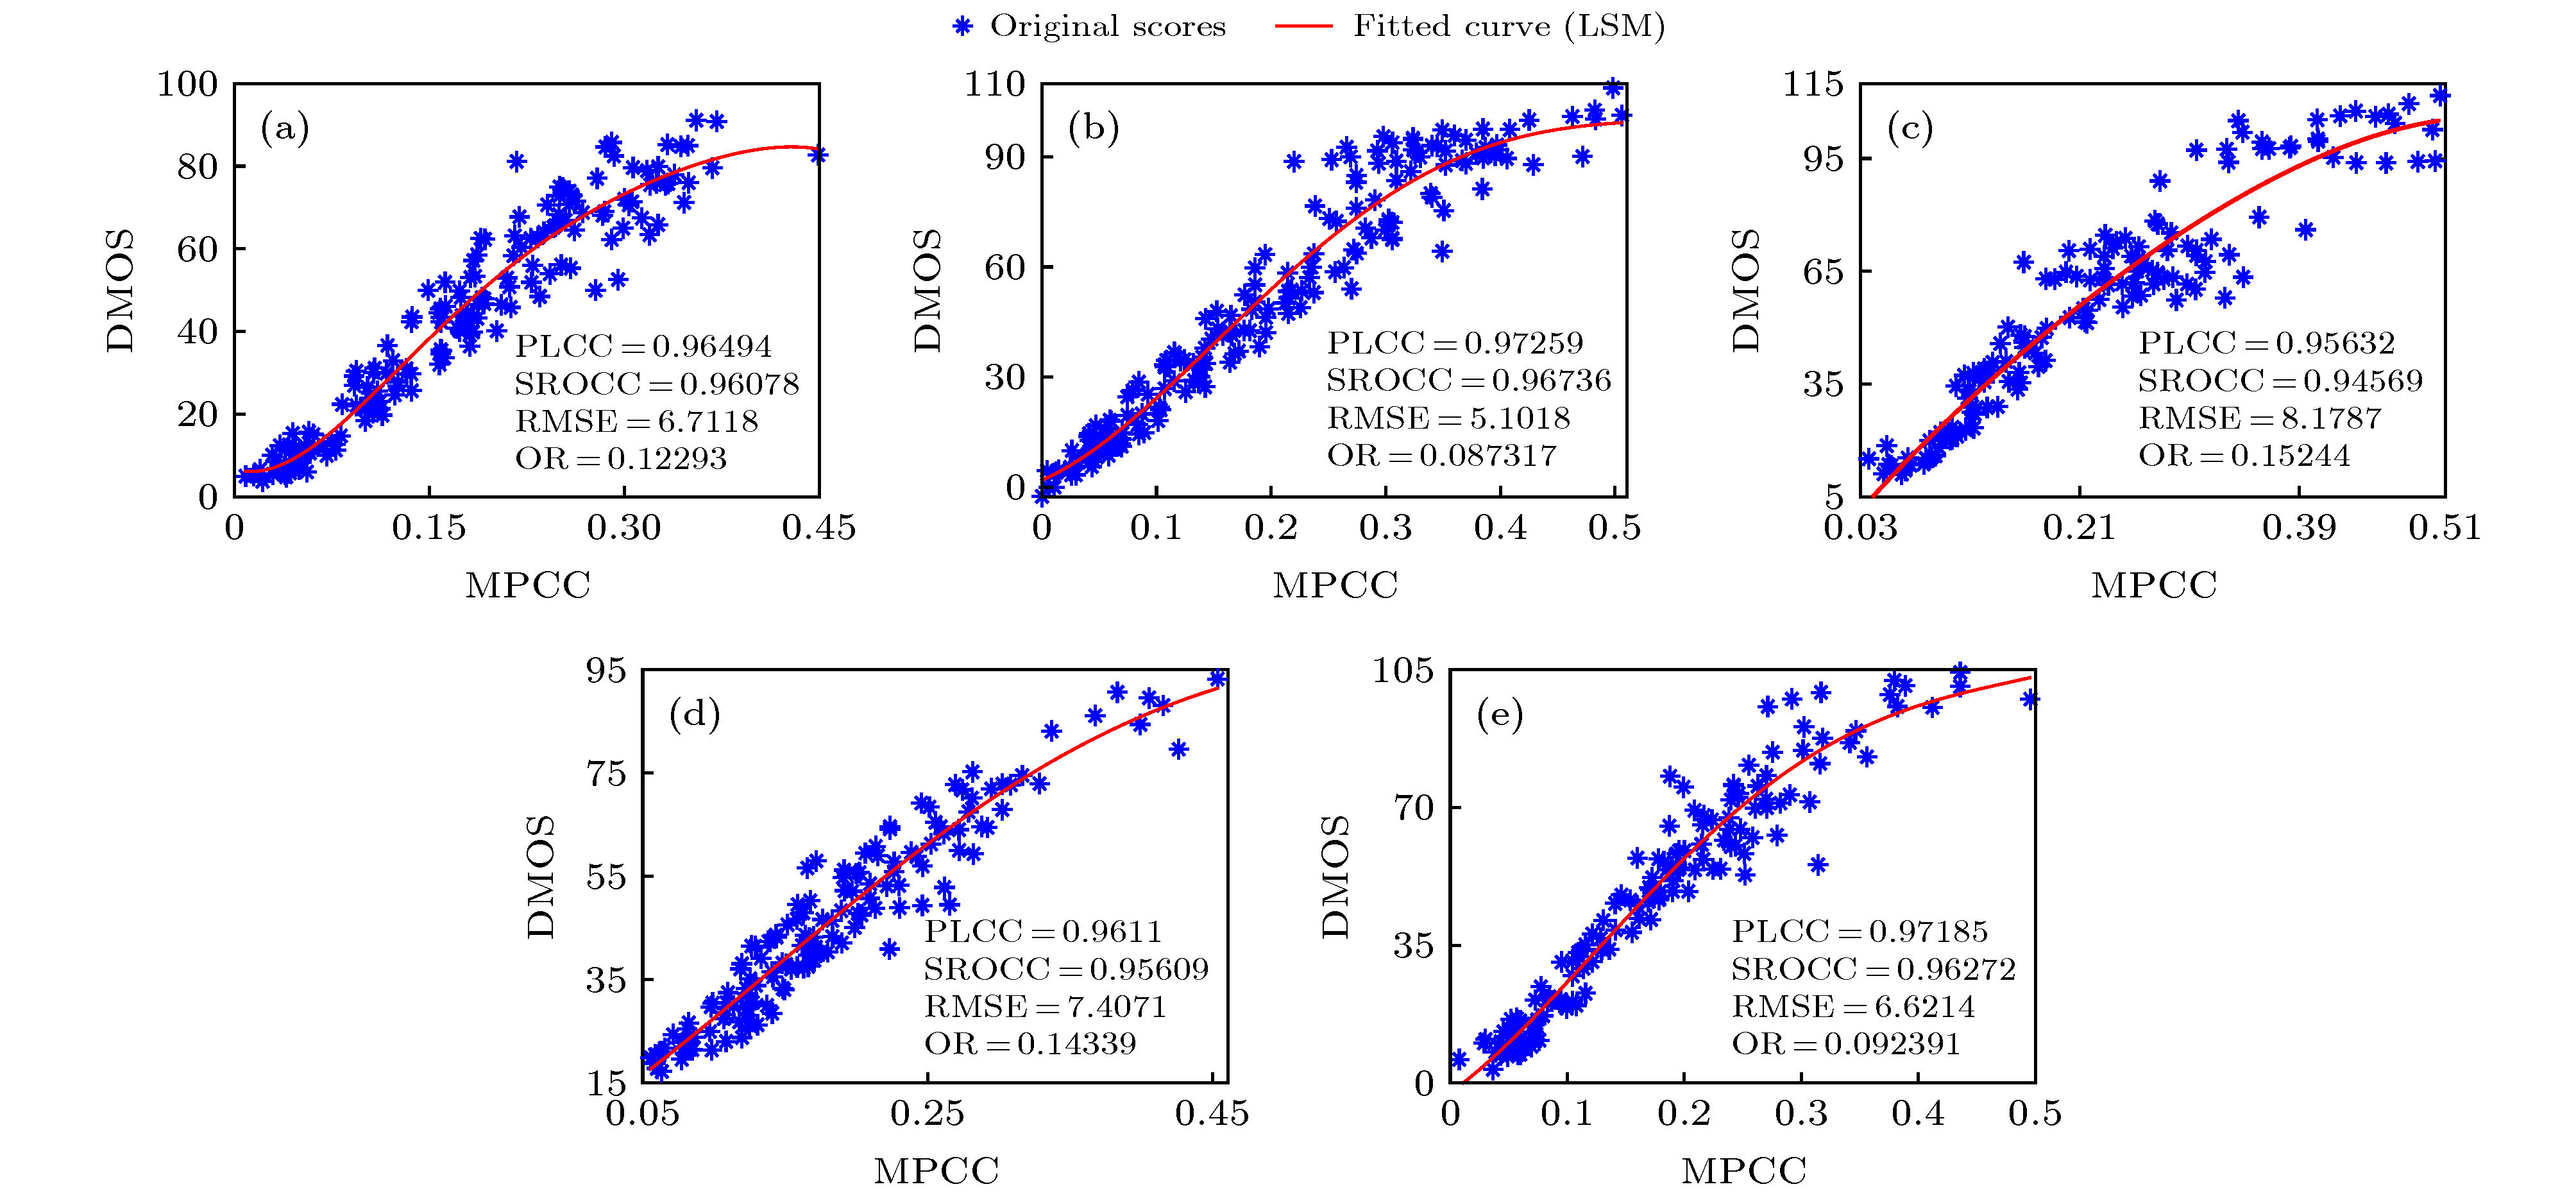
图 8 所提IQA模型对LIVE库中5种失真类型的失真图像评价结果的散点图 (a) jpeg2k; (b) jpeg; (c) WN; (d) gblur; (e) fastfading
Fig. 8. Scatter plots of the IQA results of 5 kinds of distorted images in LIVE database evaluating by the proposed IQA model: (a) jpeg2k; (b) jpeg; (c) WN; (d) gblur; (e) fastfading.
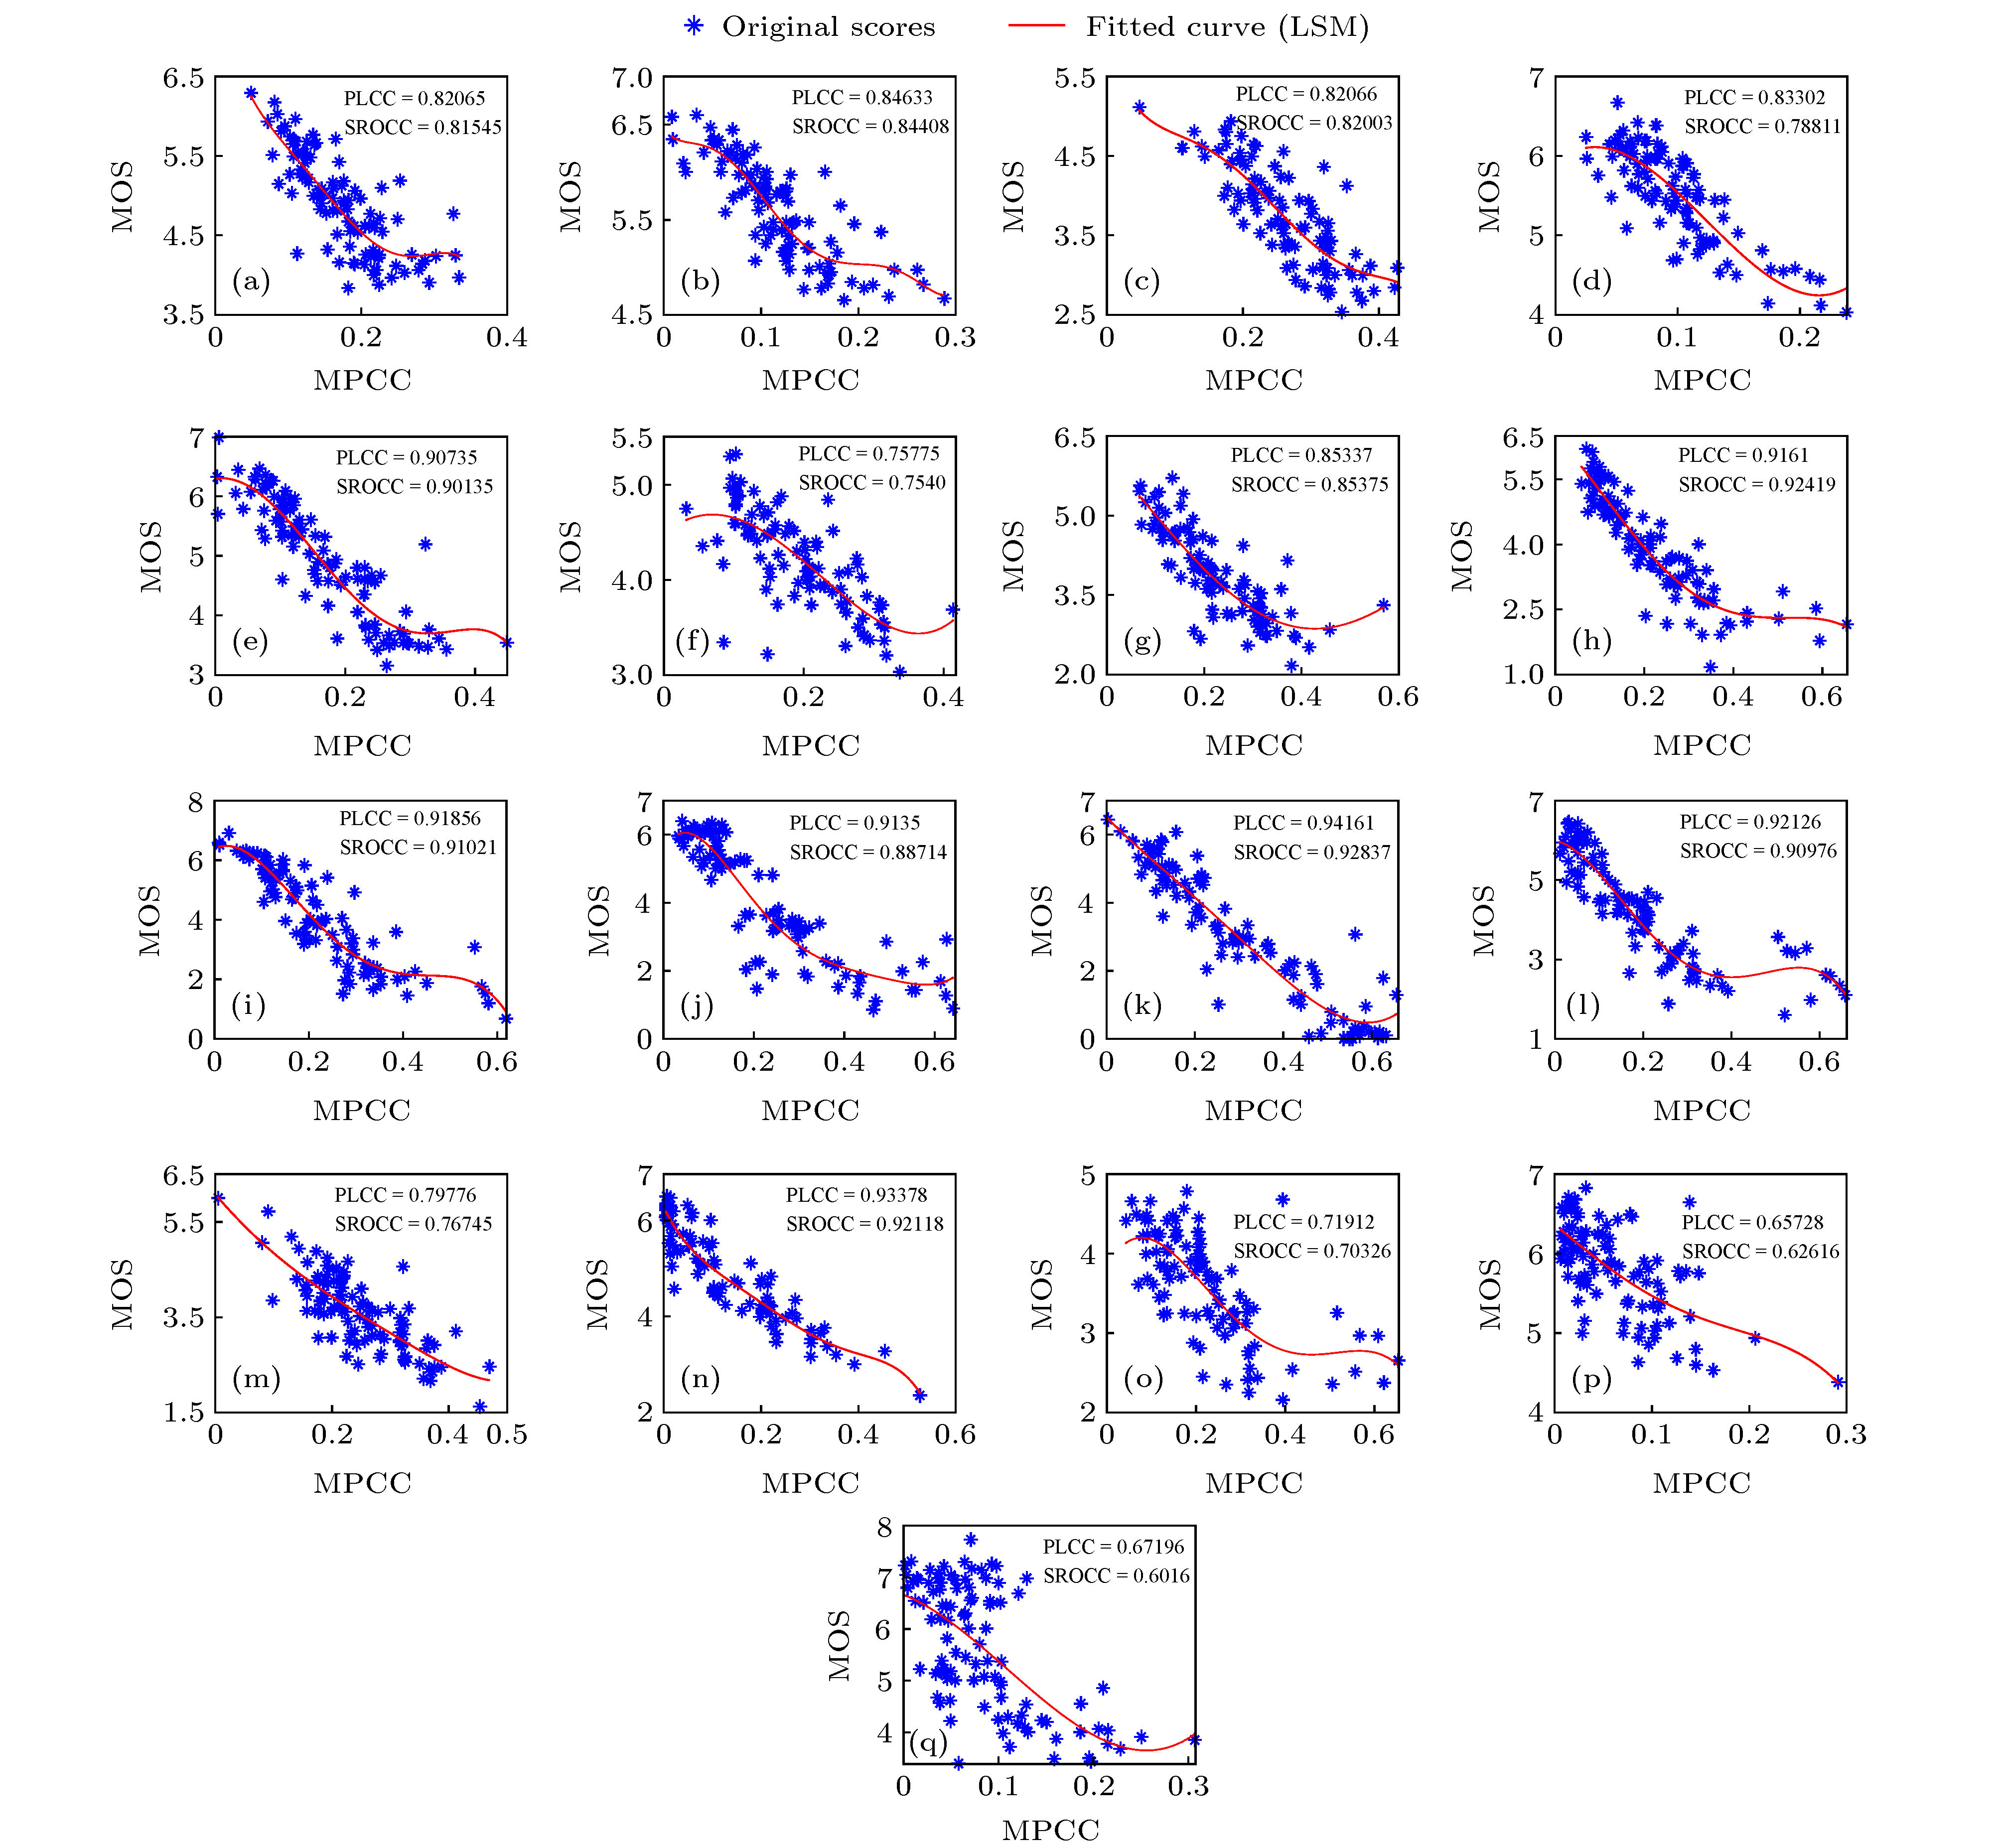
图 9 所提IQA模型对TID2008库中17种失真类型的失真图像评价结果的散点图 (a) AGN; (b) ANCC; (c) SCN; (d) MN; (e) HFN; (f) IN; (g) QN; (h) GB; (i) ID; (j) JPEG; (k) JPEG2k; (l) JPEGtrans; (m) JPEG2ktrans; (n) NEPN; (o) LBWD; (p) MS; (q) CC
Fig. 9. Scatter plots of the IQA results of 17 kinds of distorted images in TID2008 database evaluating by the proposed IQA model: (a) AGN; (b) ANCC; (c) SCN; (d) MN; (e) HFN; (f) IN; (g) QN; (h) GB; (i) ID; (j) JPEG; (k) JPEG2k; (l) JPEGtrans; (m) JPEG2ktrans; (n) NEPN; (o) LBWD; (p) MS; (q) CC.
表 1 4个数据库中的图像主客观IQA分数之间的相关性参数计算结果
Table 1. Calculated 4 correlation parameters between the subjective and objective IQA scores of images in 4 databases.
数据库 LIVE(779) CSIQ(866) TID2008(1700) TID2013(3000) 加权 PLCC 0.9622 0.9586 0.8778 0.8616 0.8915 SROCC 0.9660 0.9569 0.8831 0.8452 0.8854 RMSE 7.4397 0.0747 0.6427 0.6293 — OR 0.1531 0.2690 0.1287 0.1198 —  下载: 导出CSV
表 2 基于CSIQ, LIVE和TID2013数据库中的图像IQA结果比较所提模型与现有7个模型的精度
Table 2. Comparing the accuracy of the proposed model with those of the existing 7 models based on the IQA results in CSIQ, LIVE, and TID2013 databases.
数据库 参数 PSNR VSNR SSIM FSIMc VSI GMSD MAD MPCC CSIQ PLCC 0.8000 0.8002 0.8613 0.9192 0.9279 0.9541 0.9502 0.9587 SROCC 0.8058 0.8106 0.8756 0.9310 0.9423 0.9570 0.9466 0.9569 RMSE 0.1575 0.1575 0.1334 0.1034 0.0979 0.0786 0.0818 0.0748 OR 0.4220 0.3832 0.3535 0.3041 0.2873 0.2742 0.2829 0.2738 LIVE PLCC 0.8723 0.9231 0.9449 0.9613 0.9482 0.9603 0.9675 0.9620 SROCC 0.8756 0.9274 0.9479 0.9645 0.9524 0.9603 0.9669 0.9660 RMSE 13.3597 10.5059 8.9455 7.5296 8.6816 7.6214 6.9073 7.4598 OR 0.2179 0.2151 0.1865 0.1627 0.1853 0.1643 0.1529 0.1606 TID2013 PLCC 0.7062 0.7402 0.7895 0.8769 0.9000 0.8553 0.8267 0.8648 SROCC 0.6917 0.7316 0.7417 0.8510 0.8965 0.8044 0.7807 0.8452 RMSE 0.8887 0.8392 0.7608 0.5959 0.5404 0.6423 0.6975 0.6224 OR 0.1636 0.1552 0.1427 0.1132 0.1045 0.1242 0.1323 0.1179
下载: 导出CSV
表 3 基于TID2013库中24类失真图像评价结果的PLCC值以8个IQA模型的精度对比
Table 3. Accuracy comparisons among 8 IQA metrics based on PLCC of IQA results from 24 types of distortion images in TID2013 database.
失真类别 PSNR VSNR SSIM FSIMc VSI GMSD MAD MPCC 1 Additive Gaussian noise(AGN) 0.9552 0.8319 0.8685 0.9152 0.9527 0.9503 0.8897 0.8706 2 Noise in color comp. (NCC) 0.9256 0.7814 0.8050 0.8873 0.9172 0.9118 0.8438 0.8324 3 Spatially correl. noise (SCN) 0.9525 0.8105 0.8621 0.8989 0.9472 0.9391 0.9008 0.7457 4 Masked noise (MN) 0.8707 0.7715 0.8219 0.8492 0.8203 0.7547 0.8009 0.6943 5 High frequency noise (HFN) 0.9731 0.9061 0.9081 0.9475 0.9655 0.9567 0.9233 0.9090 6 Impulse noise (IN) 0.8887 0.7442 0.7415 0.8171 0.8635 0.7572 0.3206 0.7408 7 Quantization noise (QN) 0.8880 0.8384 0.8702 0.8794 0.8747 0.9110 0.8571 0.8122 8 Gaussian blur (GB) 0.9169 0.9437 0.9634 0.9544 0.9551 0.9099 0.9357 0.9252 9 Image denoising (ID) 0.9640 0.9463 0.9589 0.9652 0.9707 0.9759 0.9645 0.9594 10 JPEG compression (JPEG) 0.9167 0.9386 0.9551 0.9754 0.9858 0.9843 0.9638 0.9509 11 JPEG2000 compression (JPEG2 K) 0.9170 0.9513 0.9658 0.9754 0.9845 0.9812 0.9740 0.9452 12 JPEG transm. errors (JPEG trans.) 0.8104 0.8597 0.9181 0.9176 0.9457 0.9079 0.9001 0.8805 13 JPEG2000 transm. errors (JPEG2K trans) 0.9002 0.8435 0.8801 0.8929 0.9192 0.9085 0.8838 0.8699 14 Non ecc. patt. noise (NEPN) 0.6746 0.6774 0.7773 0.8068 0.8162 0.8133 0.8608 0.8132 15 Local block-wise dist. (LBWD) 0.2410 0.3632 0.6022 0.5542 0.4984 0.6520 0.4187 0.6845 16 Mean shift (MS) 0.8056 0.5160 0.8019 0.7869 0.8021 0.7707 0.6934 0.7720 17 Contrast change (CC) 0.5811 0.4251 0.6026 0.7266 0.6974 0.7111 0.3199 0.8108 18 Change of color saturation (CSS) 0.3294 0.4184 0.4590 0.8228 0.8052 0.4234 0.2846 0.7583 19 Multipl. Gauss. noise (MGN) 0.9204 0.7730 0.7896 0.8660 0.9136 0.8911 0.8529 0.8759 20 Comfort noise (CN) 0.8702 0.9016 0.9022 0.9463 0.9546 0.9562 0.9444 0.8476 21 Lossy compr. of noisy (LCN) 0.9429 0.8960 0.9174 0.9564 0.9636 0.9703 0.9562 0.7889 22 Image color quant. w. dither (CQWD) 0.9308 0.8773 0.8619 0.8911 0.8963 0.9192 0.8779 0.8721 23 Chromatic aberrations (CA) 0.9556 0.9592 0.9770 0.9794 0.9748 0.9737 0.9696 0.9473 24 Sparse sampl. and reconstr. (SSR) 0.9296 0.9477 0.9667 0.9776 0.9808 0.9849 0.9766 0.9349 Max 0.9731 0.9592 0.9770 0.9794 0.9858 0.9849 0.9766 0.9594 Min 0.2410 0.3632 0.4590 0.5542 0.4984 0.4234 0.2846 0.6845 波动范围宽度 0.7321 0.5959 0.5181 0.4252 0.4873 0.5614 0.6920 0.2750 所有整体精度 0.7062 0.7402 0.7895 0.8769 0.9000 0.8553 0.8267 0.8648
下载: 导出CSV
-
[1] Nightingale J, Salva P, Alcarazcalero J M, Wang Q 2018 IEEE Trans. Broadcast. 64 621
Google Scholar
[2] 丰卉, 孙彪, 马书根 2017 物理学报 66 180202
Google Scholar
Feng H, Sun B, Ma S G 2017 Acta Phys. Sin. 66 180202
Google Scholar
[3] Yao J C, Liu G Z 2019 IEEE Trans. Broadcast. 65 546
Google Scholar
[4] Chandler D M, Hemami S S 2007 IEEE Trans. Image Process. 16 2284
Google Scholar
[5] Wang Z, Bovik A C, Sheikh H R, Simoncelli E P 2004 IEEE Trans. Image Process. 13 600
[6] Zhang L, Zhang L, Mou X, Zhang D 2011 IEEE Trans. Image Process. 20 2378
Google Scholar
[7] Xue W, Zhang L, Mou X, Bovik A C 2014 IEEE Trans. Image Process. 23 684
Google Scholar
[8] Zhang L, Shen Y, Li H 2014 IEEE Trans. Image Process. 23 4270
Google Scholar
[9] Larson E C, Chandler D M 2010 J. Electron. Imaging 19 011006
Google Scholar
[10] Fang Y M, Yan J B, Li L D, Wu J J, Lin W S 2018 IEEE Trans. Image Process. 27 1600
Google Scholar
[11] 方志明, 崔荣一, 金璟璇 2017 物理学报 66 109501
Google Scholar
Fang Z M, Cui R Y, Jin J X 2017 Acta Phys. Sin. 66 109501
Google Scholar
[12] Qi H, Jiao S H, Lin W S, Tang L, Shen W H 2014 Electron. Lett. 50 1435
[13] Zheng L, Shen L, Chen J, An P, Luo J 2019 IEEE Trans. Multimedia 21 2057
Google Scholar
[14] Yang X, Wang T, Ji G 2020 IET Image Proc. 14 384
Google Scholar
[15] Ahar A, Barri A, Schelkens P 2018 IEEE Trans. Image Process. 27 879
Google Scholar
[16] Zhou W J, Yu L, Zhou Y, Qiu W W, Wu M W 2018 IEEE Trans. Image Process. 27 2086
[17] Yao J C, Liu G Z 2018 IET Image Proc. 12 872
Google Scholar
[18] Wang X, Meng F, Huang X Y 2018 Proceeding of the 11 th International Congress on Image and Signal Processing, BioMedical Engineering and Informatics (CISP-BMEI) Beijing, China, October 13—15, 2018 p1
[19] Ginesu G, Massidda F, Giusto D D 2006 Signal Process. Image Commun. 21 316
Google Scholar
[20] Nadenau M 2000 Ph. D Dissertation (Lausanne: École Polytechnique Fédérale de Lausanne)
[21] Niu Y Z, Zhang H F, Guo W Z, Ji R R 2018 IEEE Trans. Circuits Syst. Video Technol. 28 849
[22] 王鸿南, 钟文, 汪静, 夏德深 2004 中国图象图形学报 9 828
Google Scholar
Wang H N, Zhong W, Wang J, Xia D S 2004 J. Image Graph. 9 828
Google Scholar
[23] Sheikh H R, Wang Z, Cormack L LIVE Image Quality Assessment Database Release 2 Available: http://live.ece. utexas.edu/research/quality [2019-12-20]
[24] Larson E C, Chandler D M The CSIQ image database http://vision.okstate.edu/?loc=csiq [2019-12-20]
[25] Ponomarenko N, Lukin V, Zelensky A, Egiazarian K, Carli M, Battisti F Tampere Image Database 2008 TID2008, version 1.0 http://www.ponomarenko.info/tid2008.htm [2019-12-20]
[26] Ponomarenko N, Jin L, Ieremeiev O, Lukin V, Egiazarian K, Astola J, Vozel B, Chehdi K, Carli M, Battisti F, Kuo C C J 2015 Signal Process. Image Commun. 30 57
[27] Athar S, Wang Z 2019 IEEE Access 7 140030
Google Scholar
[28] Callet L, Patrick A F Subjective quality assessment IRCCyN /IVC database http://www2.irccyn.ec-nantes.fr/ivcdb/ [2019-12-20]
[29] Yi Z, Chandler D M 2018 IEEE Trans. Image Process. 27 5433
[30] Dai T, Gu K, Niu L, et al. 2018 Neurocomputing 290 185
[31] Zhang C, Cheng W, Hirakawa K 2019 IEEE Trans. Image Process. 28 1732


 下载:
下载:
计量
- 文章访问数: 14075
- PDF下载量: 195
- 被引次数: 0
