


-
针对页岩气开发过程中污染气体浓度与扩散分布不确定性问题, 利用自主设计并搭建的开放光路傅里叶变换红外光谱(FTIR)测量系统, 对返排液中污染气体进行浓度反演, 并通过返排液流速及污染源大小, 计算出污染源源强. 结合现场环境, 建立参考坐标, 对高斯扩散模型进行数学推导, 构建污染源面源扩散模型并进行仿真分析. 结果表明: 源强、距离、风速、大气稳定度影响气体浓度扩散. 对返排液进行80 h连续测量, 确定主要污染气体浓度及面源源强. 实验结果表明: 返排液排放的主要污染气体为丙烷、戊烷、丙烯、一氧化碳、二氧化硫; 对应的最大浓度分别4.689, 25.494, 30.324, 0.656, 4.620 mg/m3. 最大面源源强分别为1.9872, 10.9750, 12.8513, 0.2707, 1.9064 g/s. 结合风速及日间环境情况, 选取大气稳定度, 将源强代入面源扩散模型, 进行污染气体扩散浓度构建, 实现对不同污染气体不同位置上浓度分布的实时监测. 相对于传统测量方法, 利用FTIR方法并结合面源扩散模型, 不仅能够实现对污染源的非接触远距离在线测量, 还能对污染气体分布进行安全区域划分.Aiming at the uncertainty of the concentration of the pollution gases and the spread of distribution in the process of shale gas development, the open optical path Fourier Transform infrared spectroscopy (FTIR) measurement system designed and built by ourselves is used to invert the concentration of pollution gases in the backflow, and the size of pollution source is calculated by the flow rate of backflow liquid and the size of pollution source. By combining with the field environment and establishing the reference coordinates, the Gaussian diffusion model is derived mathematically, and the non-point source diffusion model of pollution source is constructed and simulated. The result shows that the source intensity, distance, wind speed and atmospheric stability all affect gas concentration diffusion. The concentration of main pollution gas and the strength of non-point source are obtained by continuously measuring the backflow liquid for 80 h. The result shows that C3H8, C5H12, C3H6, CO and SO2 are the main pollution gases of the backflow liquid, and their maximum concentrations are 4.689 mg/m3, 25.494 mg/m3, 30.324 mg/m3, 0.656 mg/m3 and 4.620 mg/m3, respectively. The maximum strengths of non-point source are 1.9872 g/s, 10.9750 g/s, 12.8513 g/s, 0.2707 g/s and 1.9064 g/s, respectively. By combining the wind speed and daytime environmental conditions, the atmospheric stability is selected and the source strength is substituted into the non-point source diffusion model, the diffusion concentration of polluted gas is obtained, and the real-time monitoring of the concentration distribution of different polluted gases at different locations is realized. The traditional method is used to collect air samples in the field and determine them in the laboratory. It takes a long time and different sampling methods are affected by the preservation time of samples, etc., so there is a great difference between the measured values in the laboratory and the measured values in the field. The country has issued online monitoring standards for volatile organic compounds (VOCs), but most of them are for the determination of non-methane total hydrocarbon, which cannot realize in situ component analysis, and cannot implement the monitoring of VOC concentration distribution within the region. Compared with traditional measurement methods, the method of FTIR and non-point source diffusion model can not only realize the non-contact, long-distance, online measurement of pollution sources, but also set the dynamic factory boundary of the pollution area and determine the safe distribution area.
-
Keywords:
- shale gas /
- pollution gases /
- non-point source /
- diffusion model /
- concentration distribution
[1] Vedachalam N, Srinivasalu S, Rajendran G, Ramadass G A, Atmanand M A 2015 J. Nat. Gas. Sci. Eng. 26 163
 Google Scholar
[2] Lim G Q, Matin M, John K 2019 Sci. Total Environ. 656 347
Google Scholar
[3] Douglas G, Anita A, Ben W, Cody F, Edward C F, Joda W 2017 Elem. Sci. Anth. 5 1
Google Scholar
[4] Lindsey B W, Aurelia L, Lorenzo C, Tim B 2019 Elem. Sci. Anth. 7 49
Google Scholar
[5] Klewiah I, Berawala D S, Alexander Walker H C, Andersen P Ø, Nadeau P H 2020 J. Nat. Gas. Sci. Eng. 73 103045
Google Scholar
[6] Lin K, Yuan Q, Zhao Y P 2017 Comput. Mater. Sci. 133 99
Google Scholar
[7] Roy A A, Adams P J, Robinson A L 2014 J. Air Waste Manage. Assoc. 64 19
Google Scholar
[8] Chang C Y, Faust E, Hou X, Lee P, Kim H C, Hedquist B C, Liao K J 2016 Atmos. Environ. 142 152
Google Scholar
[9] Lisak D, Cygan A, Bermejo D 2015 J. Quant. Spectrosc. Radiat. Transfer 164 221
Google Scholar
[10] Zielinska B, Campbell D, Samburova V 2014 J. Air Waste Manage. Assoc. 64 1369
Google Scholar
[11] Zavala-Araiza D, Sullivan D W, Allen D T 2014 Environ. Sci. Technol. 48 5314
Google Scholar
[12] Pang X, Nan H, Zhong J, Ye D, Shaw M D, Lewis A C 2019 Sci. Total Environ. 664 771
Google Scholar
[13] Sun J, Xue N, Wang W, Wang H, Liu C, Ma T, Li T, Tan T 2019 J. Micromech. Microeng. 29
[14] Bunch A G, Perry C S, Abraham L, Wikoff D S, Tachovsky J A, Hixon J G, Urban J D, Harris M A, Haws L C 2014 Sci. Total Environ. 832 468
Google Scholar
[15] Ojha D P, Song J H, Kim H J 2019 J. Environ. Sci. 79 35
Google Scholar
[16] Blommaerts N, Dingenen F, Middelkoop V, Savelkouls J, Goemans M, Tytgat T, Verbruggen S W, Lenaerts S 2018 Sep. Purif. Technol. 207 284
Google Scholar
[17] Francisco T S, Jia C, Stephan H, Frank H 2017 J. Wind Eng. Ind. Aerodyn. 169 177
Google Scholar
[18] Gregort C P, Chun Y W, Don B, John L A, Gurumurthy R, Thomas H S, Maria M, Ken S 2004 Environ. Sci. Technol. 38 1949
Google Scholar
[19] Jonathan D W K, Hillary L C 2018 Atmos. Environ. 187 196
Google Scholar
[20] Briant R, Seigneur C, Gadrat M, Bugajny C 2013 Geosci. Model Dev. 6 445
Google Scholar
[21] Siddiqui M, Jayanti S, Swaminathan T 2012 J. Hazard Mater. 177 209
Google Scholar
-
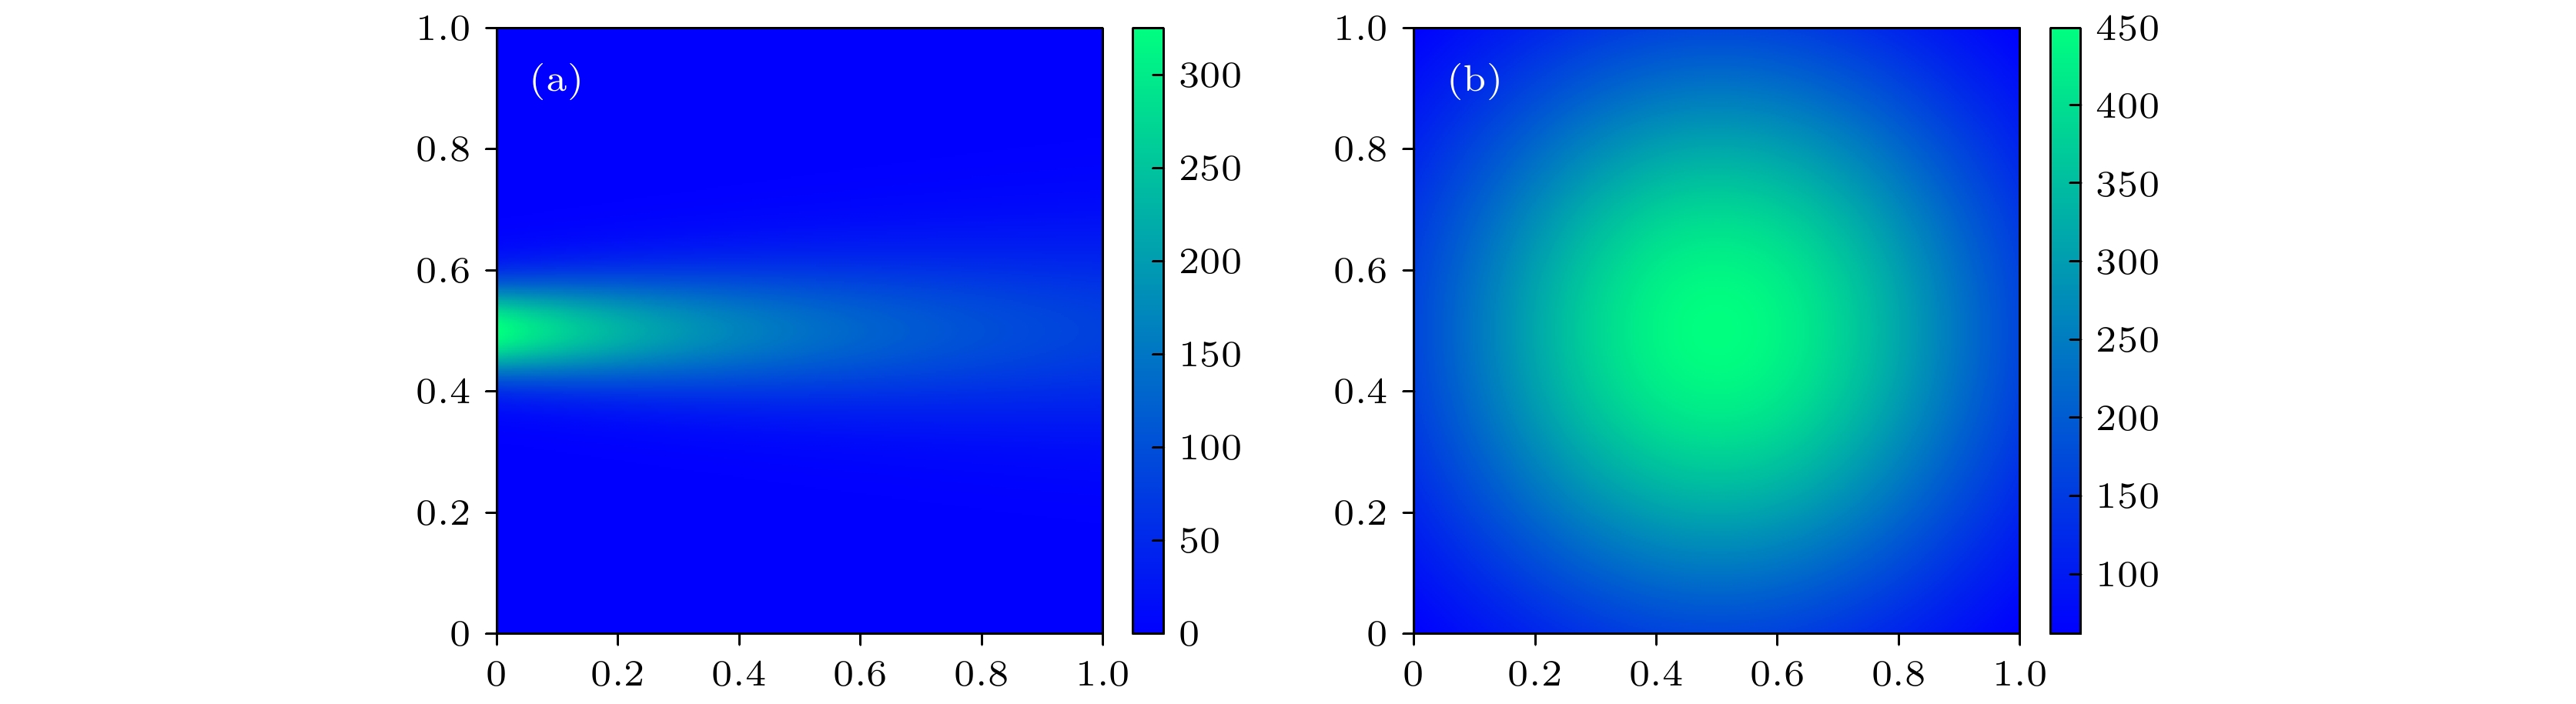
图 1 气体排放图 (a)V = 5 m/s; (b)V = 0 m/s
Fig. 1. Emission map of gas: (a) V = 5 m/s; (b) V = 0 m/s.

图 3 实验外场图 (a)现场情况; (b)设备布设情况
Fig. 3. Experimental outfield diagram: (a) Environment; (b) system.

图 4 气体仿真扩散分布图 (a)V = 1 m/s; (b)V = 3 m/s
Fig. 4. Simulation diffusion distribution diagram of gas: (a) V = 1 m/s; (b) V = 3 m/s

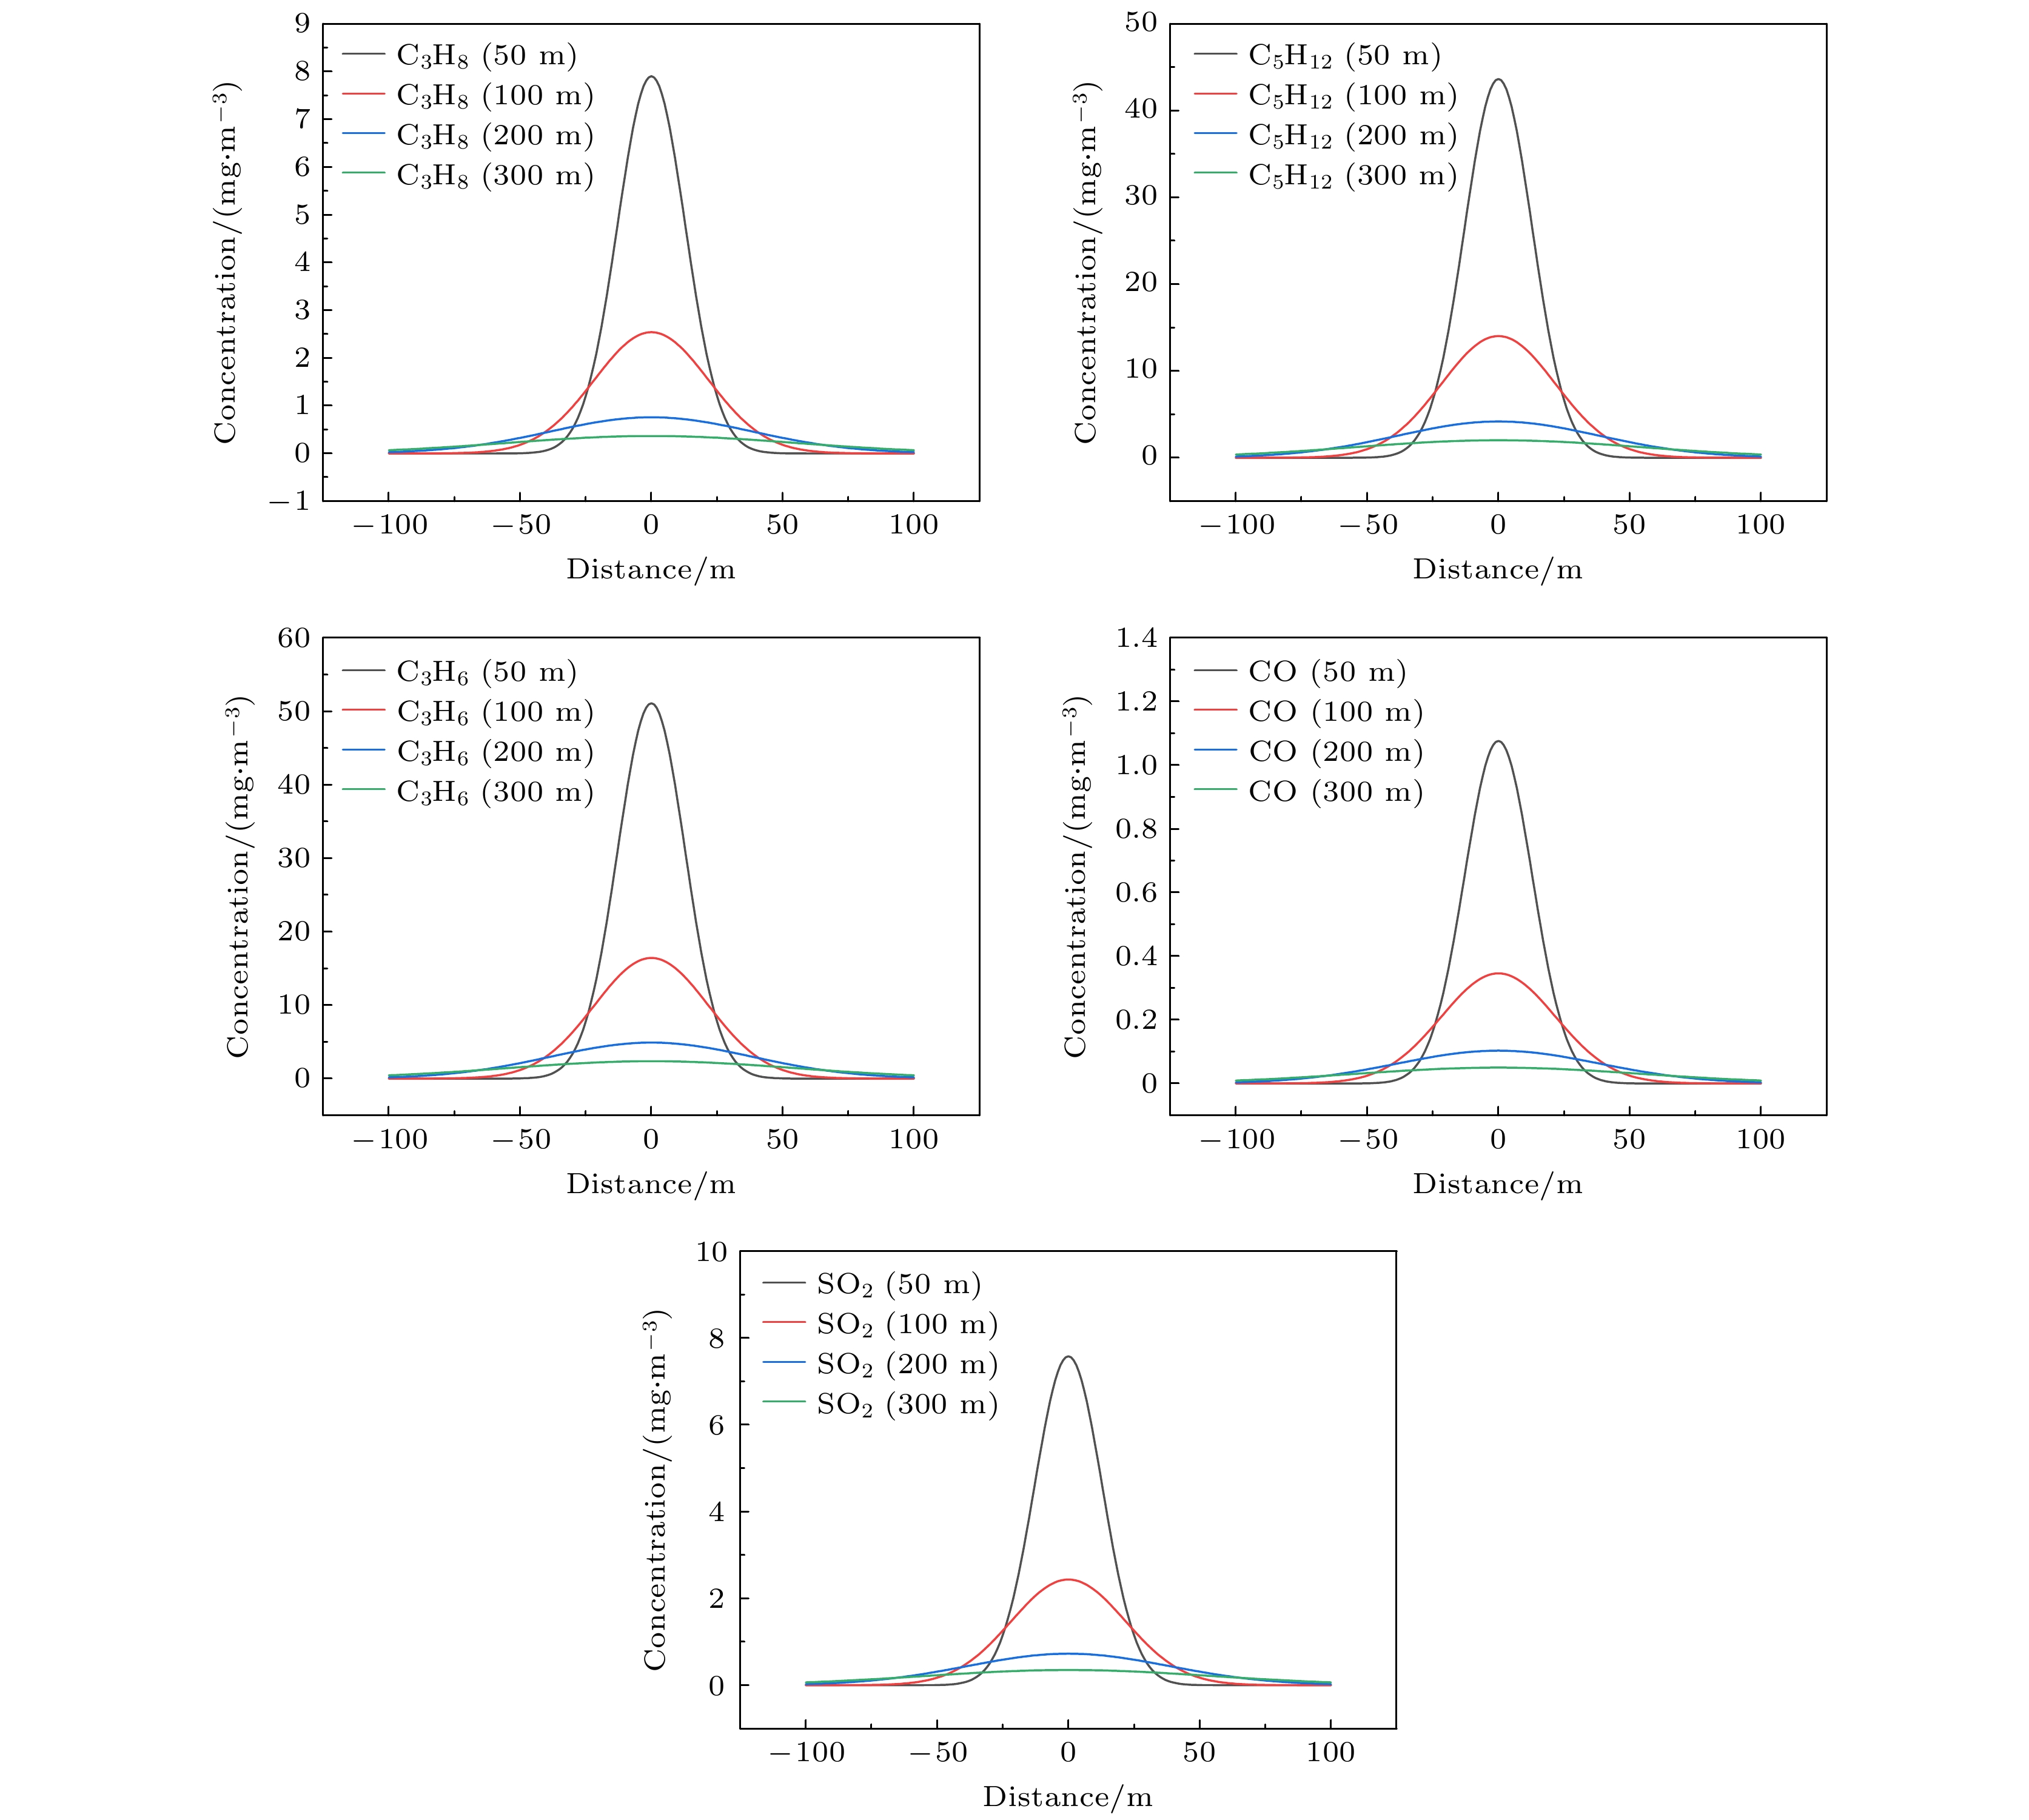
图 5 气体仿真浓度分布图 (a)V = 1 m/s; (b)V = 3 m/s
Fig. 5. Simulation concentration distribution diagram of gas: (a) V = 1 m/s; (b) V = 3 m/s.
表 1 P-G扩散曲线幂函数数据参数表
Table 1. Diffusion curve power function data of P-G.
稳定度 ${\gamma _1}$ ${\gamma _2}$ ${a_1}$ ${a_2}$ A 0.425809 0.0799904 0.901074 1.12154 B 0.281846 0.127190 0.914370 0.964435 B-C 0.229500 0.114682 0.919325 0.941015 C 0.177154 0.106813 0.924279 0.917595 C-D 0.143940 0.126152 0.926849 0.838628 D 0.110726 0.104634 0.929418 0.826212 D-E 0.0985631 0.111771 0.925118 0.776864 E 0.0864001 0.0927529 0.920818 0.788370 F 0.0553634 0.0620765 0.929418 0.784400  下载: 导出CSV
表 2 P-G扩散模型的大气稳定度等级
Table 2. Levels of atmospheric stability for diffusion models of P-G.
表面风速/(m·s–1) 白天日照 夜间条件 强 适中 弱 很薄云层或
大于4/8
低沉云< 3/8朦胧 < 2 A A—B B F F 2—3 A—B B C E F 3—4 B B—C C D F 4—6 C C—D D D D > 6 C D D D D
下载: 导出CSV
-
[1] Vedachalam N, Srinivasalu S, Rajendran G, Ramadass G A, Atmanand M A 2015 J. Nat. Gas. Sci. Eng. 26 163
Google Scholar
[2] Lim G Q, Matin M, John K 2019 Sci. Total Environ. 656 347
Google Scholar
[3] Douglas G, Anita A, Ben W, Cody F, Edward C F, Joda W 2017 Elem. Sci. Anth. 5 1
Google Scholar
[4] Lindsey B W, Aurelia L, Lorenzo C, Tim B 2019 Elem. Sci. Anth. 7 49
Google Scholar
[5] Klewiah I, Berawala D S, Alexander Walker H C, Andersen P Ø, Nadeau P H 2020 J. Nat. Gas. Sci. Eng. 73 103045
Google Scholar
[6] Lin K, Yuan Q, Zhao Y P 2017 Comput. Mater. Sci. 133 99
Google Scholar
[7] Roy A A, Adams P J, Robinson A L 2014 J. Air Waste Manage. Assoc. 64 19
Google Scholar
[8] Chang C Y, Faust E, Hou X, Lee P, Kim H C, Hedquist B C, Liao K J 2016 Atmos. Environ. 142 152
Google Scholar
[9] Lisak D, Cygan A, Bermejo D 2015 J. Quant. Spectrosc. Radiat. Transfer 164 221
Google Scholar
[10] Zielinska B, Campbell D, Samburova V 2014 J. Air Waste Manage. Assoc. 64 1369
Google Scholar
[11] Zavala-Araiza D, Sullivan D W, Allen D T 2014 Environ. Sci. Technol. 48 5314
Google Scholar
[12] Pang X, Nan H, Zhong J, Ye D, Shaw M D, Lewis A C 2019 Sci. Total Environ. 664 771
Google Scholar
[13] Sun J, Xue N, Wang W, Wang H, Liu C, Ma T, Li T, Tan T 2019 J. Micromech. Microeng. 29
[14] Bunch A G, Perry C S, Abraham L, Wikoff D S, Tachovsky J A, Hixon J G, Urban J D, Harris M A, Haws L C 2014 Sci. Total Environ. 832 468
Google Scholar
[15] Ojha D P, Song J H, Kim H J 2019 J. Environ. Sci. 79 35
Google Scholar
[16] Blommaerts N, Dingenen F, Middelkoop V, Savelkouls J, Goemans M, Tytgat T, Verbruggen S W, Lenaerts S 2018 Sep. Purif. Technol. 207 284
Google Scholar
[17] Francisco T S, Jia C, Stephan H, Frank H 2017 J. Wind Eng. Ind. Aerodyn. 169 177
Google Scholar
[18] Gregort C P, Chun Y W, Don B, John L A, Gurumurthy R, Thomas H S, Maria M, Ken S 2004 Environ. Sci. Technol. 38 1949
Google Scholar
[19] Jonathan D W K, Hillary L C 2018 Atmos. Environ. 187 196
Google Scholar
[20] Briant R, Seigneur C, Gadrat M, Bugajny C 2013 Geosci. Model Dev. 6 445
Google Scholar
[21] Siddiqui M, Jayanti S, Swaminathan T 2012 J. Hazard Mater. 177 209
Google Scholar

 下载:
下载:


计量
- 文章访问数: 6374
- PDF下载量: 72
- 被引次数: 0
