


-
The intramolecular vibronic coupling has a great effect on molecular electronic transitions and associated spectral characteristics, which is a central topic in the study of molecular spectroscopy. In this paper, we investigate the vibronic coupling of a transiently charged state within a single 3,4,9,10-perylenetetracarboxylicdianhydride (PTCDA) molecule in real space by imaging the spatial distribution of single-molecule electroluminescence via highly localized excitation of tunneling electrons in a plasmonic nanocavity. The electron injections from a scanning tunneling microscope tip into a PTCDA molecule on a silver-supported ultrathin salt layer produce a transient doubly charged molecular anion that emits vibrationally resolved fluorescence. The sub-molecular resolved spectroscopic imaging for the –2 valence transiently charged state shows a two-spot pattern along the molecular short axis for the purely electronic 0-0 transition. However, the observed two-spot orientation for certain anti-symmetric vibronic-state imaging is found to be evidently different from the purely electronic 0-0 transition, rotating 90°, which reflects the change in the transition dipole orientation from along the molecular short axis to the long axis. Such a change directly reveals the occurrence of strong vibronic coupling associated with a large Herzberg-Teller (HT) contribution, which goes beyond the conventional Franck-Condon (FC) picture. Combined with theoretical calculations, the anti-symmetric vibration is found to have a strong dynamic disturbance to the transition density of purely electronic transitions, especially those atoms with large transition densities, which induces a strong transition charge oscillation along the long axis of the molecule and thus leads to a transition dipole along the long axis of the molecule. On the other hand, for vibronic emissions associated with the totally symmetric molecular vibration (such as the v1 (Ag) mode described above), the observed two-spot orientation in the vibronic-state imaging pattern is found to be the same as the purely electronic 0-0 transition, which directly reveals its FC-dominated nature. Notably, the vibration-induced emission associated with HT-dominated contributions (such as the v2 (B3g) mode) is often discussed in the literature by using an intensity borrowing mechanism via the state mixing with other high-lying eigenstates. In the present work, the v2-vibration with B3g symmetry is likely to modulate the zero-order electronic wavefunction of the S1 state in a way to best resemble that of the S2 state (i.e., induce efficient mixing of the electronic excited state S1 with the electronic excited state S2), so that the v2-vibration induced emission seems to borrow intensities from neighboring S2→S0 transitions. Our results provide a new route for the real-space understanding of the microscopic picture for the vibronic coupling within a single molecule in a transiently charged state.
-
Keywords:
- scanning tunneling microscope induced luminescence /
- vibronic coupling /
- PTCDA /
- transiently charged molecular state
[1] Atkins P, Friedman R 2011 Molecular Quantum Mechanics (Oxford: Oxford University Press)
[2] McHale J L 2017 Molecular Spectroscopy (CRC Press)
[3] Fisher G 1984 Vibronic Coupling: The Interaction between the Electronic and Nuclear Motions (London: Academic Press)
[4] Azumi T, Matsuzaki K 1977 Photochem. Photobiol. 25 315
 Google Scholar
[5] Born M, Oppenheimer R 1927 Ann. Phys. (Leipzig) 389 457
[6] Franck J, Dymond E 1926 Trans. Faraday Soc. 21 536
Google Scholar
[7] Condon E U 1928 Phys. Rev. 32 858
Google Scholar
[8] Herzberg G, Teller E 1933 Z. Phys. Chem. 21 410
[9] Hestand N J, Spano F C 2018 Chem. Rev. 118 7069
Google Scholar
[10] Qiu X H, Nazin G V, Ho W 2003 Science 299 542
Google Scholar
[11] Dong Z C, Guo X L, Trifonov A S, Dorozhkin P S, Miki K, Kimura K, Yokoyama S, Mashiko S 2004 Phys. Rev. Lett. 92 086801
Google Scholar
[12] Cavar E, Blum M C, Pivetta M, Patthey F, Chergui M, Schneider W D 2005 Phys. Rev. Lett. 95 196102
Google Scholar
[13] Dong Z C, Zhang X L, Gao H Y, Luo Y, Zhang C, Chen L G, Zhang R, Tao X, Zhang Y, Yang J L, Hou J G 2010 Nat. Photonics 4 50
Google Scholar
[14] Zhang Y, Luo Y, Zhang Y, Yu Y J, Kuang Y M, Zhang L, Meng Q S, Luo Y, Yang J L, Dong Z C, Hou J G 2016 Nature 531 623
Google Scholar
[15] Imada H, Miwa K, Imai-Imada M, Kawahara S, Kimura K, Kim Y 2016 Nature 538 364
Google Scholar
[16] Doppagne B, Chong M C, Bulou H, Boeglin A, Scheurer F, Schull G 2018 Science 361 251
Google Scholar
[17] Kimura K, Miwa K, Imada H, Imai-Imada M, Kawahara S, Takeya J, Kawai M, Galperin M, Kim Y 2019 Nature 570 210
Google Scholar
[18] Kuhnke K, Grosse C, Merino P, Kern K 2017 Chem. Rev. 117 5174
Google Scholar
[19] Chen C, Chu P, Bobisch C A, Mills D L, Ho W 2010 Phys. Rev. Lett. 105 217402
Google Scholar
[20] Doppagne B, Chong M C, Lorchat E, Berciaud S, Romeo M, Bulou H, Boeglin A, Scheurer F, Schull G 2017 Phys. Rev. Lett. 118 127401
Google Scholar
[21] Imada H, Miwa K, Imai-Imada M, Kawahara S, Kimura K, Kim Y 2017 Phys. Rev. Lett. 119 013901
Google Scholar
[22] Kong F F, Tian X J, Zhang Y, Yu Y J, Jing S H, Zhang Y, Tian G J, Luo Y, Yang J L, Dong Z C, Hou J G 2021 Nat. Commun. 12 1280
Google Scholar
[23] Haruta N, Sato T, Tanaka K 2012 J. Org. Chem. 77 9702
Google Scholar
[24] Chaudhuri S, Hedstrom S, Mendez-Hernandez D D, Hendrickson H P, Jung K A, Ho J, Batista V S 2017 J. Chem. Theory Comput. 13 6000
Google Scholar
[25] Xue B, Wilhelm M J, Han J, Dai H-L 2021 J. Phys. Chem. A 125 9065
Google Scholar
[26] Cochrane K A, Roussy T S, Yuan B, Tom G, Mårsell E, Burke S A 2018 J. Phys. Chem. C 122 8437
Google Scholar
[27] Beneduci A, Cospito S, La Deda M, Veltri L, Chidichimo G 2014 Nat. Commun. 5 3105
Google Scholar
[28] Kaim W, Fiedler J 2009 Chem. Soc. Rev. 38 3373
Google Scholar
[29] Cochrane K A, Schiffrin A, Roussy T S, Capsoni M, Burke S A 2015 Nat. Commun. 6 8312
Google Scholar
[30] Zhang L, Yu Y J, Chen L G, Luo Y, Yang B, Kong F F, Chen G, Zhang Y, Zhang Q, Luo Y, Yang J L, Dong Z C, Hou J G 2017 Nat. Commun. 8 580
Google Scholar
[31] Tchenio P, Myers A B, Moerner W E 1993 J. Phys. Chem. 97 2491
Google Scholar
[32] Murray C, Dozova N, McCaffrey J G, Shafizadeh N, Chin W, Broquier M, Crepin C 2011 Phys. Chem. Chem. Phys. 13 17543
Google Scholar
[33] Chong M C, Reecht G, Bulou H, Boeglin A, Scheurer F, Mathevet F, Schull G 2016 Phys. Rev. Lett. 116 036802
Google Scholar
[34] Chen G, Luo Y, Gao H Y, Jiang J, Yu Y J, Zhang L, Zhang Y, Li X G, Zhang Z Y, Dong Z C 2019 Phys. Rev. Lett. 122 177401
Google Scholar
[35] Zhang Y, Meng Q S, Zhang L, Luo Y, Yu Y J, Yang B, Zhang Y, Esteban R, Aizpurua J, Luo Y, Yang J L, Dong Z C, Hou J G 2017 Nat. Commun. 8 15225
Google Scholar
[36] Niu Y L, Peng Q, Deng C M, Gao X, Shuai Z 2010 J. Phys. Chem. A 114 7817
[37] Barone V, Bloino J, Biczysko M 2009 GAUSSIAN 09 Revision A2
[38] Duan S, Tian G J, Ji Y F, Shao J S, Dong Z C, Luo Y 2015 J. Am. Chem. Soc. 137 9515
Google Scholar
[39] Zhang Y, Dong Z C, Aizpurua J 2020 J. Phys. Chem. C 124 4674
Google Scholar
[40] Long D A 2002 The Raman Effect: A Unified Treatment of the Theory of Raman Scattering by Molecules (John Wiley & Sons Ltd.)
-
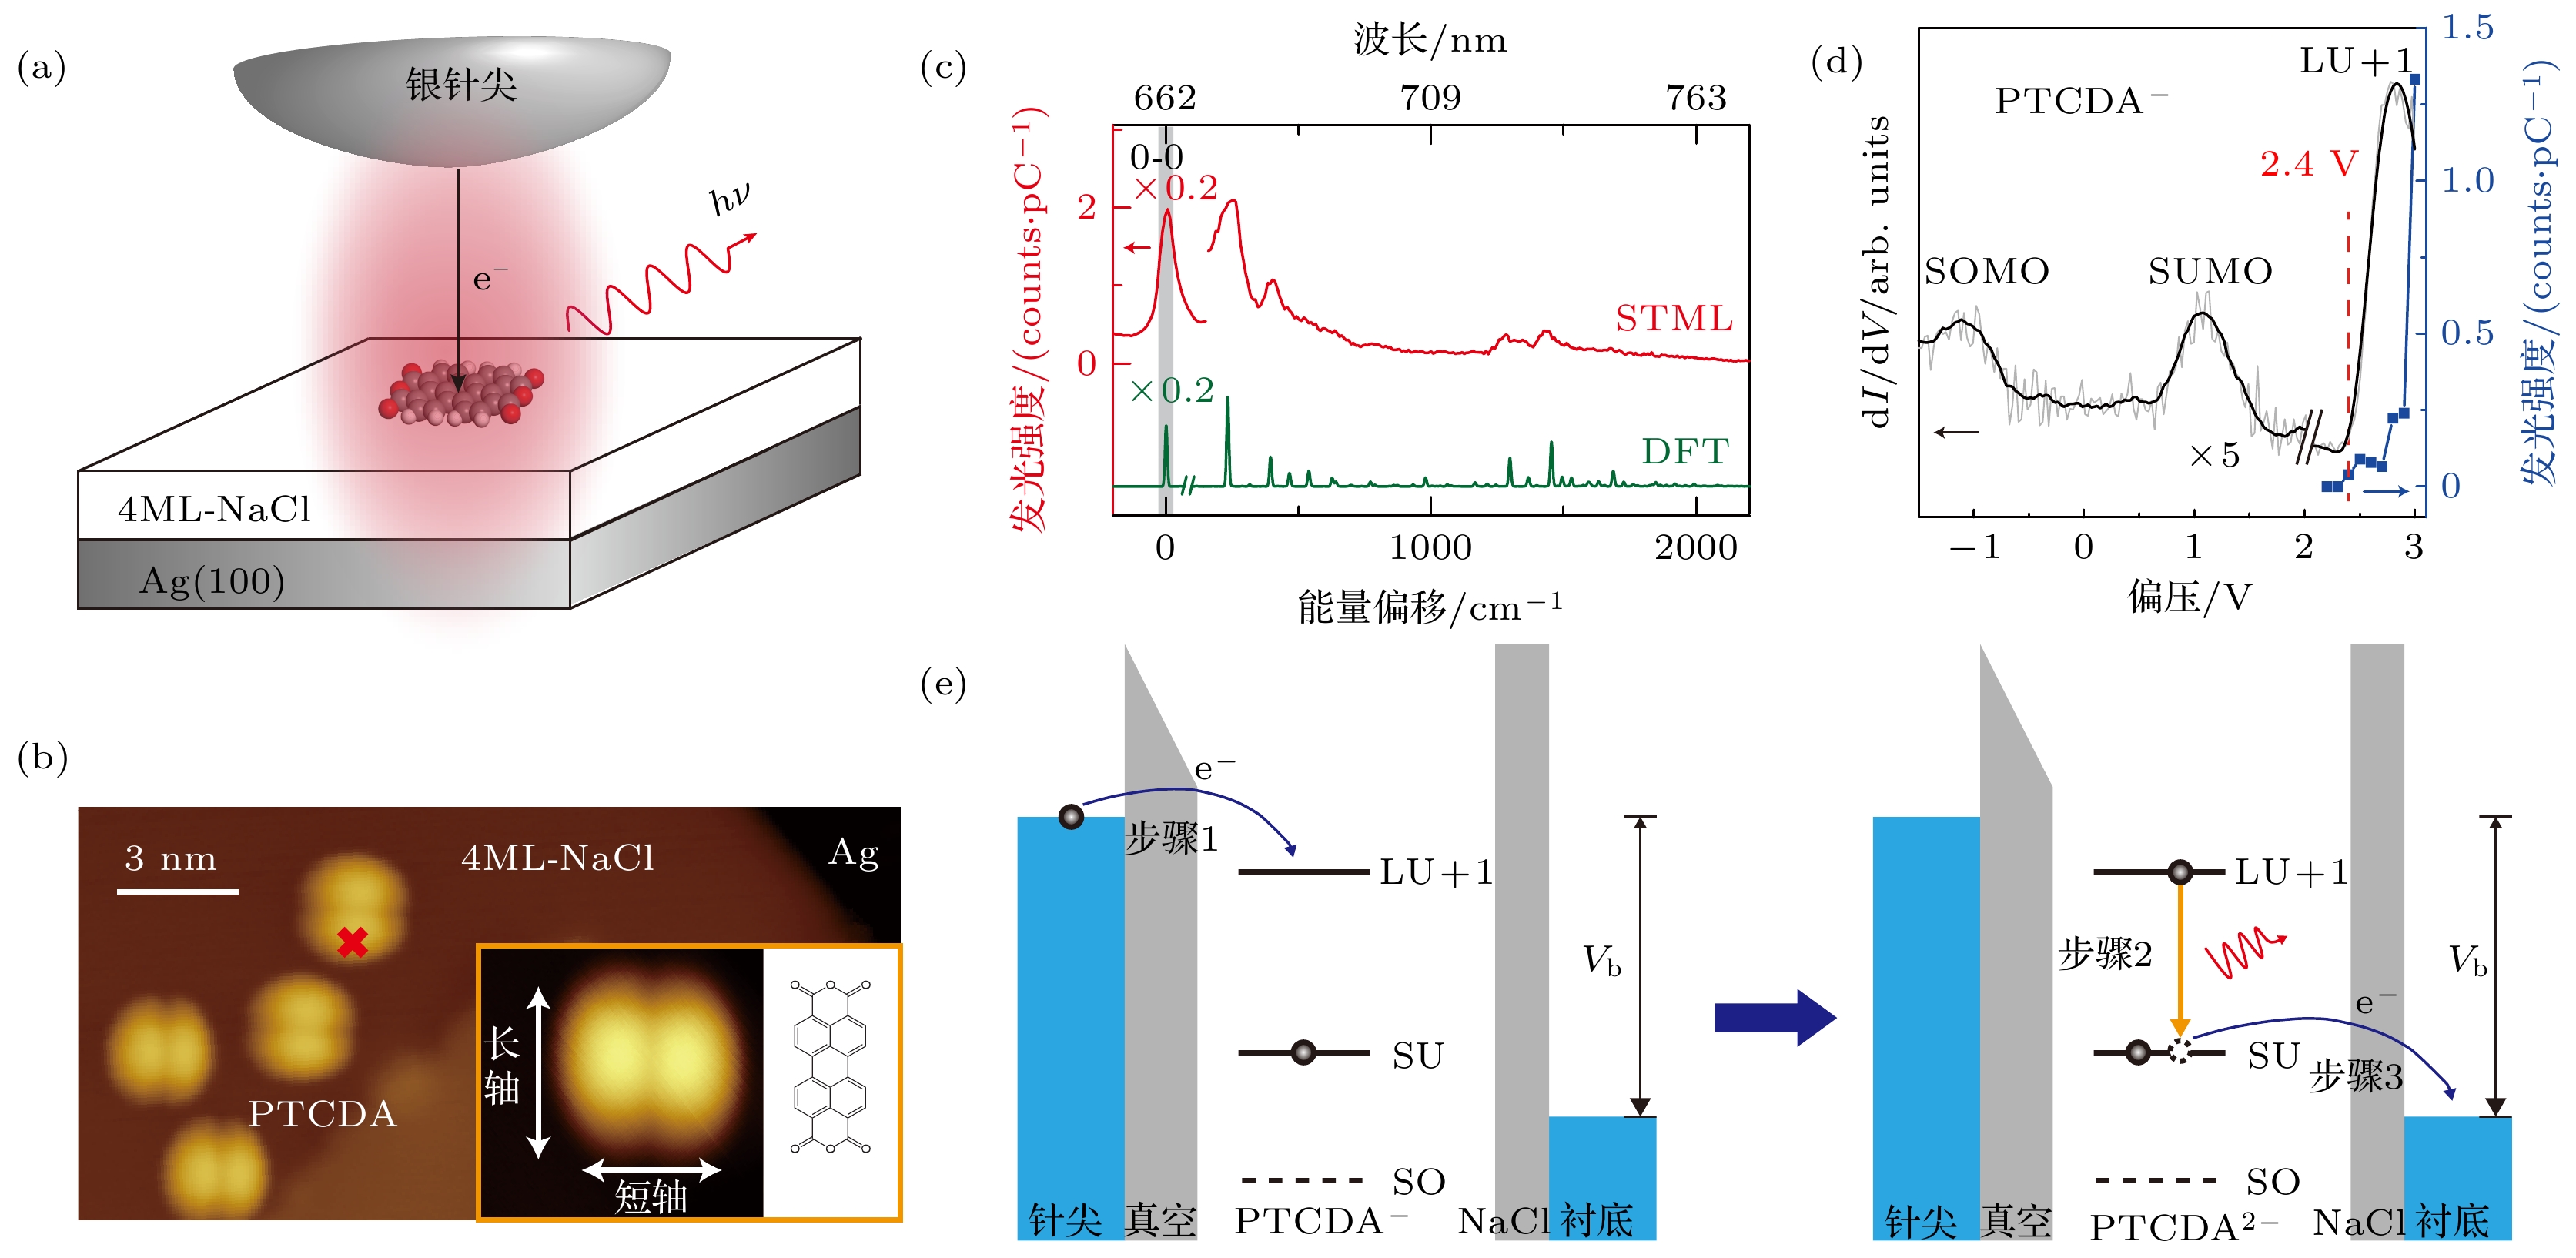
图 1 具有振动分辨的单个PTCDA分子瞬时–2价的电致发光 (a)利用STML技术研究PTCDA分子电致荧光的实验示意图; (b)吸附在4 ML-NaCl/Ag(100)表面PTCDA分子的STM扫描图像, 扫描条件为1 V, 2 pA; 插图为单个PTCDA分子的STM扫描图像与对应取向的分子结构示意图; 比例尺为3 nm; (c)红色曲线对应在图(b)中红色“×”处激发时获得的STML光谱(+3 V, 50 pA, 60 s), 绿色曲线为DFT理论计算的单个–2价PTCDA分子的荧光光谱; (d)黑色曲线对应在图(b)中红色“×”处测量的dI/dV谱(–3 V, 40 pA), 蓝色点线为不同偏压下分子STML发光强度统计; (e)瞬时–2价PTCDA分子的STML发光机制示意图
Figure 1. Vibronically resolved electroluminescence from a single transient doubly charged PTCDA molecule. (a) Schematic of the STML experiment on a single PTCDA molecule on 4 ML-NaCl/Ag(100). (b) STM image of isolated PTCDA molecules adsorbed on 4 ML-NaCl/Ag(100) (+1 V, 2 pA), with the molecular structure given in the inset showing molecular orientation corresponding to the inset STM image. (c) Typical STML spectrum (+3 V, 50 pA, 60 s) (red curve) acquired at the red “×” marked in (b). A DFT simulated fluorescence spectrum from a single doubly charged PTCDA molecule is also plotted for comparison (green curve). (d) Typical dI/dV spectrum (black curve) acquired at the red “×” marked in (b). The setpoint for the dI/dV measurement was –3 V and 40 pA. The molecular emission intensities at different excitation voltages are also shown (blue filled rectangles). (e) Schematic of the mechanism for the molecular electroluminescence of PTCDA2–.

图 2 位置依赖的STML光谱和特定振动峰的光谱成像 (a)上面3条曲线分别为激发分子不同位置获得的STML光谱(+3 V, 20 pA, 60 s), 下面2条曲线分别为理论计算的FC项(绿色)和HT项(橘色)单独贡献的光谱; (b)—(d)分别为0-0峰、v1模式和v2模式能量分辨的实空间光谱成像(+3.5 V, 30 pA, 每像素点3 s), 每条光谱均已扣除等离激元背景; (a)—(d)比例尺均为1 nm; (e), (f)基于DFT理论计算的v1模式和v2模式的势能曲线示意图
Figure 2. Position-dependent STML spectra and spectroscopic imaging for selected vibronic peaks. (a) Three typical STML spectra (+3 V, 20 pA, 60 s) acquired at the positions marked in inset. Also plotted are calculated spectra for the contributions from either FC term (green curve) or HT term (orange curve) alone. (b)–(d) Energy-resolved spectroscopic images for the 0-0 peak (b), the v1 mode (c), and the v2 mode (d). Imaging condition: +3.5 V, 30 pA; 3 s per pixel. The NCP spectral backgrounds in spectroscopic images are subtracted. Scale bars in (a)–(d) are 1 nm. (e), (f) Schematics of the potential energy curves for the v1 mode (e) and the v2 mode (f) based on the DFT calculations.

图 3 跃迁密度和振动诱导跃迁电荷的模拟 (a)模拟的S1→S0跃迁密度, 其中蓝色和红色分别代表正、负电荷的空间分布; (b)理论模拟的0-0跃迁的光子图; (c), (f)叠加了S1→S0跃迁原子电荷分布的v1和v2振动模式示意图; (d), (g)计算的v1和v2模式振动诱导的跃迁电荷分布图; (e), (h)理论模拟的v1和v2模式HT项贡献的光子图
Figure 3. Simulations on transition densities and vibration-induced transition charges. (a) Simulated transition densities for the S1→S0 transition, where the blue and red colors indicate the spatial distributions of the positive and negative charges. (b) Simulated photon image for the 0-0 transition. (c), (f) Schematics of the vibrations for the v1 and v2 modes, superimposed with the S1→S0 transition densities distributed over each atom by Hirschfield population analysis. (d), (g) Calculated vibration-induced transition charges for the v1 and v2 modes. (e), (h) Simulated photon images of the HT-term contributions for the v1 and v2 modes.
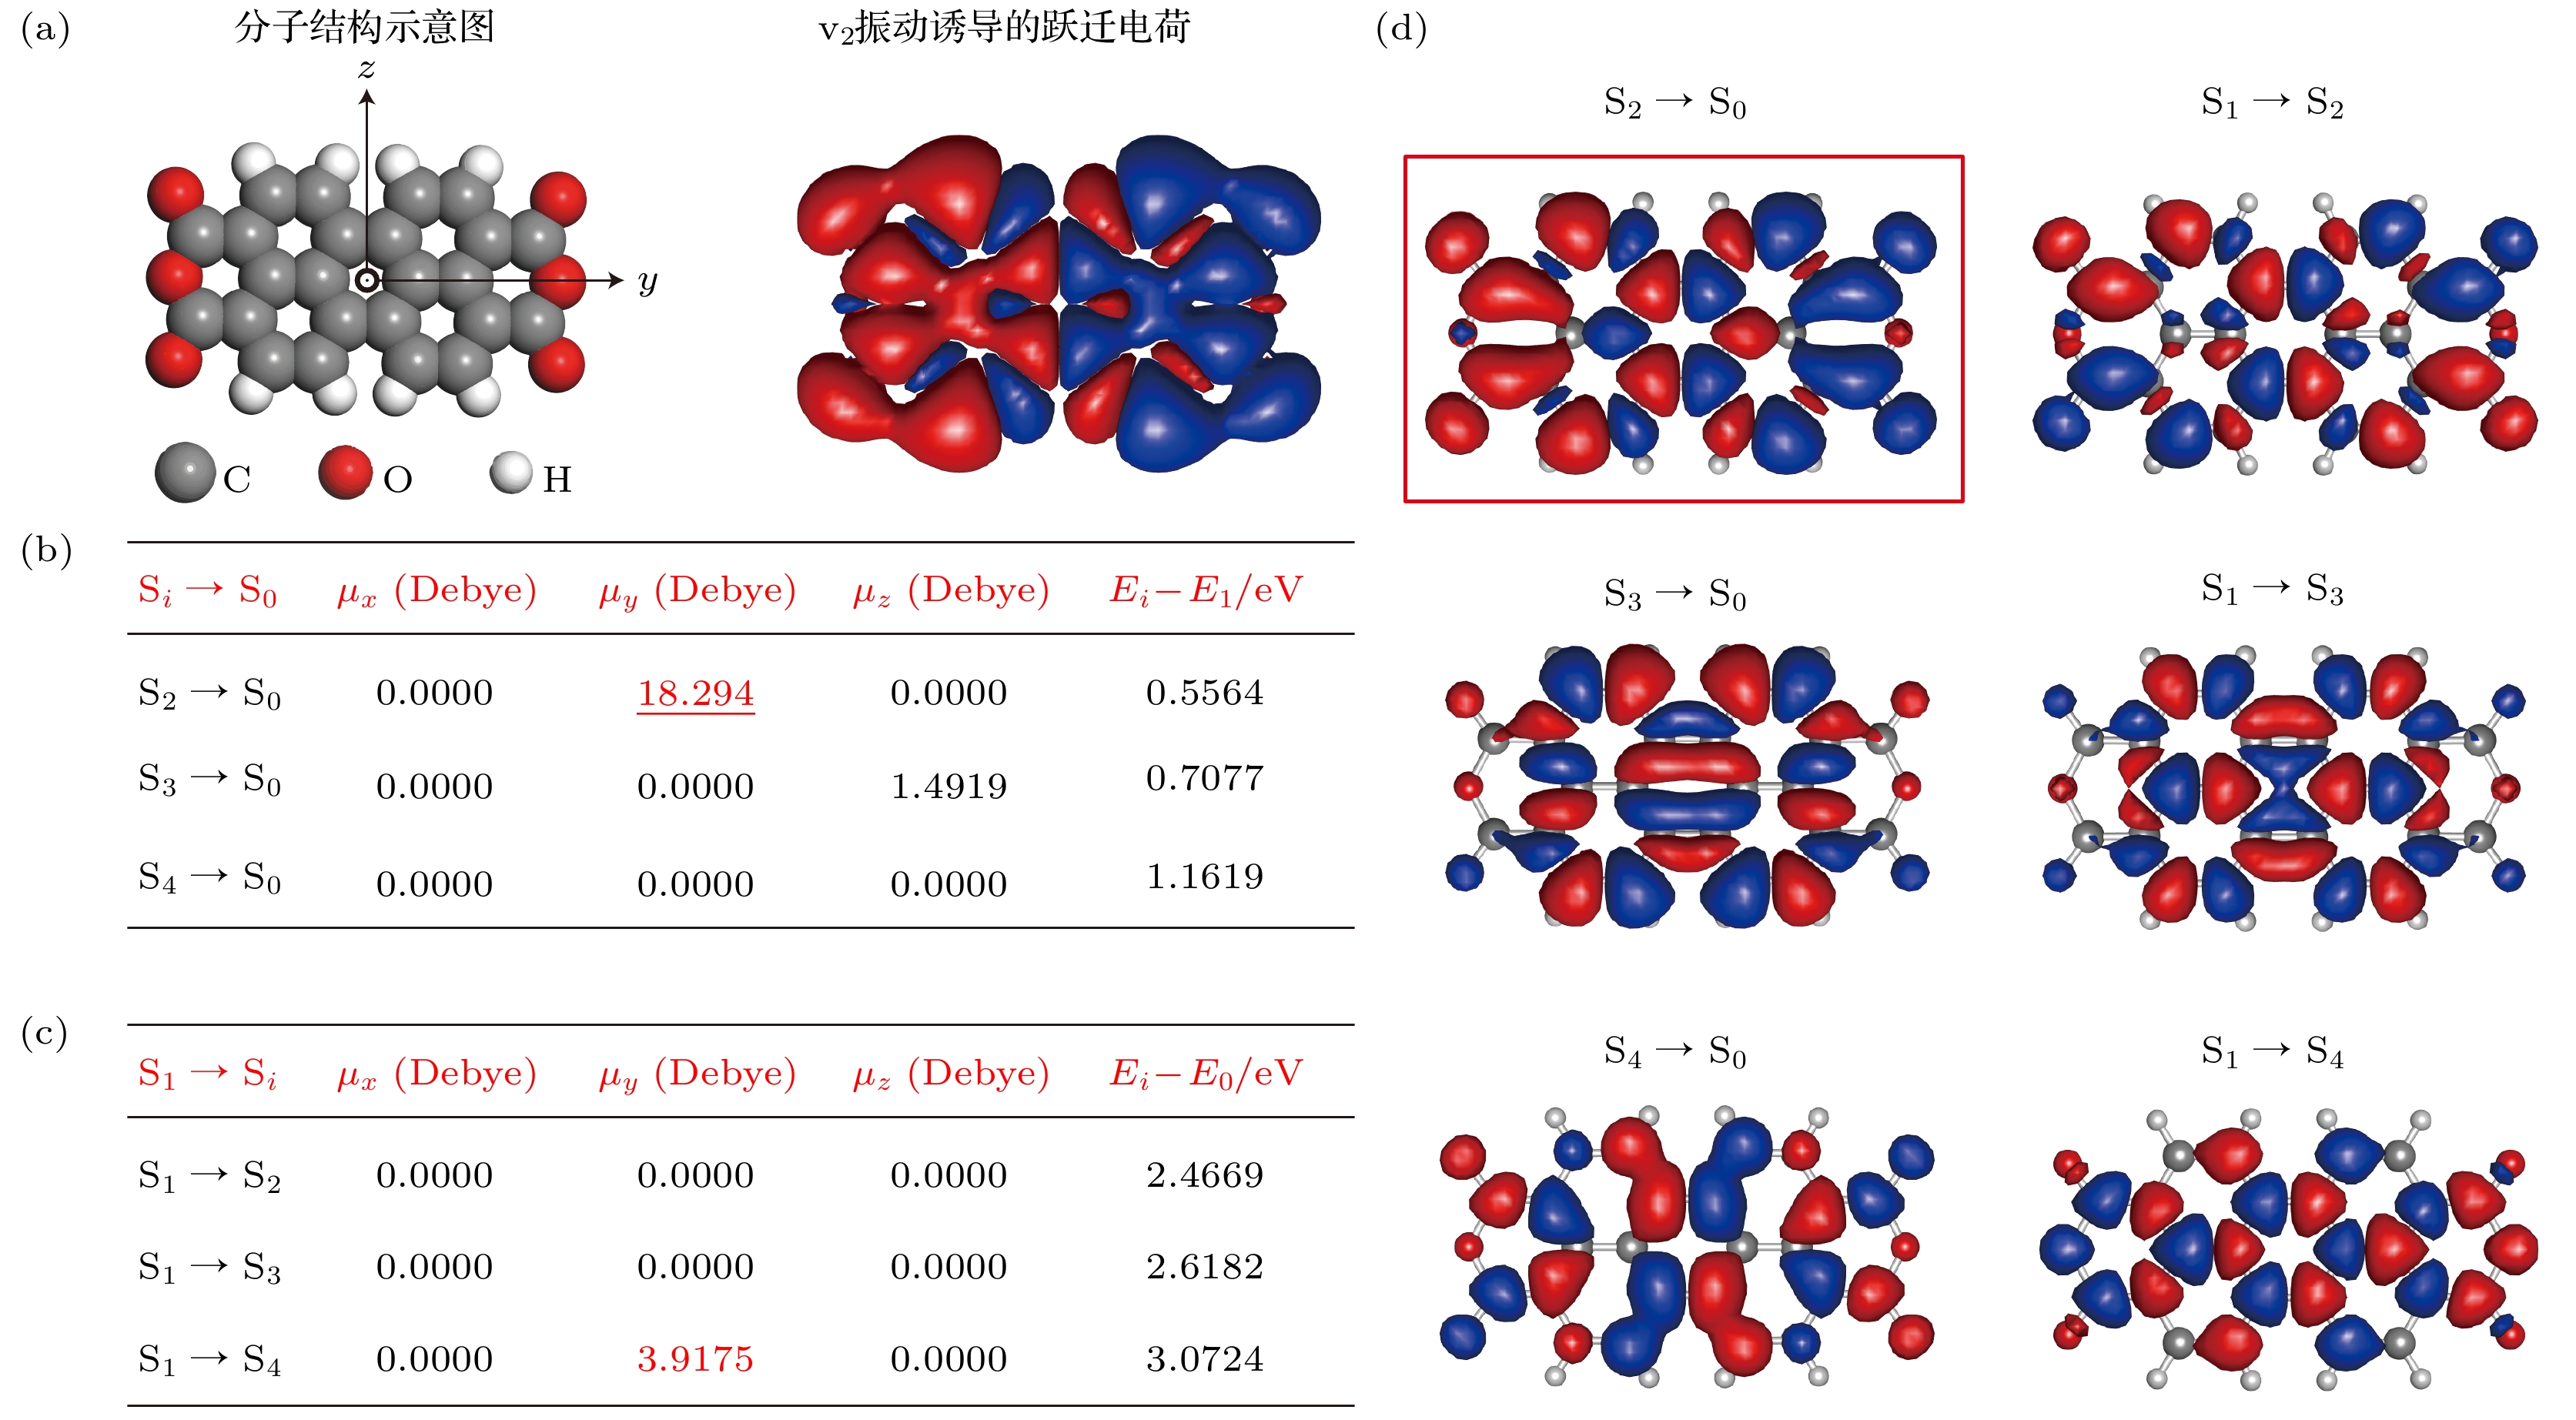
图 4 理论模拟的跃迁偶极矩和跃迁密度分布 (a)左图为PTCDA分子结构示意图, 为方便与不同跃迁的跃迁密度进行比较, 右图再次展示了理论计算的–2价态的PTCDA分子的v2模式振动诱导的跃迁电荷分布图; (b), (c)理论计算的沿着x, y和z方向的不同电子态间的跃迁偶极大小以及对应能量差; (d)理论模拟的不同电子态间跃迁的跃迁密度图
Figure 4. Simulated transition dipole moments and transition densities. (a) Left: molecular structure of a PTCDA. Right: calculated vibration-induced transition charges for the v2 mode, which is shown again to facilitate the comparison with other transition densities between different electronic states given in the figure. (b), (c) Calculated values of the transition dipoles between different electronic states along x, y and z directions and the corresponding energy differences. (d) Simulated different transition densities between different electronic states.
-
[1] Atkins P, Friedman R 2011 Molecular Quantum Mechanics (Oxford: Oxford University Press)
[2] McHale J L 2017 Molecular Spectroscopy (CRC Press)
[3] Fisher G 1984 Vibronic Coupling: The Interaction between the Electronic and Nuclear Motions (London: Academic Press)
[4] Azumi T, Matsuzaki K 1977 Photochem. Photobiol. 25 315
Google Scholar
[5] Born M, Oppenheimer R 1927 Ann. Phys. (Leipzig) 389 457
[6] Franck J, Dymond E 1926 Trans. Faraday Soc. 21 536
Google Scholar
[7] Condon E U 1928 Phys. Rev. 32 858
Google Scholar
[8] Herzberg G, Teller E 1933 Z. Phys. Chem. 21 410
[9] Hestand N J, Spano F C 2018 Chem. Rev. 118 7069
Google Scholar
[10] Qiu X H, Nazin G V, Ho W 2003 Science 299 542
Google Scholar
[11] Dong Z C, Guo X L, Trifonov A S, Dorozhkin P S, Miki K, Kimura K, Yokoyama S, Mashiko S 2004 Phys. Rev. Lett. 92 086801
Google Scholar
[12] Cavar E, Blum M C, Pivetta M, Patthey F, Chergui M, Schneider W D 2005 Phys. Rev. Lett. 95 196102
Google Scholar
[13] Dong Z C, Zhang X L, Gao H Y, Luo Y, Zhang C, Chen L G, Zhang R, Tao X, Zhang Y, Yang J L, Hou J G 2010 Nat. Photonics 4 50
Google Scholar
[14] Zhang Y, Luo Y, Zhang Y, Yu Y J, Kuang Y M, Zhang L, Meng Q S, Luo Y, Yang J L, Dong Z C, Hou J G 2016 Nature 531 623
Google Scholar
[15] Imada H, Miwa K, Imai-Imada M, Kawahara S, Kimura K, Kim Y 2016 Nature 538 364
Google Scholar
[16] Doppagne B, Chong M C, Bulou H, Boeglin A, Scheurer F, Schull G 2018 Science 361 251
Google Scholar
[17] Kimura K, Miwa K, Imada H, Imai-Imada M, Kawahara S, Takeya J, Kawai M, Galperin M, Kim Y 2019 Nature 570 210
Google Scholar
[18] Kuhnke K, Grosse C, Merino P, Kern K 2017 Chem. Rev. 117 5174
Google Scholar
[19] Chen C, Chu P, Bobisch C A, Mills D L, Ho W 2010 Phys. Rev. Lett. 105 217402
Google Scholar
[20] Doppagne B, Chong M C, Lorchat E, Berciaud S, Romeo M, Bulou H, Boeglin A, Scheurer F, Schull G 2017 Phys. Rev. Lett. 118 127401
Google Scholar
[21] Imada H, Miwa K, Imai-Imada M, Kawahara S, Kimura K, Kim Y 2017 Phys. Rev. Lett. 119 013901
Google Scholar
[22] Kong F F, Tian X J, Zhang Y, Yu Y J, Jing S H, Zhang Y, Tian G J, Luo Y, Yang J L, Dong Z C, Hou J G 2021 Nat. Commun. 12 1280
Google Scholar
[23] Haruta N, Sato T, Tanaka K 2012 J. Org. Chem. 77 9702
Google Scholar
[24] Chaudhuri S, Hedstrom S, Mendez-Hernandez D D, Hendrickson H P, Jung K A, Ho J, Batista V S 2017 J. Chem. Theory Comput. 13 6000
Google Scholar
[25] Xue B, Wilhelm M J, Han J, Dai H-L 2021 J. Phys. Chem. A 125 9065
Google Scholar
[26] Cochrane K A, Roussy T S, Yuan B, Tom G, Mårsell E, Burke S A 2018 J. Phys. Chem. C 122 8437
Google Scholar
[27] Beneduci A, Cospito S, La Deda M, Veltri L, Chidichimo G 2014 Nat. Commun. 5 3105
Google Scholar
[28] Kaim W, Fiedler J 2009 Chem. Soc. Rev. 38 3373
Google Scholar
[29] Cochrane K A, Schiffrin A, Roussy T S, Capsoni M, Burke S A 2015 Nat. Commun. 6 8312
Google Scholar
[30] Zhang L, Yu Y J, Chen L G, Luo Y, Yang B, Kong F F, Chen G, Zhang Y, Zhang Q, Luo Y, Yang J L, Dong Z C, Hou J G 2017 Nat. Commun. 8 580
Google Scholar
[31] Tchenio P, Myers A B, Moerner W E 1993 J. Phys. Chem. 97 2491
Google Scholar
[32] Murray C, Dozova N, McCaffrey J G, Shafizadeh N, Chin W, Broquier M, Crepin C 2011 Phys. Chem. Chem. Phys. 13 17543
Google Scholar
[33] Chong M C, Reecht G, Bulou H, Boeglin A, Scheurer F, Mathevet F, Schull G 2016 Phys. Rev. Lett. 116 036802
Google Scholar
[34] Chen G, Luo Y, Gao H Y, Jiang J, Yu Y J, Zhang L, Zhang Y, Li X G, Zhang Z Y, Dong Z C 2019 Phys. Rev. Lett. 122 177401
Google Scholar
[35] Zhang Y, Meng Q S, Zhang L, Luo Y, Yu Y J, Yang B, Zhang Y, Esteban R, Aizpurua J, Luo Y, Yang J L, Dong Z C, Hou J G 2017 Nat. Commun. 8 15225
Google Scholar
[36] Niu Y L, Peng Q, Deng C M, Gao X, Shuai Z 2010 J. Phys. Chem. A 114 7817
[37] Barone V, Bloino J, Biczysko M 2009 GAUSSIAN 09 Revision A2
[38] Duan S, Tian G J, Ji Y F, Shao J S, Dong Z C, Luo Y 2015 J. Am. Chem. Soc. 137 9515
Google Scholar
[39] Zhang Y, Dong Z C, Aizpurua J 2020 J. Phys. Chem. C 124 4674
Google Scholar
[40] Long D A 2002 The Raman Effect: A Unified Treatment of the Theory of Raman Scattering by Molecules (John Wiley & Sons Ltd.)

 DownLoad:
Catalog
Metrics
- Abstract views: 8498
- PDF Downloads: 215
- Cited By: 0
