


-
The acceleration of urbanization has rendered accurate prediction of intra-urban population mobility a fundamental requirement for urban planning and policy formulation. However, the adaptability and performance of existing mobility models on different spatial scales are still poorly understood, and there is a clear lack of a systematic evaluation framework that integrates spatial granularity, travel distance, and population heterogeneity. This study addresses these gaps by proposing a cross-scale comparative framework to evaluate three representative mobility models under varying urban conditions: the gravity model (GM), the radiation model (RM), and the population-weighted opportunities model (PWO). Using high-resolution mobile phone data from Shanghai, we construct three groups of controlled experiments to assess the performance of the model on spatial (grid size), distance, and population density scales. Furthermore, the multivariate analysis of variance (MANOVA) is further used to decompose the relative contributions of different spatial factors to prediction errors.The results indicate that there is distinct scale sensitivity between the models. Based on Newton’s principle of gravity, the GM exhibits high robustness over longer distances (>5 km), but its performance decreases under fine spatial granularity due to spatial heterogeneity. GM accuracy improves with population density but decreases significantly when regional area disparity exceeds a threshold, with prediction performance dropping by over 40% when grid size difference exceeds 3 km. The RM, based on the nearest-best-opportunity assumption, performs well for short-distance, origin-driven flows, such as commuting, but introduces systematic bias on a small scales. Its sensitivity to origin population density renders it more suitable for high-density urban cores. The PWO model enhances RM by combining destination population weights, demonstrating superior compatibility with spatial heterogeneity in dense and polycentric cities. Although it performs best in short distances (<5 km) PWO will fail as the driving distance increases.The MANOVA results demonstrate that GM is primarily influenced by population density and area scale, whereas RM and PWO exhibit greater sensitivity to distance and destination-related factors. On the basis of these findings, we propose a model selection strategy suitable for mobility drivers: GM is recommended for long-distance traffic prediction in spatially homogeneous regions, while PWO is recommended for short distance traffic prediction between densely populated small areas. RM serves as a complementary model when origin-driven flows dominate.This study not only elucidates the physical mechanisms behind the performance of scale-dependent model but also provides an actionable decision-making framework for model selection in different urban mobility scenarios. Future research will further improve predictive accuracy through the following methods: 1) developing hybrid models that integrate strengths of multiple frameworks; 2) incorporating multi-source spatial data (e.g. POIs land use); 3) coupling traditional models with deep learning approaches to enhance non-linear pattern recognition while maintaining interpretability.By revealing the scale sensitivity of mobility models, this work lays theoretical and methodological foundations for multi-scenario mobility prediction in smart city planning and fine-grained urban governance.
[1] Batty M 2008 Science 319 769
 Google Scholar
[2] Andrienko G, Andrienko N, Boldrini C, Caldarelli G, Cintia P, Cresci S, Facchini A, Giannotti F, Gionis A, Guidotti R, Mathioudakis M, Muntean C I, Pappalardo L, Pedreschi D, Pournaras E, Pratesi F, Tesconi M, Trasarti R 2021 Int. J. Data. Sci. Anal. 11 311
Google Scholar
[3] Barbosa H, Barthelemy M, Ghoshal G, James C R, Lenormand M, Louail T, Menezes R, Ramasco J J, Simini F, Tomasini M 2018 Phys. Rep. 734 1
Google Scholar
[4] Xu Y, Belyi A, Bojic I, Ratti C 2018 Comput. Environ. Urban Syst. 72 51
Google Scholar
[5] Guo Y T, Peeta S 2020 Travel Behav. Soc. 19 99
Google Scholar
[6] Helbing D 2001 Rev. Mod. Phys. 73 1067
Google Scholar
[7] Toole J L, Colak S, Sturt B, Alexander L P, Evsukoff A, González M C 2015 Transp. Res. Part C Emerging Technol. 58 162
Google Scholar
[8] Voukelatou V, Gabrielli L, Miliou I, Cresci S, Sharma R, Tesconi M, Pappalardo L 2021 Int. J. Data. Sci. Anal. 11 279
Google Scholar
[9] Louf R, Barthelemy M 2014 Sci. Rep. 4 5561
Google Scholar
[10] Hufnagel L, Brockmann D, Geisel T 2004 Proc. Natl. Acad. Sci. 101 15124
Google Scholar
[11] Xiong C F, Hu S H, Yang M F, Luo W Y, Zhang L 2020 Proc. Natl. Acad. Sci. 117 27087
Google Scholar
[12] NaDai M D, Xu Y Y, Letouzé E, González M C, Lepri B 2020 Sci. Rep. 10 13871
Google Scholar
[13] Simini F, Barlacchi G, Luca M, Pappalardo L 2021 Nat. Commun. 12 6576
Google Scholar
[14] Yao X, Gao Y, Zhu D, Manley E, Wang J, Liu Y 2021 IEEE Trans. Intell. Transp. Syst. 22 7474
Google Scholar
[15] Liu Z C, Miranda F, Xiong W T, Yang J Y, Wang Q, Silva C 2020 AAAI 34 808
Google Scholar
[16] Dai G N, Hu X Y, Ge Y M, Ning Z Q, Liu Y B 2021 Front. Comput. Sci. 15 152317
Google Scholar
[17] Tian C J, Zhu X N, Hu Z, Ma J 2020 Appl. Intell. 50 3057
Google Scholar
[18] Luca M, Barlacchi G, Lepri B, Pappalardo L 2023 ACM Comput. Surv. 55 1
[19] Zipf G K 1946 Am. Sociol. Rev. 11 677
Google Scholar
[20] Goh S, Lee K, Park J S, Choi M Y 2012 Phys. Rev. E 86 26102
Google Scholar
[21] Krings G, Calabrese F, Ratti C, Blondel V D 2009 J. Stat. Mech: Theory Exp. 200 9
[22] Prieto Curiel R, Pappalardo L, Gabrielli L, Bishop S R 2018 PLoS One 1 3
[23] Wang Y X, Li X, Yao X, Li S, Liu Y 2022 Ann. Am. Assoc. Geogr. 112 1441
[24] Brockmann D, Helbing D 2013 Science 342 1337
Google Scholar
[25] Stouffer S A 1940 Am. Sociol. Rev. 5 845
Google Scholar
[26] Ortúzar J D D, Willumsen L G 2011 Modelling Transport (1st Ed.) (Hoboken: Wiley) pp207–208
[27] Simini F, González M C, Maritan A, Barabási A L 2012 Nature 484 96
Google Scholar
[28] Yan X Y, Zhao C, Fan Y, Di Z R, Wang W X 2014 J. R. Soc. Interface 11 20140834
Google Scholar
[29] Liu E J, Yan X Y 2019 Physica A 526 121023
Google Scholar
[30] Liu E J, Yan X Y 2020 Sci. Rep. 10 4657
Google Scholar
[31] Yan X Y, Zhou T 2019 Sci. Rep. 9 9466
Google Scholar
[32] Lawson H C, Dearinger J A 1967 J. Highw. Div. 93 1
[33] Liang X, Zhao J C, Dong L, Xu K 2013 Sci. Rep. 3 2983
Google Scholar
[34] Okabe A 1976 Reg. Sci. Urban Econ. 6 381
Google Scholar
[35] Hong I, Jung W S, Jo H H 2019 PLoS One 1 4
[36] Kluge L, Schewe J 2021 Phys. Rev. E 104 54311
Google Scholar
[37] Piovani D, Arcaute E, Uchoa G, Wilson A, Batty M 2018 R. Soc. Open Sci. 5 171668
Google Scholar
[38] Stefanouli M, Polyzos S 2017 Transp. Res. Procedia 24 65
Google Scholar
[39] Yang Y X, Herrera C, Eagle N, González M C 2014 Sci. Rep. 4 5662
Google Scholar
[40] Heydari S, Huang Z, Hiraoka T, De León Chávez A P, Ala-Nissila T, Leskelä L, Kivelä M, Saramäki J 2023 Travel Behav. Soc. 31 93
Google Scholar
[41] Masucci A P, Serras J, Johansson A, Batty M 2013 Phys. Rev. E 88 22812
Google Scholar
[42] Palchykov V, Mitrović M, Jo H H, Saramäki J, Pan R K 2014 Sci. Rep. 4 6174
Google Scholar
[43] Lenormand M, Bassolas A, Ramasco J J 2016 J. Transp. Geogr. 51 158
Google Scholar
[44] Lenormand M, Huet S, Gargiulo F, Deffuant G 2012 PLoS One 7 e45985
Google Scholar
[45] Gargiulo F, Lenormand M, Huet S, Baqueiro Espinosa O 2012 JASSS. 15 6
-
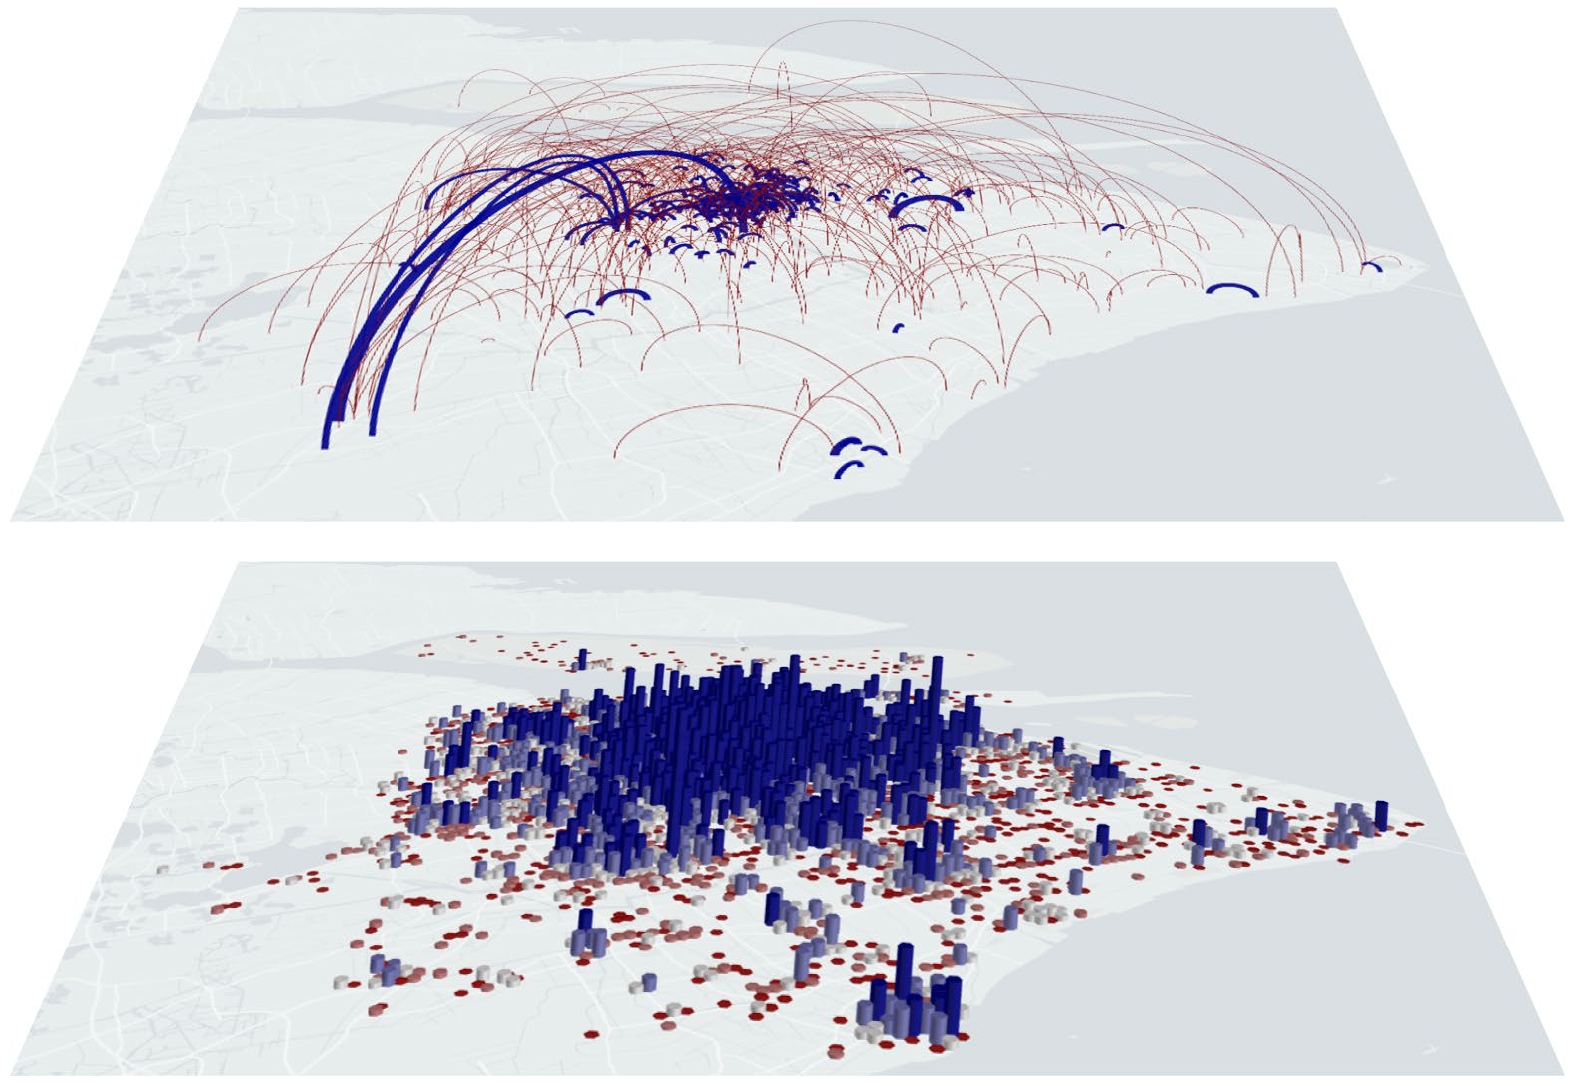
图 1 上海市人口及流量空间分布. 上图呈现了上海市人口流动的空间分布特征(基于抽样数据), 其中流量大小通过线条粗细和颜色深浅表示(流量越大, 线条越粗且颜色越偏蓝色); 下图展示了上海市各网格单元的人口规模分布情况, 其中网格内人口数量与柱状图高度呈正相关, 并通过颜色梯度表示(人口越多, 柱状图越高且颜色越偏蓝色; 人口越少, 柱状图越低且颜色越偏红色)
Figure 1. Spatial distribution of population and flow in Shanghai. The upper panel depicts the spatial pattern of population flow (based on sampled data), where the magnitude of flow is represented by both the thickness of the lines and the intensity of the color (greater flow is denoted by thicker lines with bluer tones). The lower panel illustrates the population distribution across grid cells in Shanghai, where the population size within each grid is represented by both the height of the bar and a color gradient (higher population corresponds to taller bars with bluer hues, while lower population is indicated by shorter bars with redder hues).
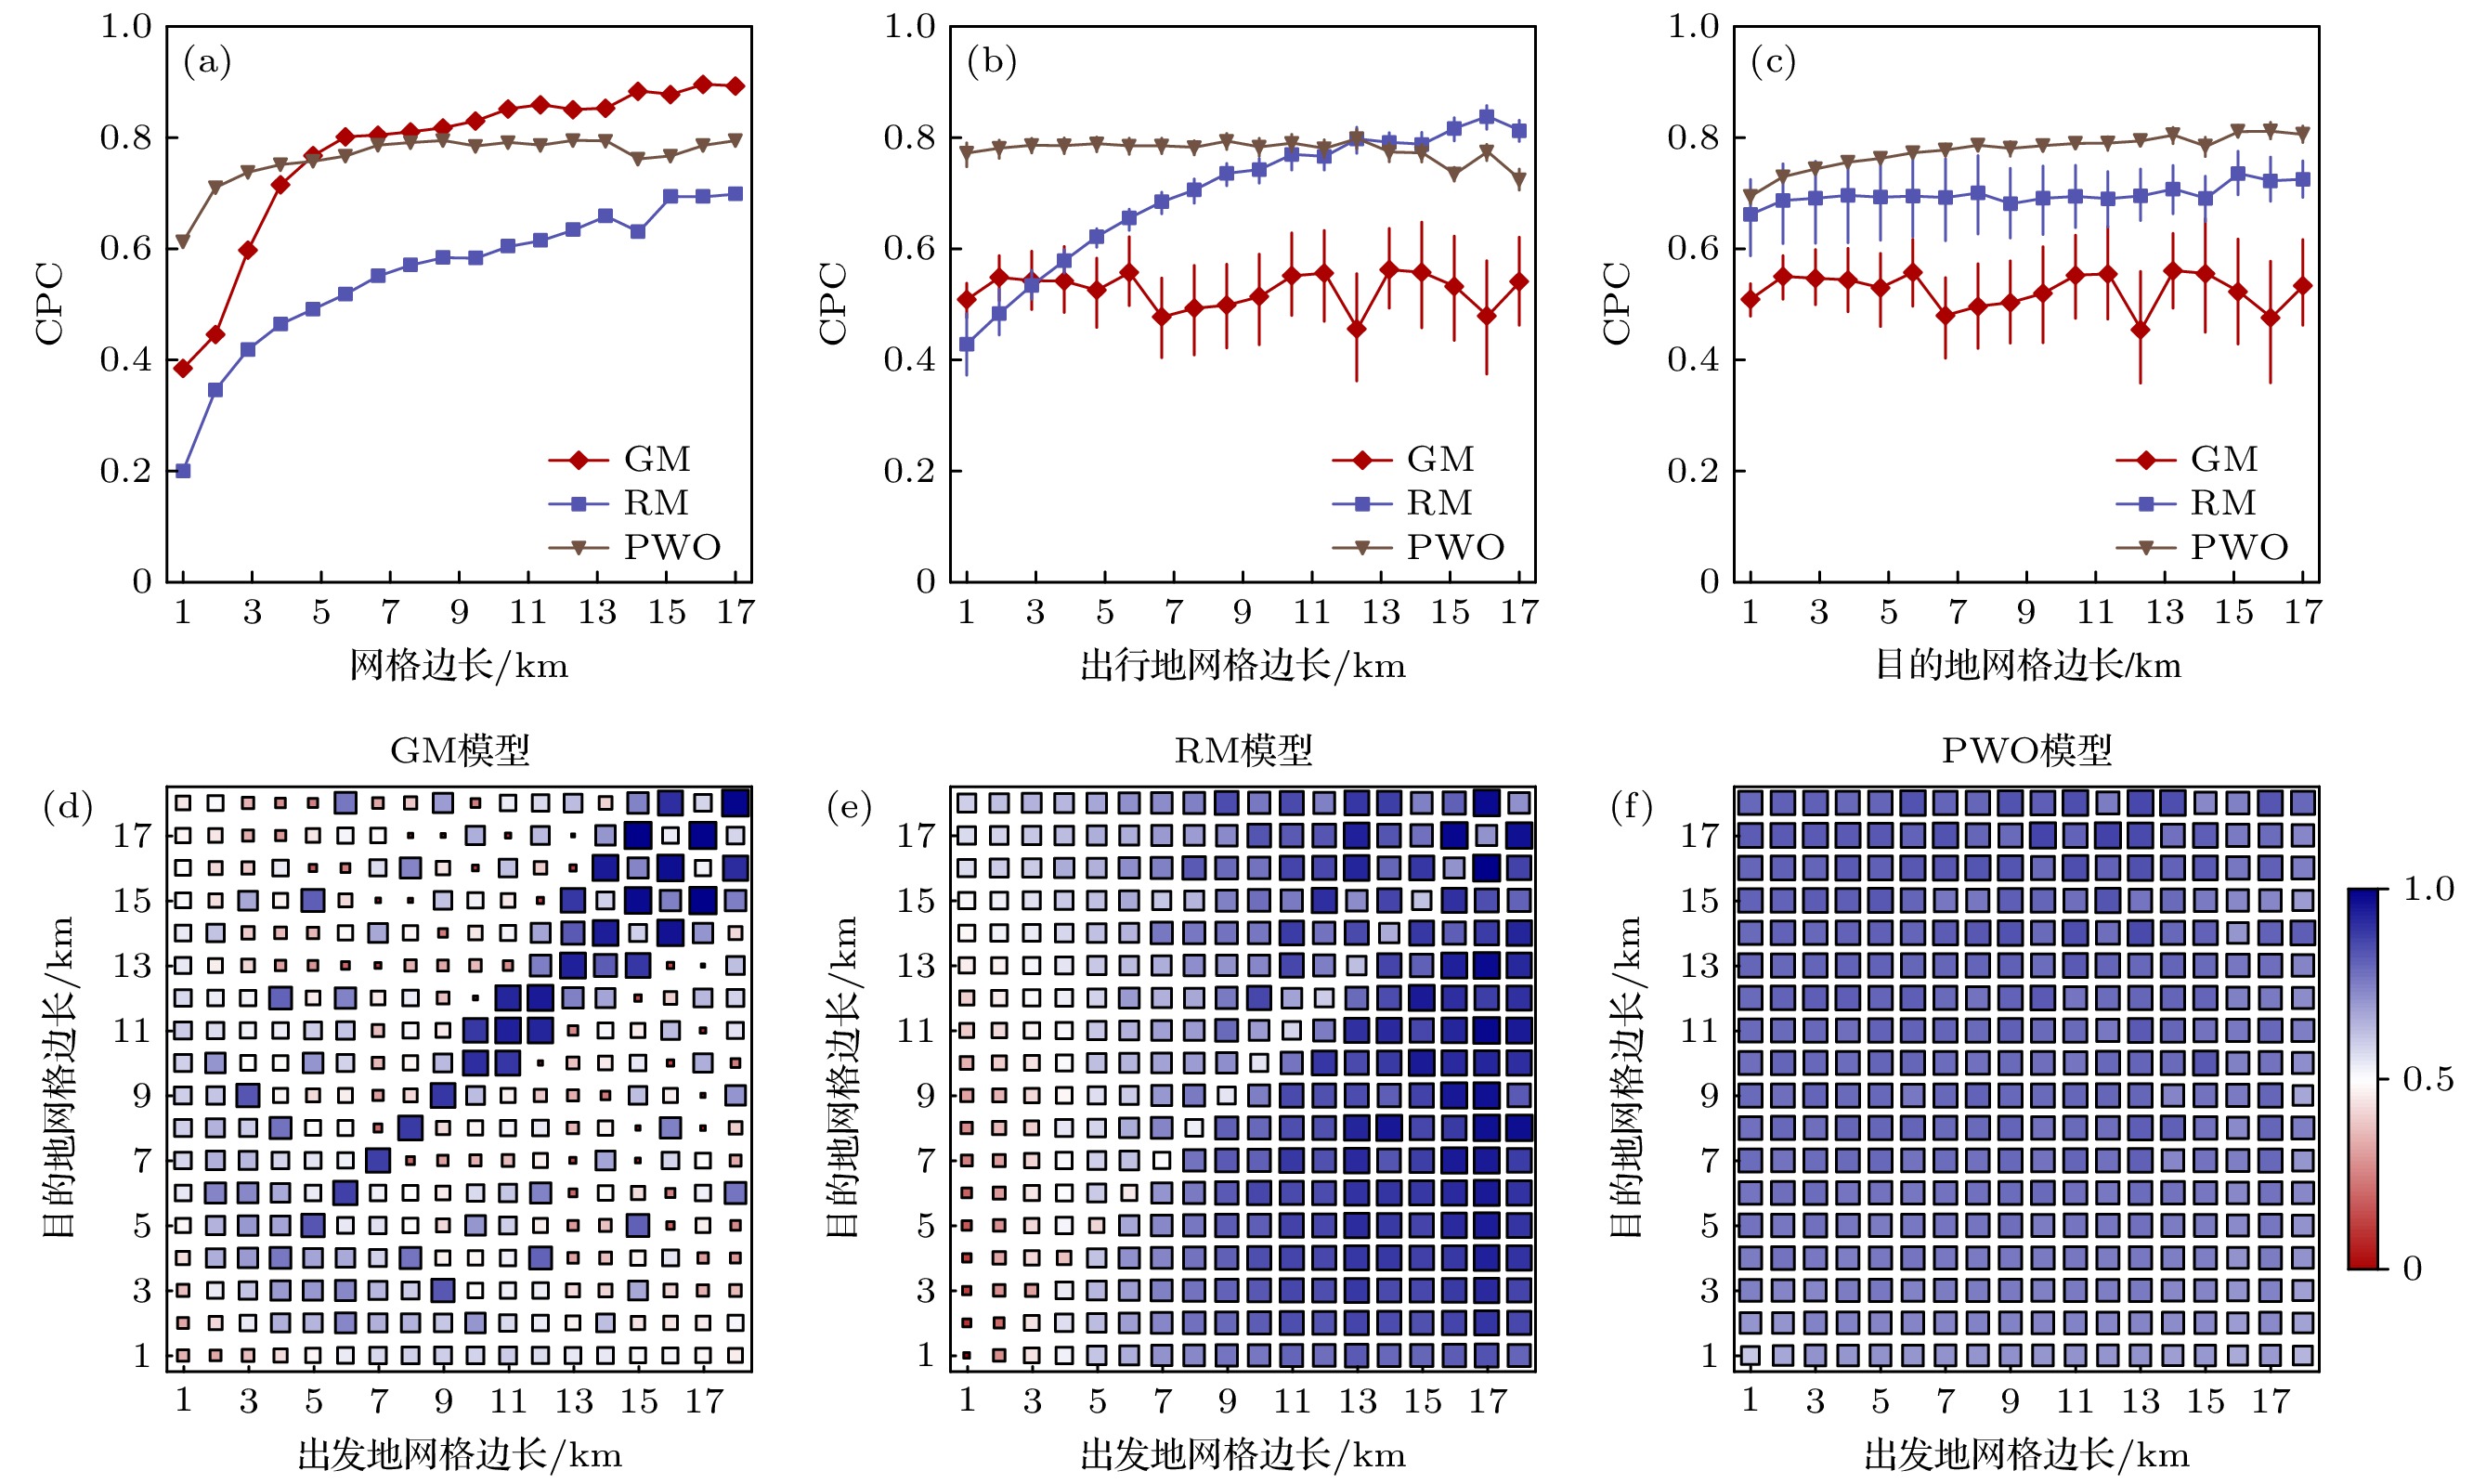
图 2 不同网格尺度下模型效果 (a)出发地和目的地网格尺度相等时模型预测效果; (b)出发地网格尺度对模型效果的影响; (c)目的地网格尺度对模型效果的影响; (d)—(f) GM模型、RM模型、PWO模型关于不同网格尺度下的效果热力图
Figure 2. The model performance at different grid scales: (a) The prediction performance of the model when the grid scales of the origin and destination are equal; (b) the impact of the grid scale of the origin on the model performance; (c) the impact of the grid scale of the destination on the model performance; (d)–(f) heatmaps of the performance of the gravity model, radiation model, and PWO model at different grid scales.
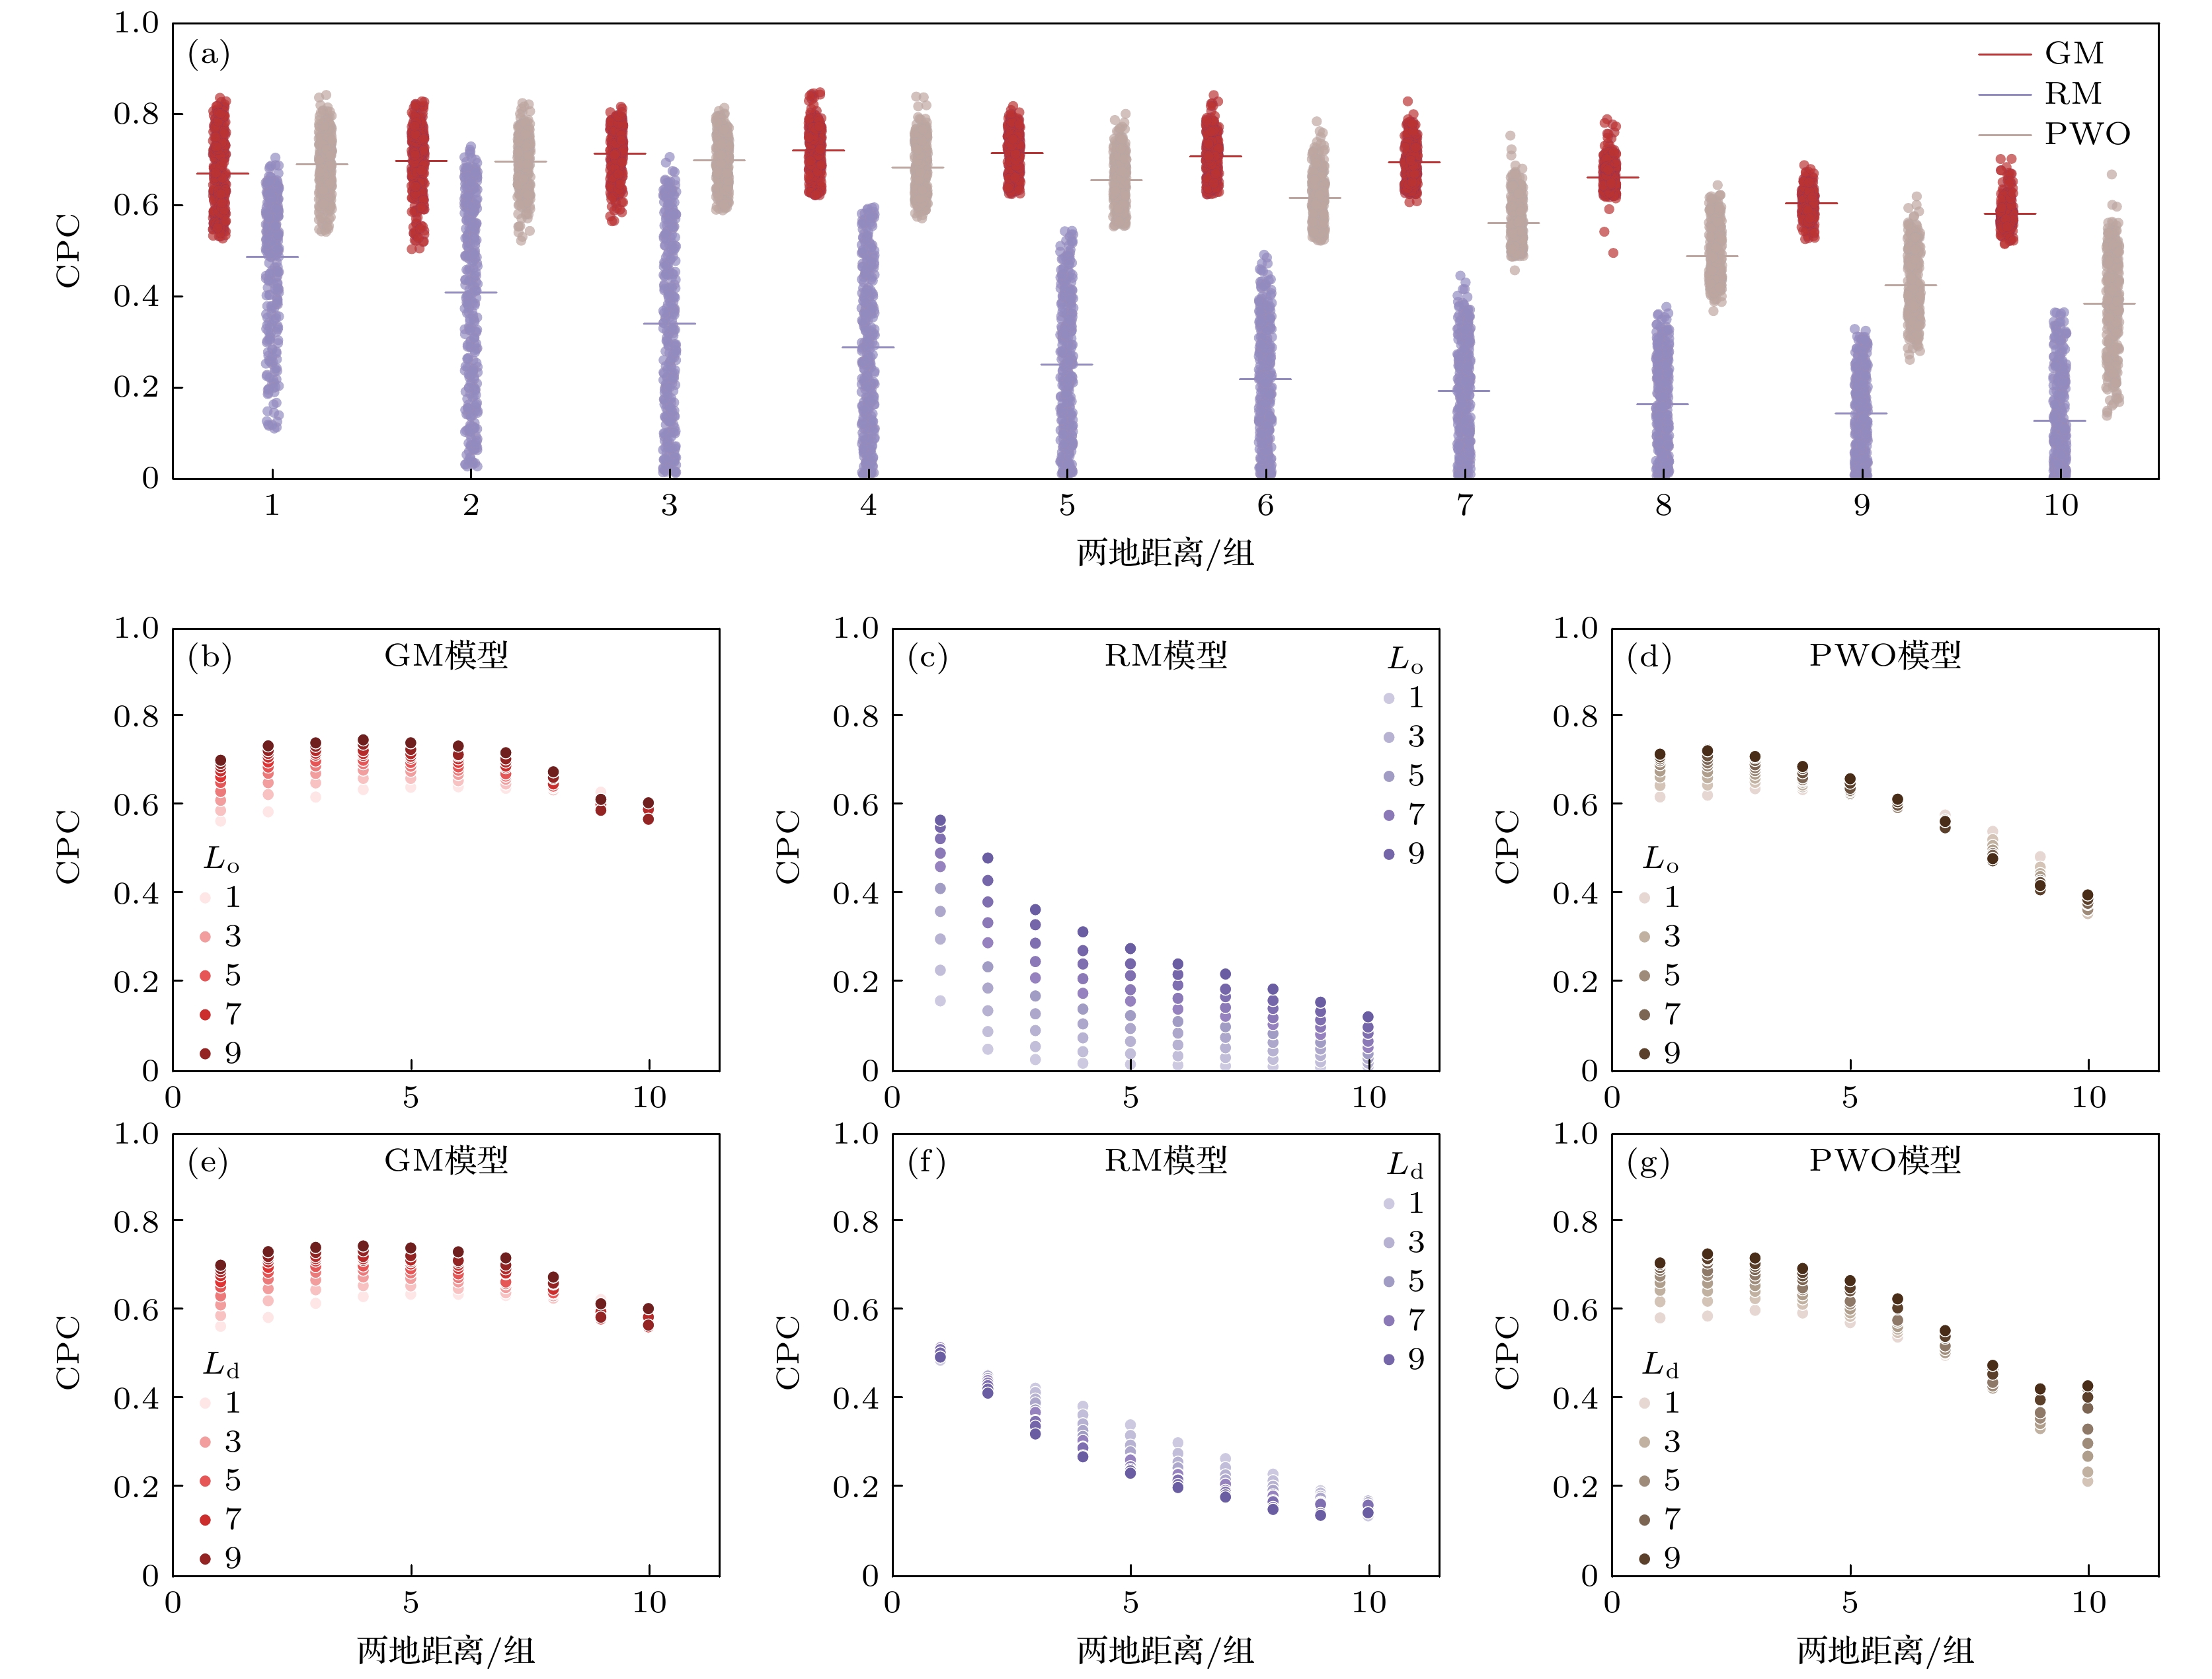
图 3 不同距离尺度下模型效果 (a)三种模型在不同距离尺度下的CPC值; (b)—(d)出发地空间尺度和距离尺度的交互效应, 出发地网格边长$ L_o $越大, 颜色越深; (e)—(f)目的地空间尺度和距离尺度的交互效应, 目的地网格边长$ L_{\mathrm{d}} $越大, 颜色越深
Figure 3. Model performance at different distance scales: (a) CPC values of the three models at different distance scales; (b)–(d) interaction effects between origin spatial scale and distance scale; (e)–(f) interaction effects between destination spatial scale and distance scale.
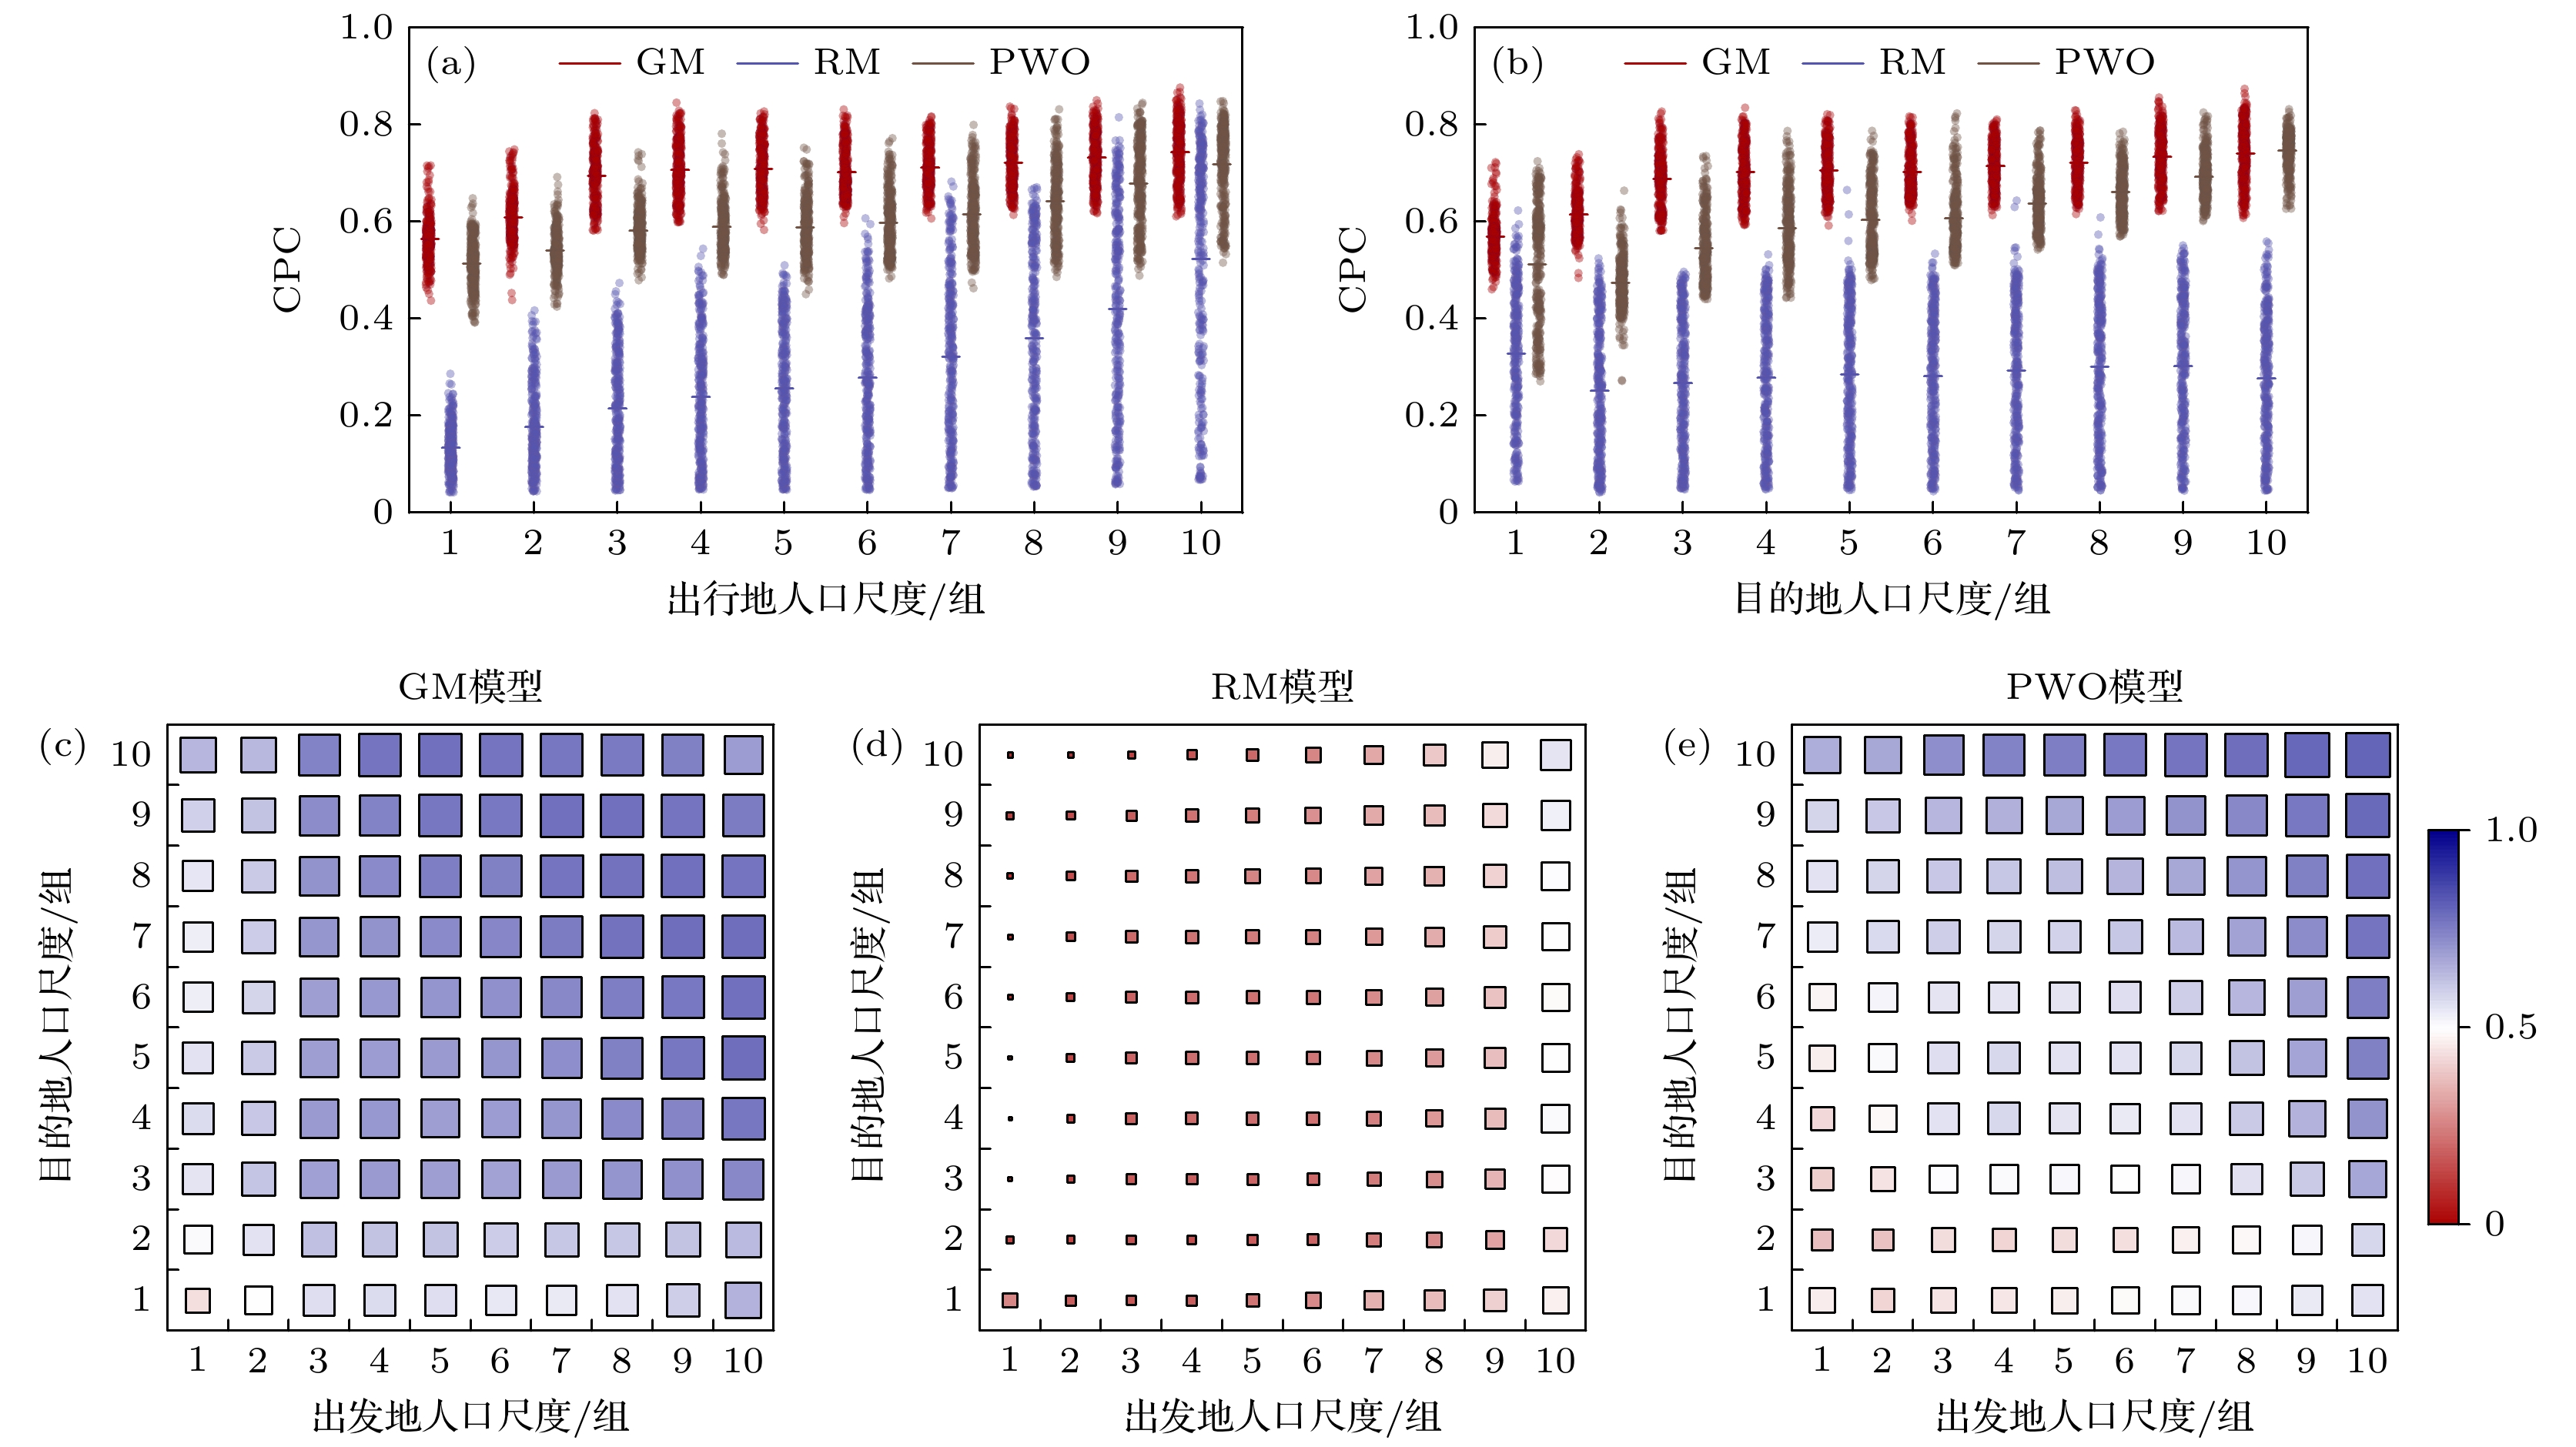
图 4 不同人口密度尺度下模型效果 (a)出发地人口密度对模型效果的影响; (b)目的地人口密度对模型效果的影响; (c)—(e) GM模型、RM模型、PWO模型关于不同人口密度尺度下的效果热力图
Figure 4. Model performance at different population density scales: (a) The impact of origin population density on model performance; (b) the impact of destination population on model performance; (c)–(e) heatmaps showing the performance of the gravity model, radiation model, and PWO model across different population scales.
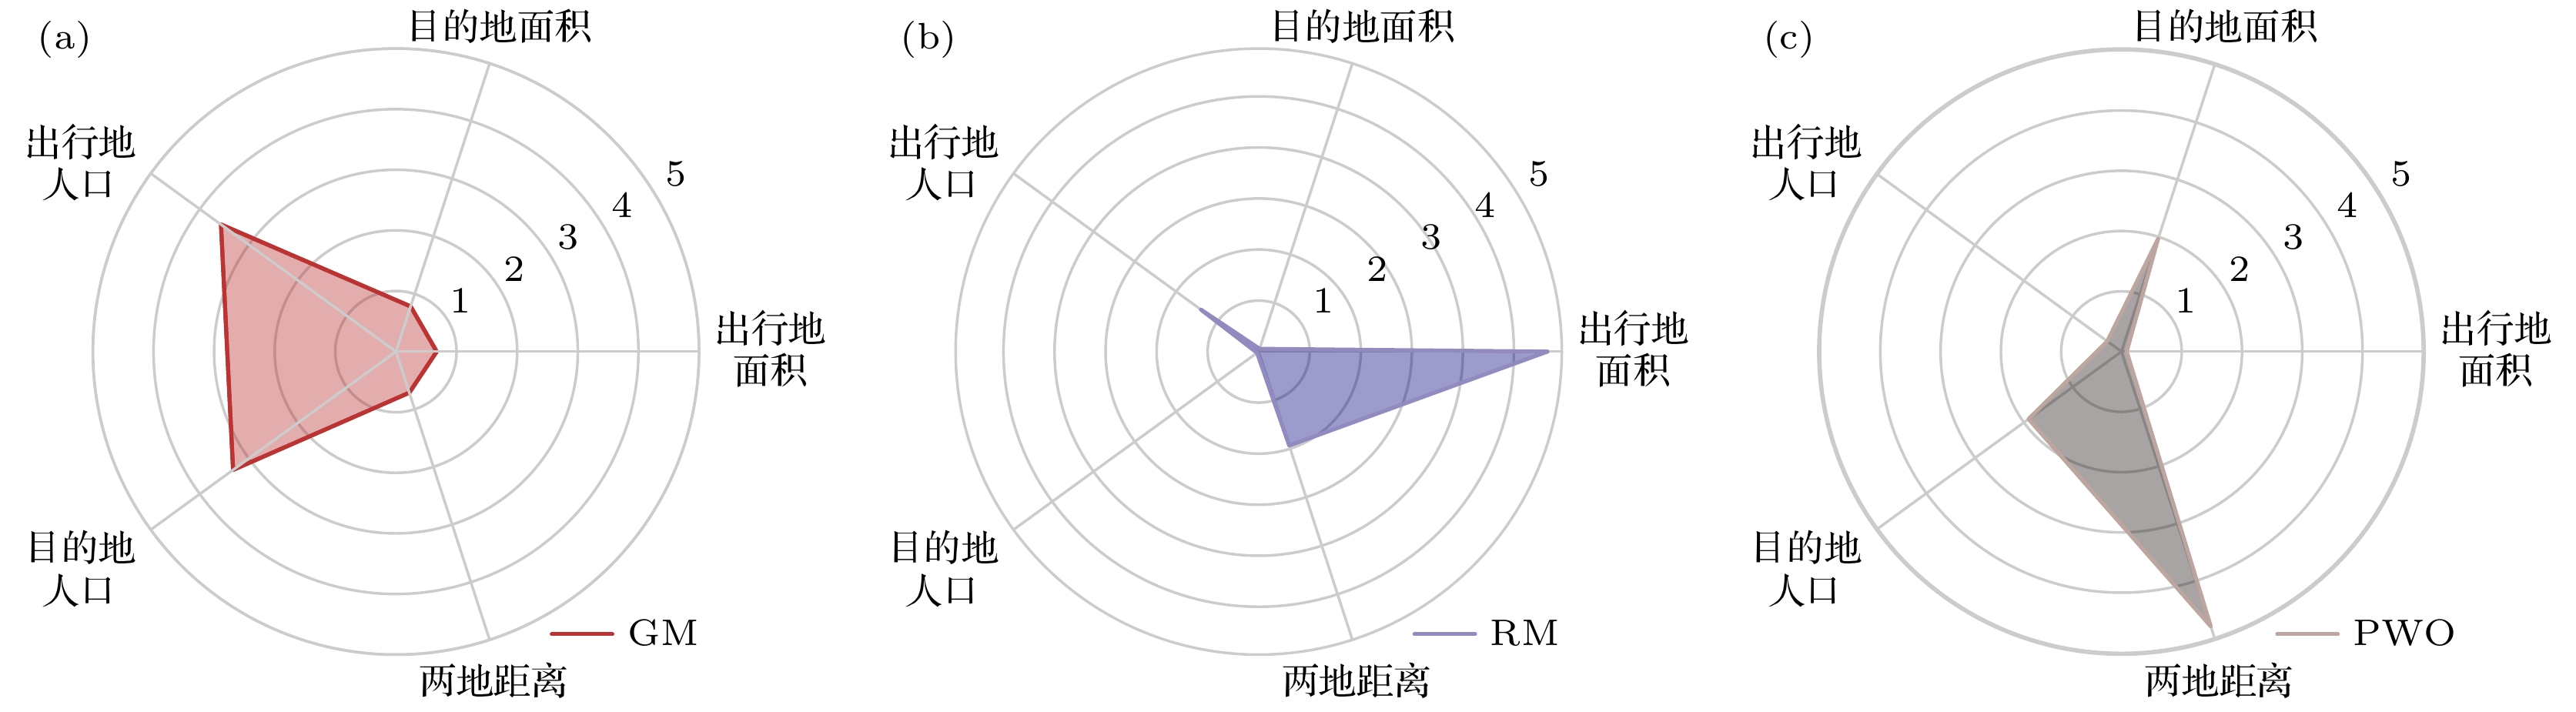
图 5 不同因素对模型性能的影响雷达图. 因素对应的值越大, 该因素对模型的影响越大
Figure 5. Radar chart of the impact of different factors on model performance. The longer the edge of a factor, the greater its influence on the model.
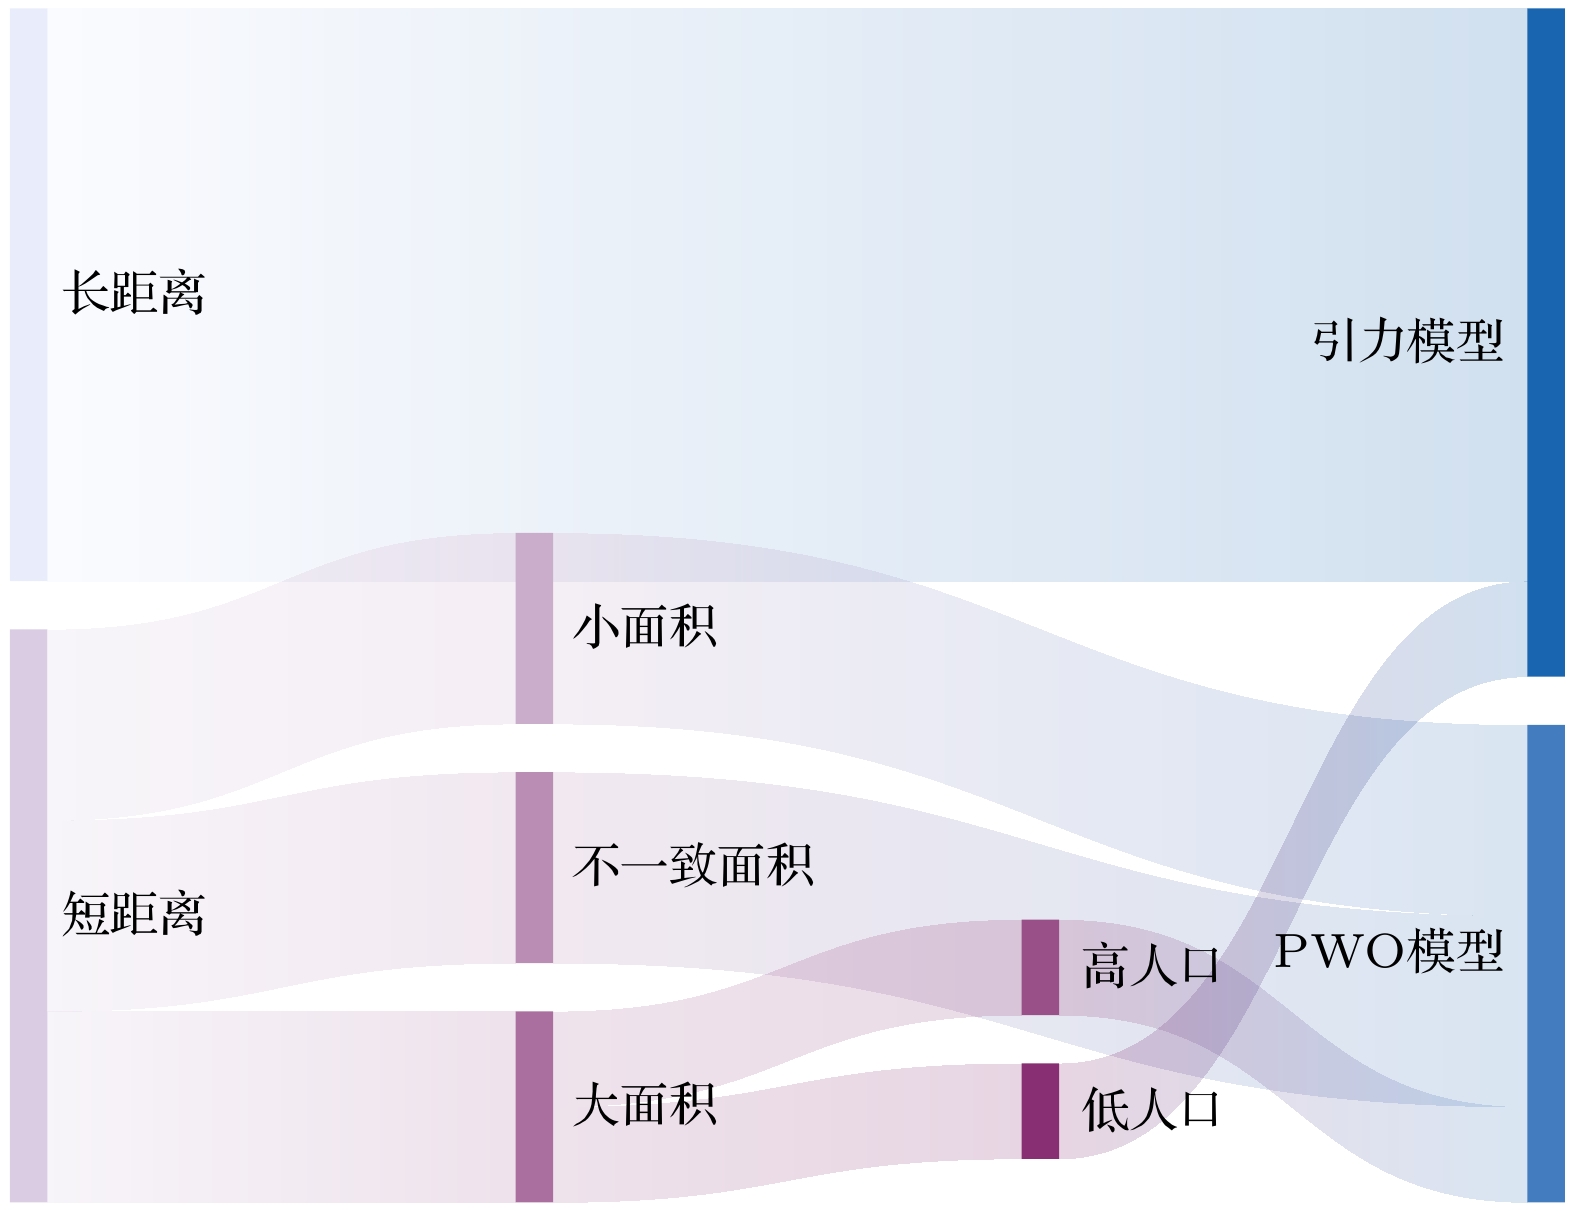
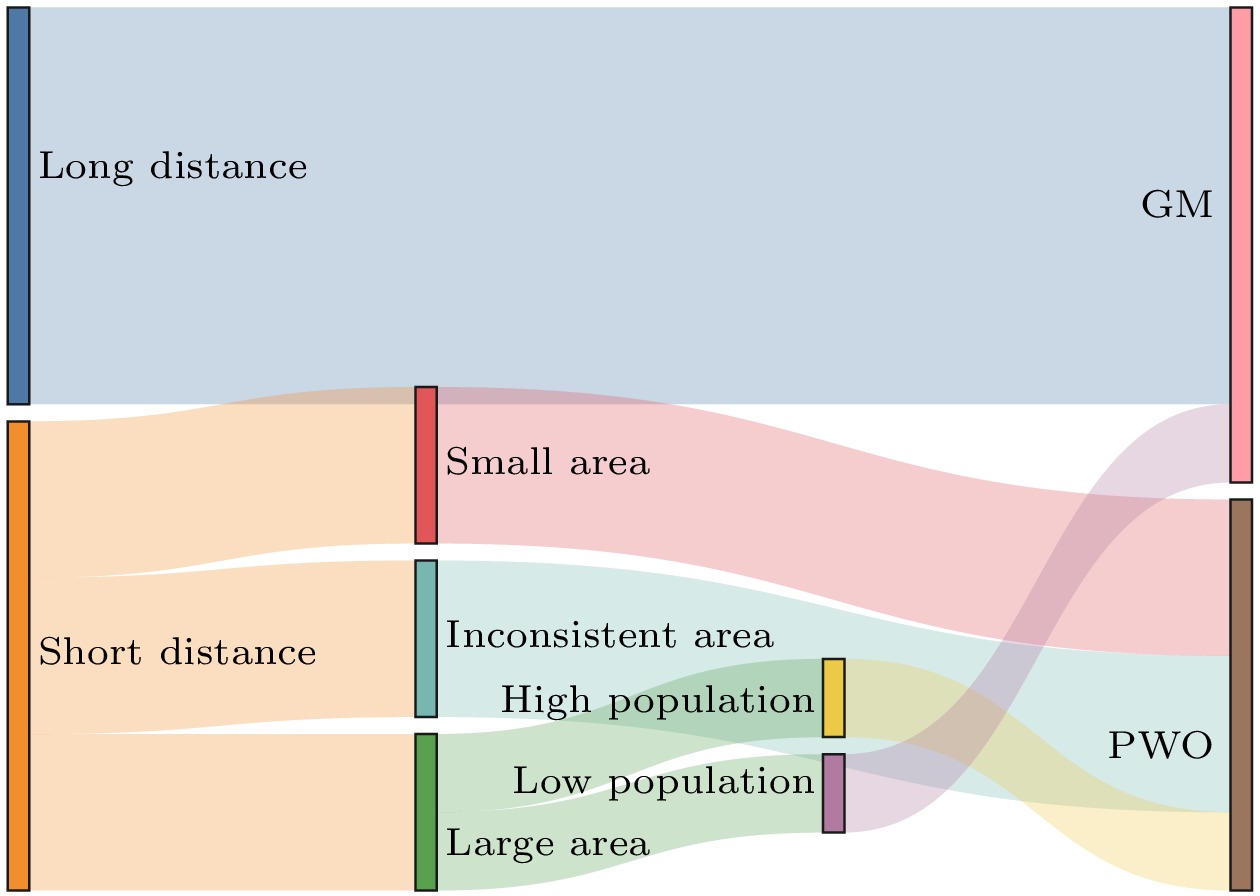
图 6 跨尺度场景下的模型选择
Figure 6. Model selection in cross-scale scenario.
表 1 不同模型多因素方差分析(ANOVA)结果
Table 1. Results of multi-factor ANOVA for different models.
因素 GM RM PWO F $ P_{\mathrm{R}} > F $ F $ P_{\mathrm{R}} > F $ F $ P_{\mathrm{R}} > F$ 出发地面积 9010 0 604629 0 180 0 目的地面积 10912 0 58721 0 38511 0 出发地面积∶的地面积 9073 0 5132 0 1117 0 出发地人口密度 65161 0 179437 0 20934 0 目的地人口密度 61262 0 1587 0 127280 0 两地距离 688 0 321208 0 262932 0  DownLoad: CSV
-
[1] Batty M 2008 Science 319 769
Google Scholar
[2] Andrienko G, Andrienko N, Boldrini C, Caldarelli G, Cintia P, Cresci S, Facchini A, Giannotti F, Gionis A, Guidotti R, Mathioudakis M, Muntean C I, Pappalardo L, Pedreschi D, Pournaras E, Pratesi F, Tesconi M, Trasarti R 2021 Int. J. Data. Sci. Anal. 11 311
Google Scholar
[3] Barbosa H, Barthelemy M, Ghoshal G, James C R, Lenormand M, Louail T, Menezes R, Ramasco J J, Simini F, Tomasini M 2018 Phys. Rep. 734 1
Google Scholar
[4] Xu Y, Belyi A, Bojic I, Ratti C 2018 Comput. Environ. Urban Syst. 72 51
Google Scholar
[5] Guo Y T, Peeta S 2020 Travel Behav. Soc. 19 99
Google Scholar
[6] Helbing D 2001 Rev. Mod. Phys. 73 1067
Google Scholar
[7] Toole J L, Colak S, Sturt B, Alexander L P, Evsukoff A, González M C 2015 Transp. Res. Part C Emerging Technol. 58 162
Google Scholar
[8] Voukelatou V, Gabrielli L, Miliou I, Cresci S, Sharma R, Tesconi M, Pappalardo L 2021 Int. J. Data. Sci. Anal. 11 279
Google Scholar
[9] Louf R, Barthelemy M 2014 Sci. Rep. 4 5561
Google Scholar
[10] Hufnagel L, Brockmann D, Geisel T 2004 Proc. Natl. Acad. Sci. 101 15124
Google Scholar
[11] Xiong C F, Hu S H, Yang M F, Luo W Y, Zhang L 2020 Proc. Natl. Acad. Sci. 117 27087
Google Scholar
[12] NaDai M D, Xu Y Y, Letouzé E, González M C, Lepri B 2020 Sci. Rep. 10 13871
Google Scholar
[13] Simini F, Barlacchi G, Luca M, Pappalardo L 2021 Nat. Commun. 12 6576
Google Scholar
[14] Yao X, Gao Y, Zhu D, Manley E, Wang J, Liu Y 2021 IEEE Trans. Intell. Transp. Syst. 22 7474
Google Scholar
[15] Liu Z C, Miranda F, Xiong W T, Yang J Y, Wang Q, Silva C 2020 AAAI 34 808
Google Scholar
[16] Dai G N, Hu X Y, Ge Y M, Ning Z Q, Liu Y B 2021 Front. Comput. Sci. 15 152317
Google Scholar
[17] Tian C J, Zhu X N, Hu Z, Ma J 2020 Appl. Intell. 50 3057
Google Scholar
[18] Luca M, Barlacchi G, Lepri B, Pappalardo L 2023 ACM Comput. Surv. 55 1
[19] Zipf G K 1946 Am. Sociol. Rev. 11 677
Google Scholar
[20] Goh S, Lee K, Park J S, Choi M Y 2012 Phys. Rev. E 86 26102
Google Scholar
[21] Krings G, Calabrese F, Ratti C, Blondel V D 2009 J. Stat. Mech: Theory Exp. 200 9
[22] Prieto Curiel R, Pappalardo L, Gabrielli L, Bishop S R 2018 PLoS One 1 3
[23] Wang Y X, Li X, Yao X, Li S, Liu Y 2022 Ann. Am. Assoc. Geogr. 112 1441
[24] Brockmann D, Helbing D 2013 Science 342 1337
Google Scholar
[25] Stouffer S A 1940 Am. Sociol. Rev. 5 845
Google Scholar
[26] Ortúzar J D D, Willumsen L G 2011 Modelling Transport (1st Ed.) (Hoboken: Wiley) pp207–208
[27] Simini F, González M C, Maritan A, Barabási A L 2012 Nature 484 96
Google Scholar
[28] Yan X Y, Zhao C, Fan Y, Di Z R, Wang W X 2014 J. R. Soc. Interface 11 20140834
Google Scholar
[29] Liu E J, Yan X Y 2019 Physica A 526 121023
Google Scholar
[30] Liu E J, Yan X Y 2020 Sci. Rep. 10 4657
Google Scholar
[31] Yan X Y, Zhou T 2019 Sci. Rep. 9 9466
Google Scholar
[32] Lawson H C, Dearinger J A 1967 J. Highw. Div. 93 1
[33] Liang X, Zhao J C, Dong L, Xu K 2013 Sci. Rep. 3 2983
Google Scholar
[34] Okabe A 1976 Reg. Sci. Urban Econ. 6 381
Google Scholar
[35] Hong I, Jung W S, Jo H H 2019 PLoS One 1 4
[36] Kluge L, Schewe J 2021 Phys. Rev. E 104 54311
Google Scholar
[37] Piovani D, Arcaute E, Uchoa G, Wilson A, Batty M 2018 R. Soc. Open Sci. 5 171668
Google Scholar
[38] Stefanouli M, Polyzos S 2017 Transp. Res. Procedia 24 65
Google Scholar
[39] Yang Y X, Herrera C, Eagle N, González M C 2014 Sci. Rep. 4 5662
Google Scholar
[40] Heydari S, Huang Z, Hiraoka T, De León Chávez A P, Ala-Nissila T, Leskelä L, Kivelä M, Saramäki J 2023 Travel Behav. Soc. 31 93
Google Scholar
[41] Masucci A P, Serras J, Johansson A, Batty M 2013 Phys. Rev. E 88 22812
Google Scholar
[42] Palchykov V, Mitrović M, Jo H H, Saramäki J, Pan R K 2014 Sci. Rep. 4 6174
Google Scholar
[43] Lenormand M, Bassolas A, Ramasco J J 2016 J. Transp. Geogr. 51 158
Google Scholar
[44] Lenormand M, Huet S, Gargiulo F, Deffuant G 2012 PLoS One 7 e45985
Google Scholar
[45] Gargiulo F, Lenormand M, Huet S, Baqueiro Espinosa O 2012 JASSS. 15 6

 DownLoad:
Catalog
Metrics
- Abstract views: 1486
- PDF Downloads: 39
- Cited By: 0
