


-
太阳风电荷交换是太阳风粒子与行星大气中性粒子碰撞过程中的一种非弹性碰撞过程, 碰撞相伴产生软X射线辐射, 对行星大气的演化起着重要的影响. 中欧联合卫星——太阳风与地球磁层相互作用全景成像(SMILE)正是利用这种X射线辐射研究太阳风与地球大气相互作用的全局性结构. 但这种辐射对天体弥散X射线源研究是一种重要的干扰, 直接影响对目标源的观测分析. 电荷交换辐射因子是分析空间X射线探测器观测数据(包括中国空间站建议载荷—银河系热重子探寻计划(DIXE)和爱因斯坦探针(EP))的关键物理量. 本文采用美国先进成分空间探测器(ACE) 13年(1998—2011年)的探测数据, 结合前期发展的辐射分析模型, 研究了不同时间段和不同太阳风起源的电荷交换辐射因子, 并与前人结果进行比较, 统计分析揭示了其随太阳风参数的变化规律, 即平均辐射因子随太阳风质子数密度增大快速变小并达到稳定值, 而随太阳风速度增大而缓慢变大并在vsw > 430 km/s趋于恒定. 冕物质抛射的辐射因子比冕流和冕洞的大, 太阳活动强周期的辐射因子比弱周期的大.
This study aims to quantify the solar wind charge-exchange (SWCX) X-ray emission factor (denoted as α-value) and its dependence on solar wind parameters, solar activity cycle, and solar wind origin. By analyzing 13-year (1998–2011) in-situ measurements from the advanced composition explorer (ACE) spacecraft, we investigate the statistical correlations between solar wind ionization states, elemental abundances (particularly oxygen), and bulk plasma parameters (proton speed, density). The derived α-values are critical for explaining the data from solar wind and magnetosphere interaction linker explorer (SMILE), and disentangling SWCX foreground emissions from diffuse astrophysical X-ray sources observed by Einstein Probe (EP) and proposed diffuse X-ray explorer (DIXE) payload on Chinese space station. In this work, high-resolution solar wind ion composition data and plasma parameters from ACE are investigated. Events are categorized by solar wind origin (coronal holes, streamers, interplanetary coronal mass ejections (ICMEs)) and solar cycle phase (minimum vs. maximum). The α-value, defined as the total soft X-ray photon emission cross section per solar wind proton, is computed using an updated charge-exchange model that combines the state-resolved cross-section for highly charged ions. The model takes into consideration the velocity-dependent cross-section of solar wind-neutral interaction. Statistical method and bin-averaging techniques are adopted to extract the relations between α, solar wind speed (vsw), proton density (np), and oxygen abundance. The main results are as follows. 1) Ionization state dynamics: A strong anti-correlation exists between solar wind ionization degree and bulk speed: high-speed winds (> 500 km/s) exhibit lower ionization states than slow-speed winds (< 400 km/s). 2) Elemental abundance trends: Oxygen abundance ([O/H]) is inversely correlated with np: the [O/H] of denser solar wind plasmas (np > 13 cm–3) decreases by 30%–50%, indicating the presence of fractionation during plasma acceleration. No significant speed dependence of [O/H] is observed, compared with earlier research results. 3) Emission factor (α-value) behavior: α-value decreases rapidly with the increase of np and stabilizes for np > 13 cm−3. Conversely, α-value increases gradually with vsw up to 430 km/s, beyond which it plateaus. The ICME-associated α exceeds streamer and coronal hole values by 35%–60%, which is attributed to higher averaged ionic state in transient ejecta. Solar maximum α (2000–2002) is 1.3–2.7 times higher than solar minimum (2008–2010), reflecting cycle-dependent ion composition changes. By bridging in-situ solar wind measurements and X-ray emission physics, this work enhances the ability to diagnose solar wind-magnetosphere coupling and diffuse X-ray background. The validated α-value will be of benefit to the data analysis for Chinese aerospace projects in the 2020s, such as SMILE, DIXE, and EP. -
Keywords:
- solar wind /
- charge-exchange /
- X-ray emission factor
[1] Snowden S L, Freyberg M J, Plucinsky P P, Schmitt J H M M, Trümper J, Voges W, Edgar R J, McCammon D, Sanders W T 1995 Astrophys. J. 454 643
 Google Scholar
[2] Snowden S L, Egger R, Freyberg M J, McCammon D, Plucinsky P P, Sanders W T, Schmitt J H M M, Trümper J, Voges W 1997 Astrophys. J. 485 125
Google Scholar
[3] Breitschwerdt D, Freyberg M J, Trümper J 1998 The Local Bubble and Beyond (Berlin: Springer
[4] Lisse C M, Dennerl K, Englhauser J, Harden M, Marshall F E, Mumma M J, Petre R, Pye J P, Ricketts M J, Schmitt J, Trümper J, West R G 1996 Science 274 205
Google Scholar
[5] Cravens T E 1997 Gelphys. Res. Lett. 24 105
Google Scholar
[6] Breitschwerdt D, Freyberg M J, Trümper J 1998 The local bubble and beyond: proceedings of the IAU Colloquim no. 166 Garching, Germany, April 21–25 1997 p121
Breitschwerdt D, Freyberg M J, Trümper J 1998 The local bubble and beyond: proceedings of the IAU Colloquim no. 166 Garching, Germany, April 21–25 1997 p121
[7] Cravens T E 2000 Astrophys. J. 532 L153
Google Scholar
[8] Wargelin B J, Markevitch M, Juda M, Kharchenko V, Edgar R & Dalgarno A 2004 Astrophys. J. 607 596
Google Scholar
[9] Bhardwaj A, Gladstone G R, Elsner R F, et al. 2002 Proc. ESLAB 36 Symposium: Earth-Like Planets and Moons Noordwijk, Netherlands, June 3–8, 2002 pp215–226
[10] Robertson I P, Cravens T E 2003 Gelphys. Res. Lett. 30 1439
Google Scholar
[11] Sembay S, Alme A L, Agnolon D, et al. 2024 Earth Planet. Phys. 8 5
Google Scholar
[12] Beiersdorfer P, Boyce K R, Brown G V, Chen H, Kahn S M, Kelley R L, May M, Olson R E, Porter F S, Stahle C K, Tillotson W A 2003 Science 300 1558
Google Scholar
[13] Zhang R T, Liao T, Zhang C J, Zhou L P, Guo D L, Gao Y, Gu L Y, Zhu X L, Zhang S F, Ma X 2023 Mon. Not. R. Astron. Soc. 520 1417
Google Scholar
[14] Jin H, Mao J J, Chen L B, Chen N H, Cui W, Gao B, Li J J, Li X F, Liu J J, Quan J, Jiang C Y, Wang G L, Wang L, Wang Q, Wang S F, Xiao A M, Zhang S 2024 J. Low Temperature Phys. 215 256
Google Scholar
[15] Sun T R, Connor H, Samsonov A 2024 Earth Planet. Phys. 8 1
Google Scholar
[16] Schwadron N A, Cravens T E 2000 Astrophys. J. 544 558
Google Scholar
[17] Smith R K, Foster A R, Brickhouse N S 2012 Astron. Nachr 333 301
Google Scholar
[18] Gu L Y, Kaastra J, Raassen A J J 2016 Astron. Astrophys. 588 A52
Google Scholar
[19] Cumbee R, Stancil P, Mcilvane S 2021 American Astronomical Society Meeting 238 12601
[20] Liang G Y, Li F, Wang F L, Wu Y, Zhong J Y, Zhao G 2014 Astrophys. J. 783 124
Google Scholar
[21] Liang G Y, Zhu X L, Wei H G, Yuan D W, Zhong J Y, Wu Y, Hutton R, Cui W, Ma X W, Zhao G 2021 Mon. Not. R. Astron. Soc. 508 2194
Google Scholar
[22] Whittaker I C, Sembay S 2016 Gelphys. Res. Lett. 43 7328
Google Scholar
[23] Koutroumpa D 2024 Earth Planet. Phys. 8 105
Google Scholar
[24] Liang G Y, Sun T R, Lu H Y, Zhu X L, Wu Y, Li S B, Wei H G, Yuan D W, Zhong J Y, Cui W, Ma X W, Zhao G 2023 Astrophys. J. 943 85
Google Scholar
[25] Midha J M, Gupta S C 1994 J. Quant. Spectrosc. Radiat. Transfer 52 897
Google Scholar
[26] Wargelin B J, Beiersdorfer P, Brown G V 2008 Can. J. Phys. 86 151
Google Scholar
[27] Zhang R T, Seely D G, Andrianarijaona V M, Draganić I N, Havener C C 2022 Astrophys. J. 931 1
Google Scholar
[28] Wu Y, Stancil P C, Schultz D R, Hui Y, Liebermann H P, Buenker R J 2012 J. Phs. B: At. Mol. Opt. Phys. 45 235201
Google Scholar
[29] Nolte J L, Stancil P C, Liebermann H P, Buenker R J, Hui Y, Schultz D R 2012 J. Phs. B: At. Mol. Opt. Phys. 45 245202
Google Scholar
[30] Liu L, Wu Y, Wang J G, Janev R K 2022 At. Data & Nuclear Data Tables 143 101464
Google Scholar
[31] Janev R K, Winter H 1985 Phys. Rep. 117 265
Google Scholar
[32] Royal Observatory of Belgium, Brussels (Sunspot Number catalogue ‘1998-2012’) http://www.sidc.be/SILSO/
[33] Landi E, Gruesbeck J R, Lepri S T, Zurbuchen T H, Fisk L A 2012 Astrophys. J. 761 48
Google Scholar
[34] Zhao L, Zurbuchen T H, Fisk L A 2009 Gelphys. Res. Lett. 36 L14104
Google Scholar
[35] Zhao L, Landi E, Lepri S T, Kocher M, Zurbuchen T H, Fisk L A, Raines M J 2017 Astrophys. J. Supp. Ser. 228 4
Google Scholar
[36] Zhang C, Ling Z X, Sun X J, et al. 2022 Astrophys. J. Lett. 941 L2
Google Scholar
-
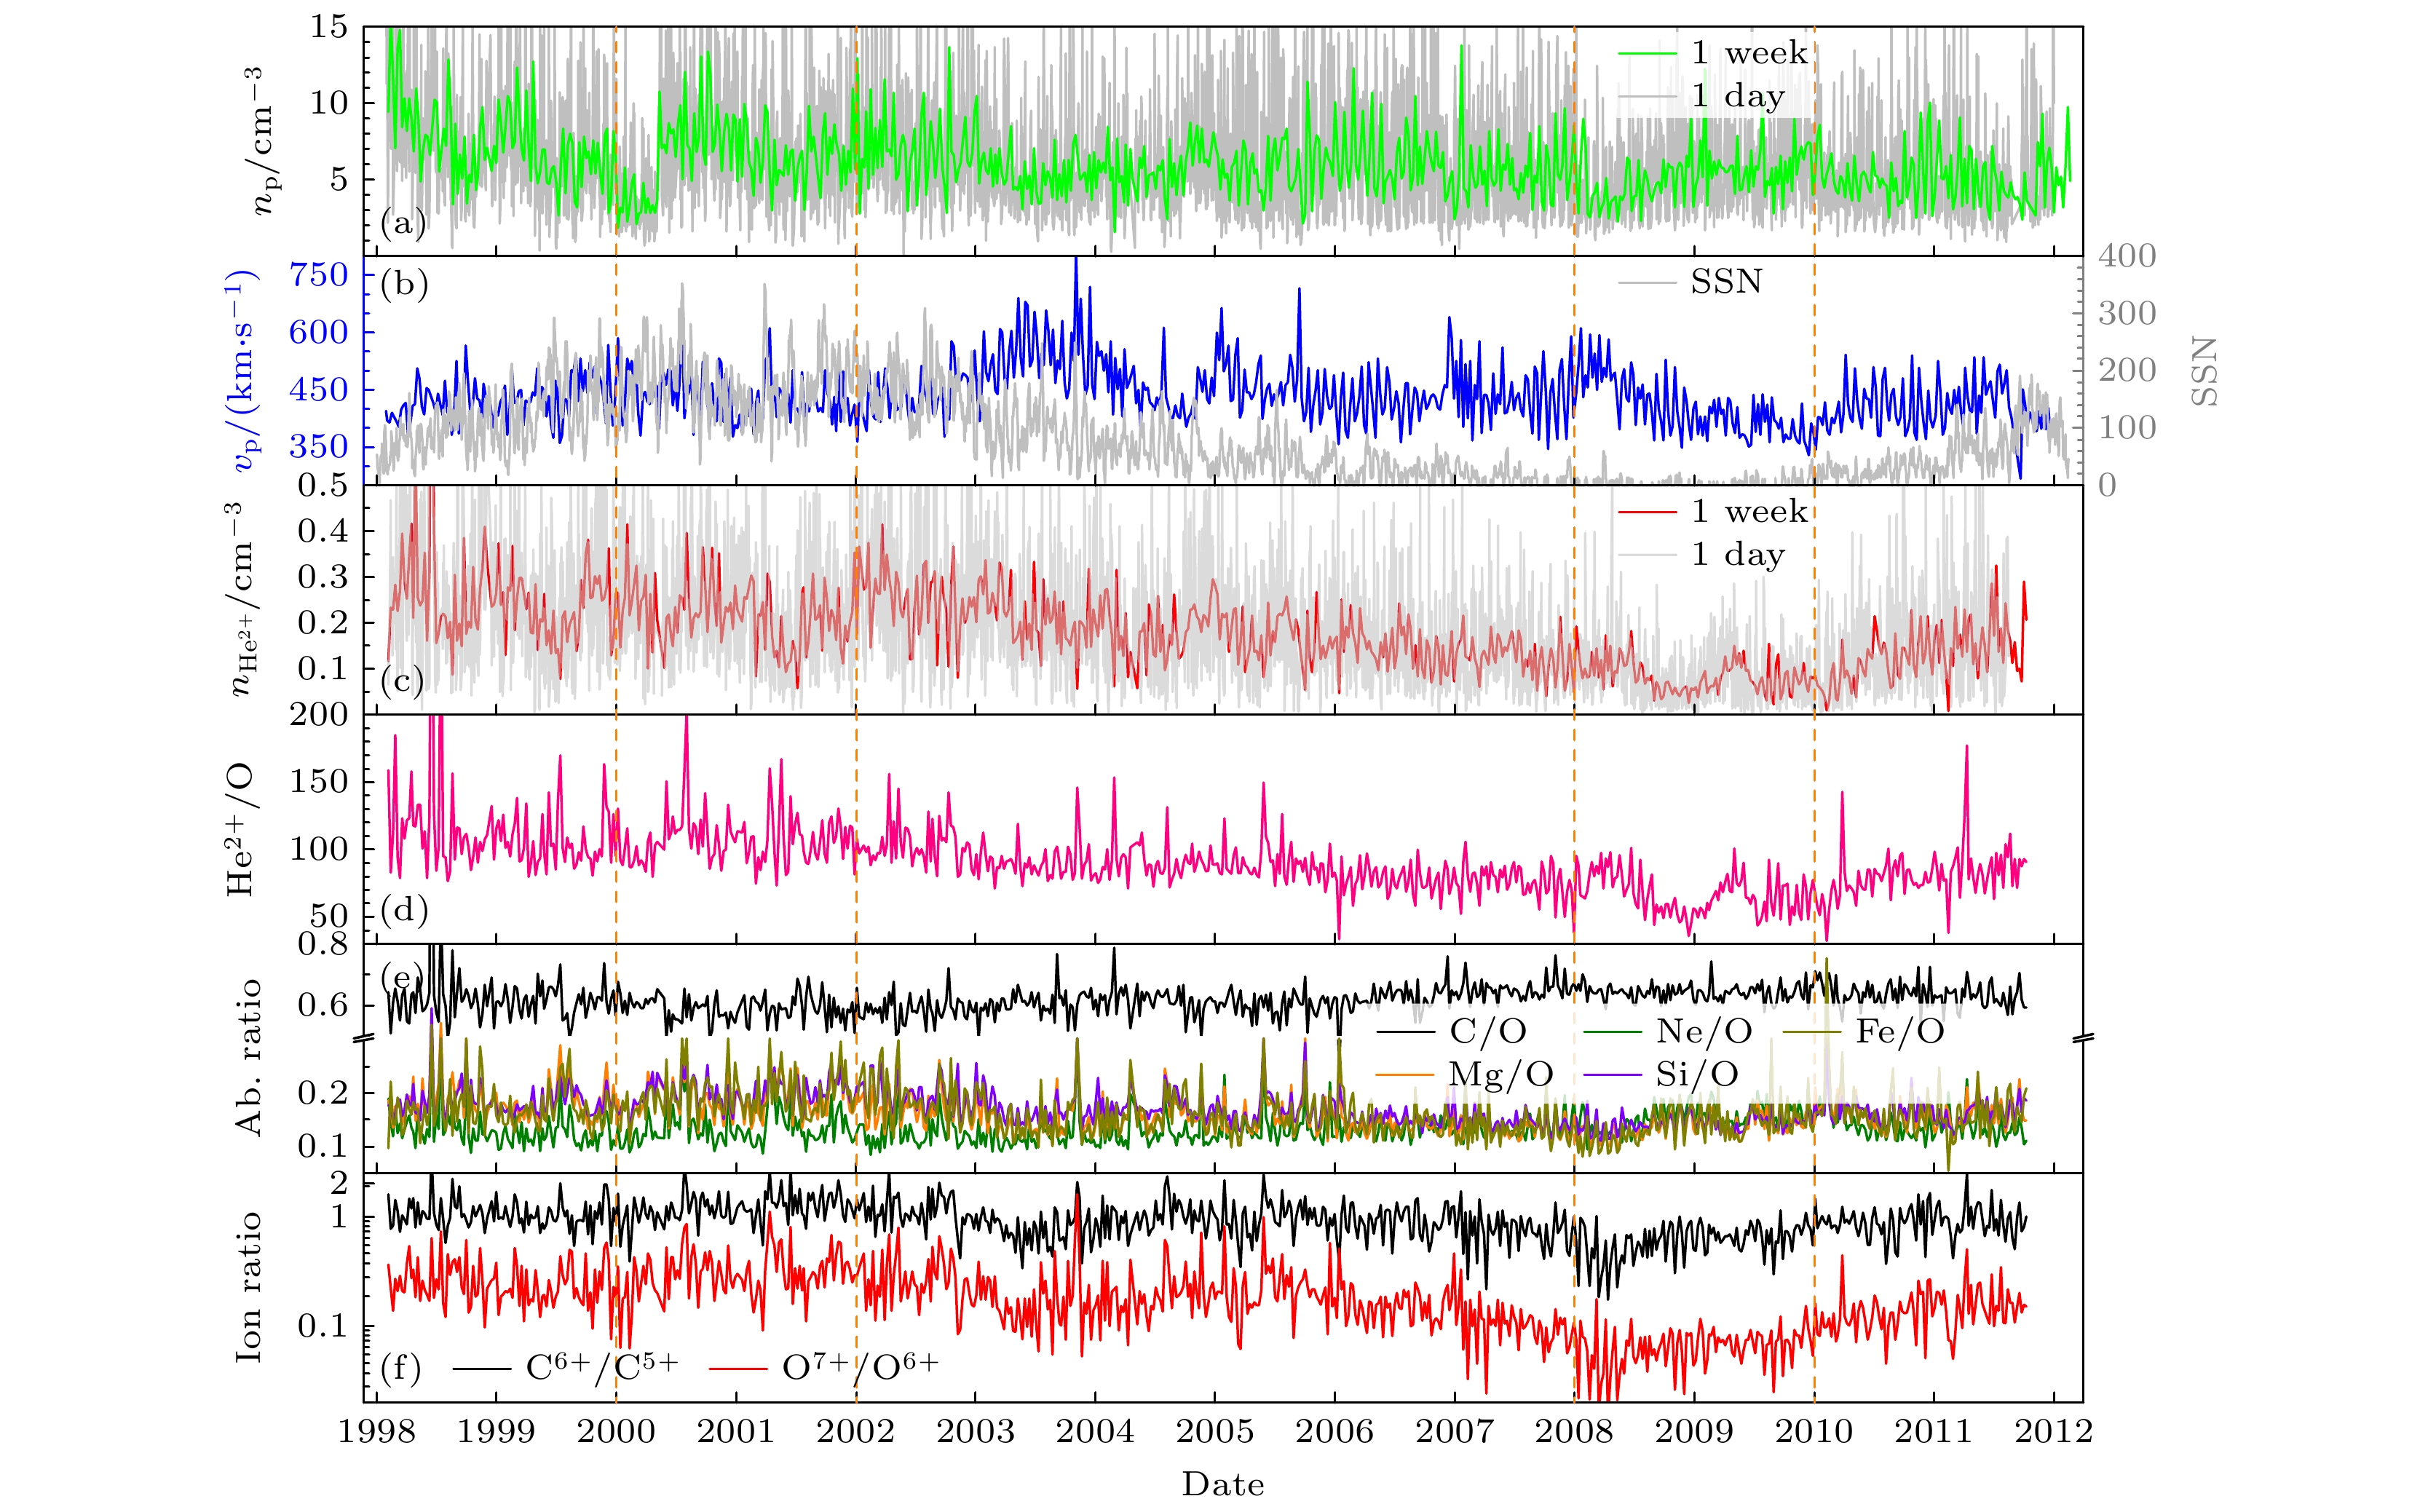
图 1 美国先进成分空间探测器1998—2011年监测的太阳风粒子状态数据, 除时序间隔外, 该图与Koutroumpa[23]文中图2基本一致 (a) 质子数密度 (cm–3), 灰线是1天平均, 绿线是1周平均; (b) 质子速度(km/s, 蓝线)和太阳表黑子计数(右纵轴, 灰线, 1天平均数据), 其来源于比利时太阳黑子指数和长期太阳观测中心[32]; (c) He2+ 离子数密度(cm–3), 灰线是1天平均, 红线是1周平均; (d), (e) 不同元素(He, C, Ne, Mg和Si)与O元素丰度比; (f) 高电荷态的C6+/C5+和O7+/O6+离子比; 竖直点划线分隔的2个区域(2000—2002年和2008—2010年)分别是太阳活动最大和最小时间段
Fig. 1. Status of solar wind particles from ACE during 1998 and 2012. This figure is basically similar with Fig. 2 of Koutroumpa[23] with exception of time step: (a) Proton density (cm–3), gray line is 1-day averaged, while green line is 1-week averaged; (b) proton bulk velocity (km/s, blue line) and sun splot number (SSN, righ-axis) with 1-day averaged from the World Data Center SILSO[32]; (c) He2+ density (in cm–3), gray and red lines refer to 1-day and 1-week averaged; (d), (e) element (He, C, Ne, Mg and Si) abundance ratios relative to oxygen; (f) ion fraction ratio of C6+/C5+ and O7+/O6+. Vertical dashed-dot lines separate two regions (i.e. 2000–2002 year and 2008–2010 year) for solar maximum and minimum, respectively.
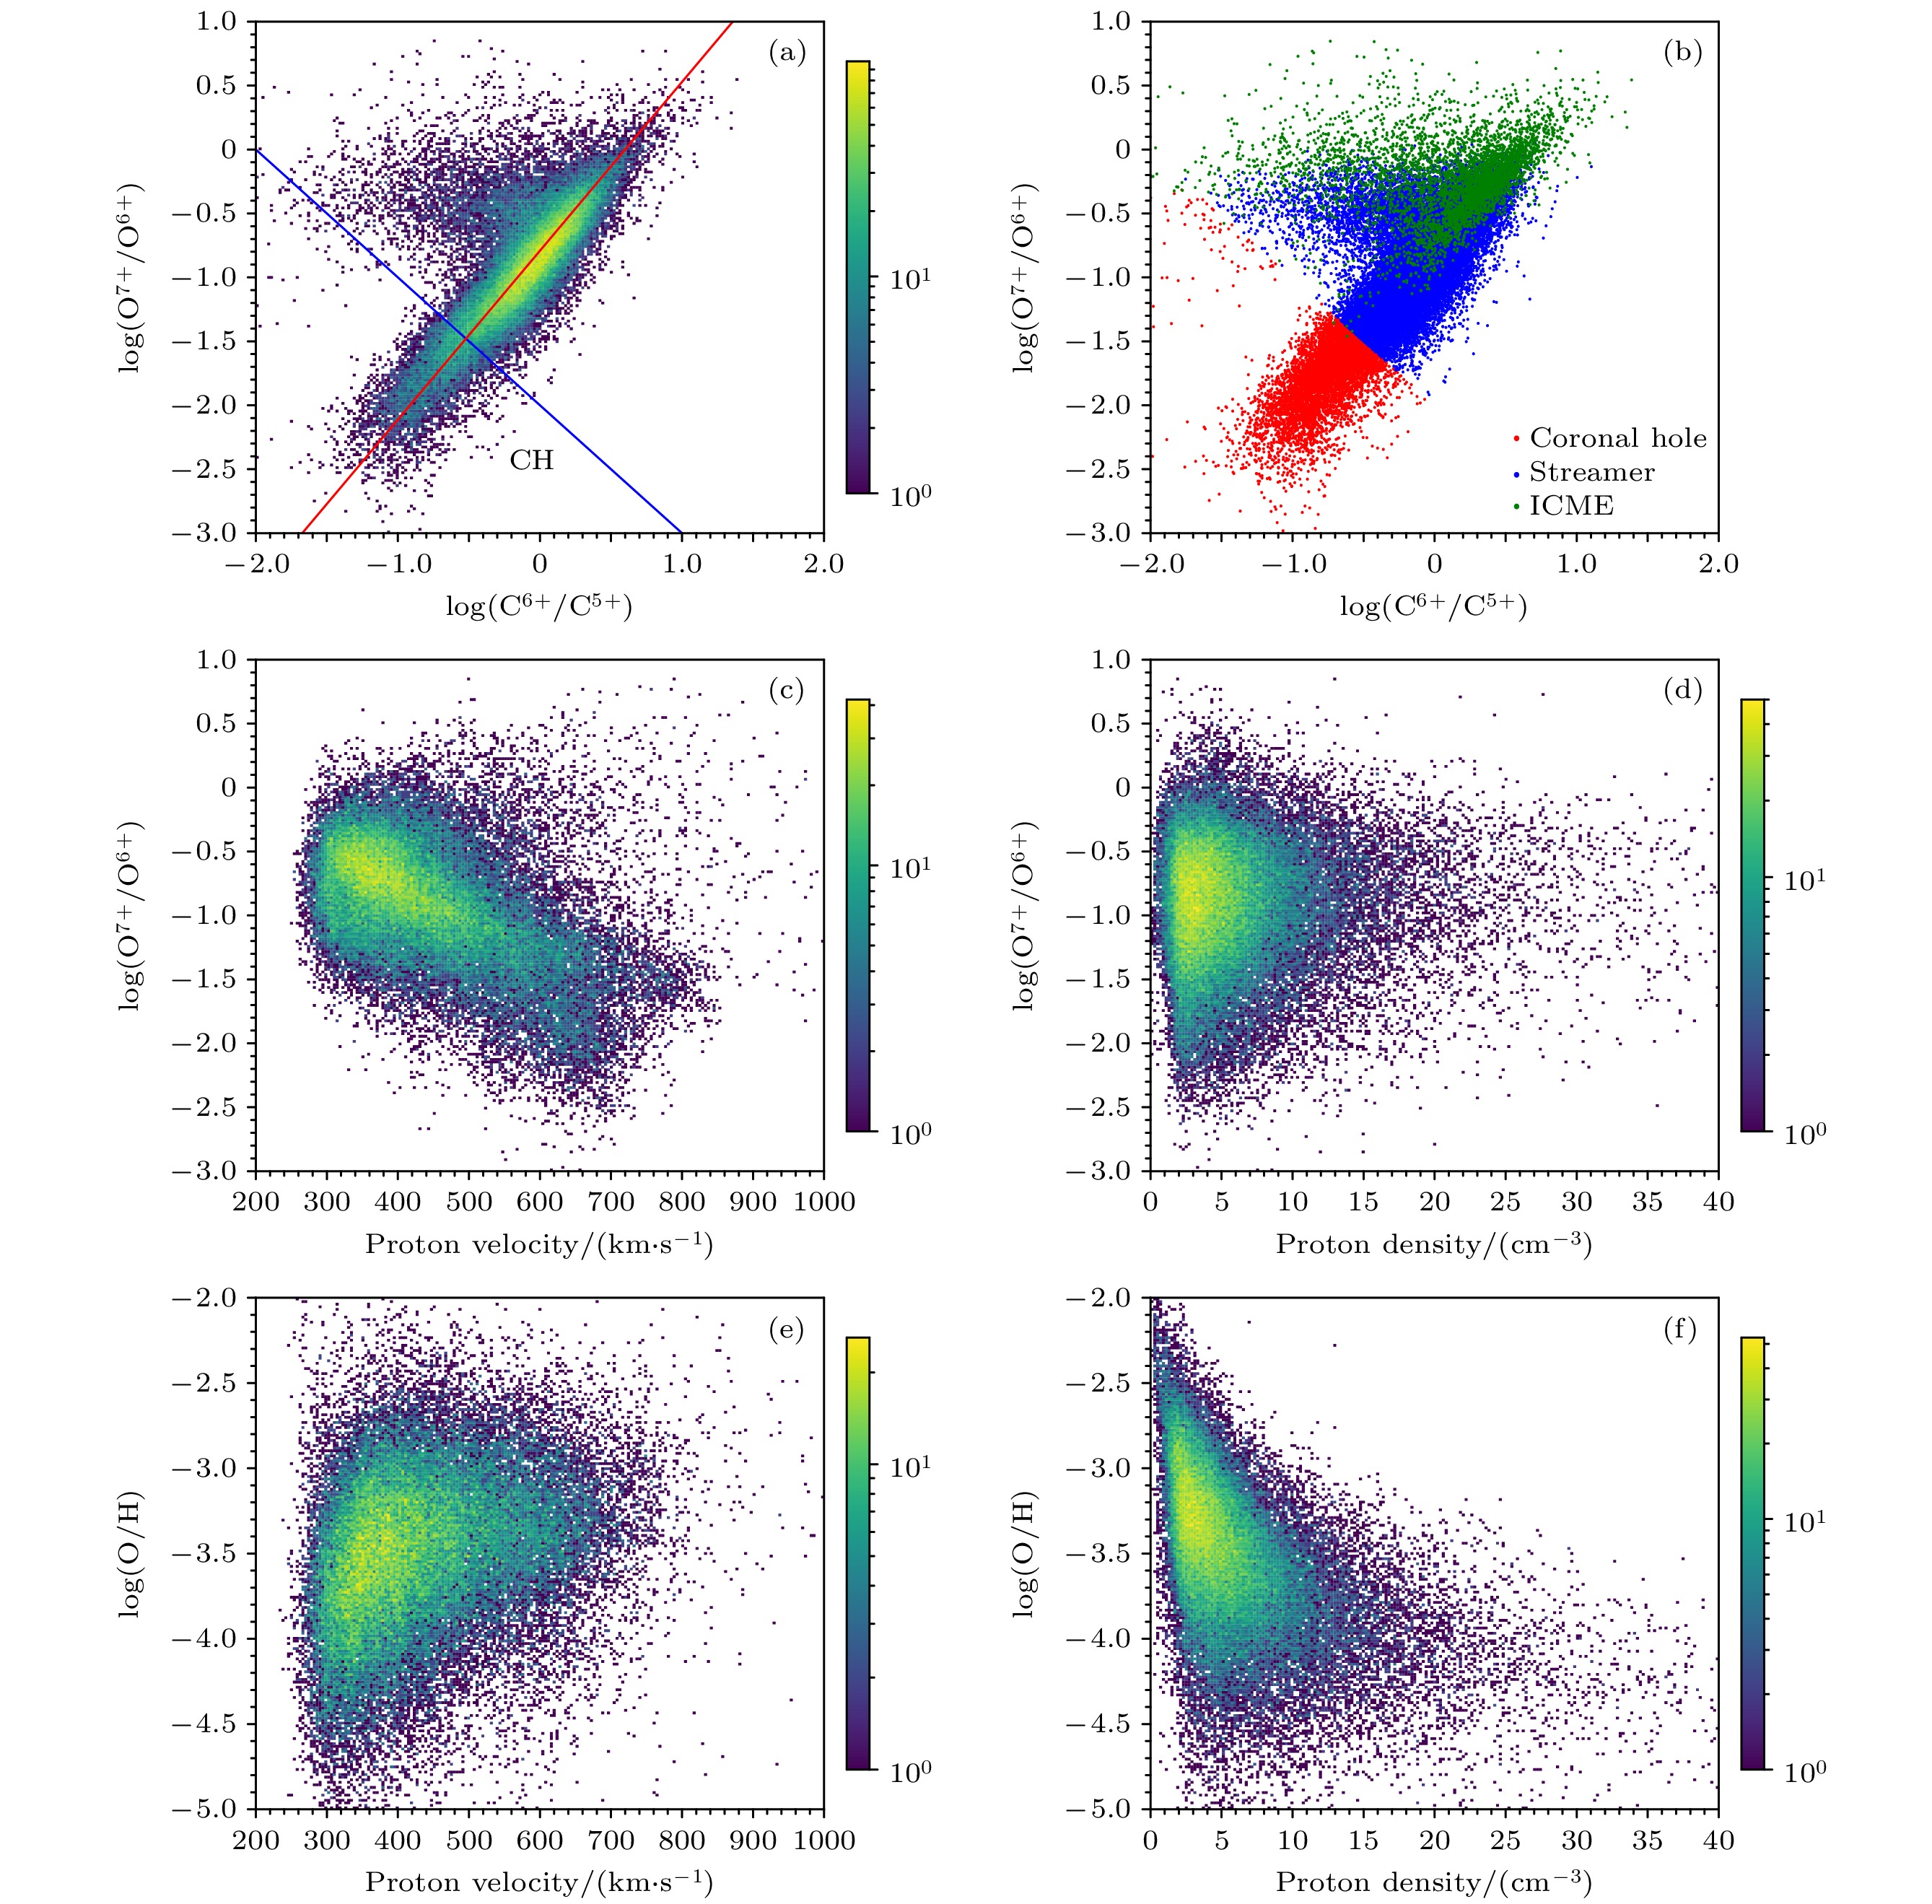
图 2 ACE卫星13年的太阳风粒子监测数据二维直方图或点分布图, 数据采用ACE网站的2小时平均数据, 其中太阳风质子速度和密度采用12 min平均数据重新分组获得. (a), (b) 分别为log(O7+/O6+)与log(C6+/C5+)关系的柱状分布和点分布, 图(a)中蓝色斜线是源于冕洞数据的分隔线, 即$({{\rm O}^{7+}}/{{\rm O}^{6+}})\times ({{\rm C}^{6+}}/{{\rm C}^{5+}})\leqslant 0.01 $, 红色斜线是斜率为1.32的线性拟合线; 图(b)中按Koutroumpa[23]和Zhao等[34]的方法对来源于冕洞(红)、冕流(蓝)和星际冕物质抛射物(深绿)的不同数据进行了分类. (c), (d) 分别为log(O7+/O6+)与太阳风速度和密度关系的二维直方图. (e), (f) 分别为O元丰度与太阳风速度和密度关系的二维柱状分布
Fig. 2. 2D histograms and scatter distribution plots of ACE mission data from Feb. 1998 to Aug. 2011. Element and ion fraction data are from the ACE science center with 2-hour averaged, while proton bulk velocity and density are obtained by rebinning the 12-minute data available from the website. (a), (b) The log(O7+/O6+) vs. log(C6+/C5+) in 2D histogram and scatter, respectively. The oblique blue line in panel (a) refers to the criterion value of $({{\rm O}^{7+}}/{{\rm O}^{6+}})\times ({{\rm C}^{6+}}/{{\rm C}^{5+}})\leqslant 0.01 $ for coronal hole (CH) and streamer sources, amd the red line is a linear fit line with a slope of 1.32. Panel (b) shows the ACE data points of solar wind from different source in Sun by using the distinguise methods of Koutroumpa[23] and Zhao et al.[34], e.g. coronal holes (red), streamters (blue) and interplanetary coronal mass ejections (dark green). (c), (d) The log(O7+/O6+) vs. proton velocity and density in 2D histogram, respectively. (e), (f) The O abundance (in log) vs. Proton velocity and density in 2D histogram, respectively.
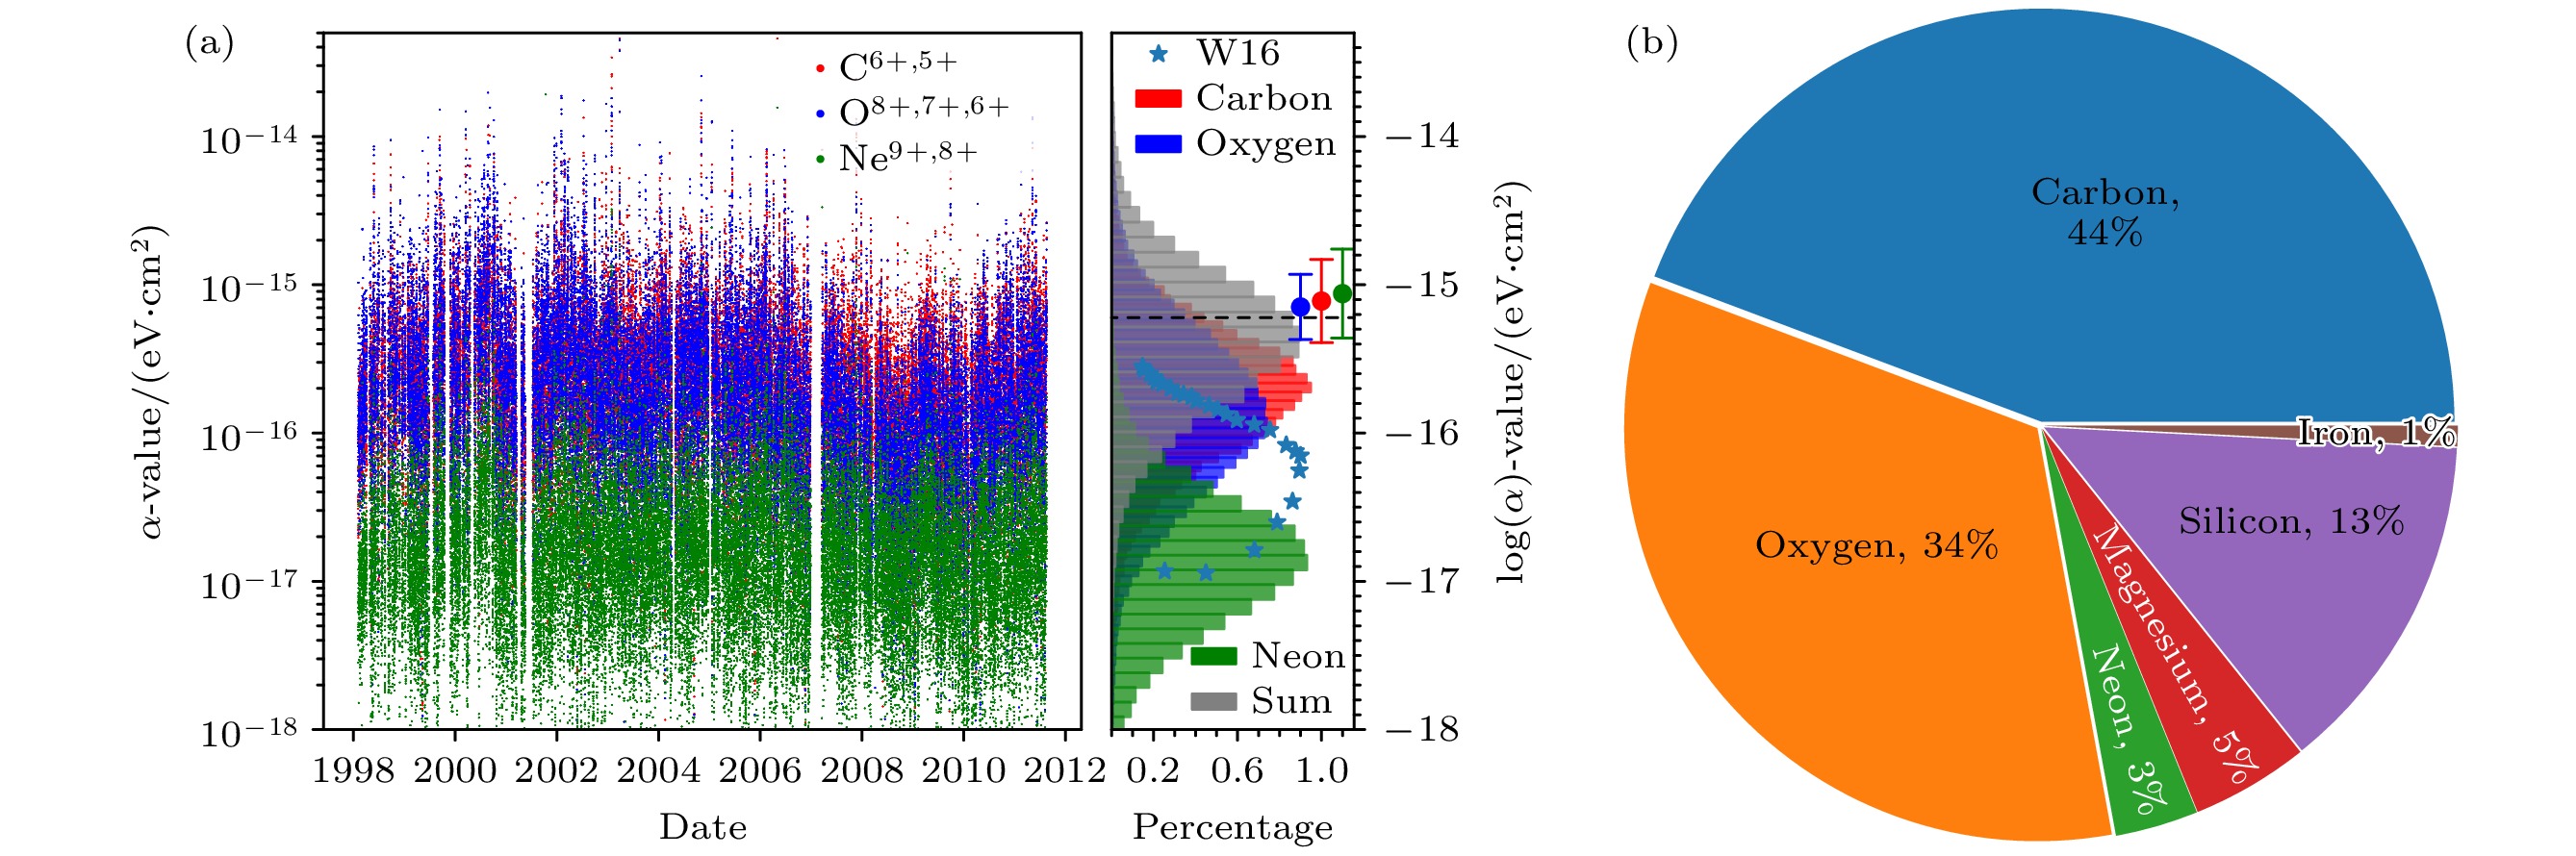
图 3 (a) 1998年至2011年ACE监测到的不同太阳风离子(C6+, 5+, O8+, 7+, 6+和Ne9+, 8+)电荷交换X射线辐射在0.1—2.0 keV能带的辐射因子α值的点分布图(左)和统计百分比分布(右). $ \star $形点来源于Whittaker和Sembay的结果[22], 标记为W16; 水平虚线是经典结果($ 6\times10^{-16} $eV·cm2); 带误差棒的实心圆点是来源于Koutroumpa的不同太阳风起源的结果[23], 即冕流(红色)、冕洞(蓝色)和星际冕物质抛射(绿色), 其能带宽是0.1—2.0 keV. (b) 所有记录点统计的平均辐射因子中各元素贡献百分比
Fig. 3. (a) Scatter plot and statical distribution of the charge-exchange emission factor α-value of the ACE solar wind particles (C6+, 5+, O8+, 7+, 6+ and Ne9+, 8+) in the energy ranges of 0.1–2.0 keV. $ \star $ symbol points are from the results of Whittaker & Sembay[22], marked as W16. Horizontal dashed line is the empirical value of $ 6\times10^{-16} $eV·cm2. Filled circles with errorbar refers to the calculation by Koutroumpa[23] for different solar wind (e.g. streamers (red), CH (blue), and ICMEs (green)). (b) Percentage contribution from the different elements to the mean emission factor α-value of all recored data.

图 4 不同观测时间段和不同太阳风起源的电荷交换辐射因子α值的统计分布, 及其与Koutroumpa[23]结果(K24)的比较. 冕流: 红色阶梯线和带误差棒的实心圆点; 冕洞: 蓝色; 星际冕物质抛射: 绿色. 由于冕洞和星际冕物质抛射的统计数值小, 为便于比较, 均乘了6倍的任意数值. (a) 1998—2011年全时间段; (b)太阳活动强周期2000—2002年; (c)太阳活动弱周期2008—2010年
Fig. 4. Statistical distribution of solar wind charge-exchange emission factor α-value during different observational period and for different solar wind sources, as well as its comparison with the results of Koutroumpa[23] (K24). Streamer: red step lines and filled circles with errorbars, CH: blue lines and symbols, ICMEs: green lines and symbols. For comparison, the statistical distribution of CH and ICMEs are multiplied by an arbitrary value of six. (a) Full period of 1998—2011; (b) 2000—2002 of solar maximum; (c) 2008—2010 of solar minimum.
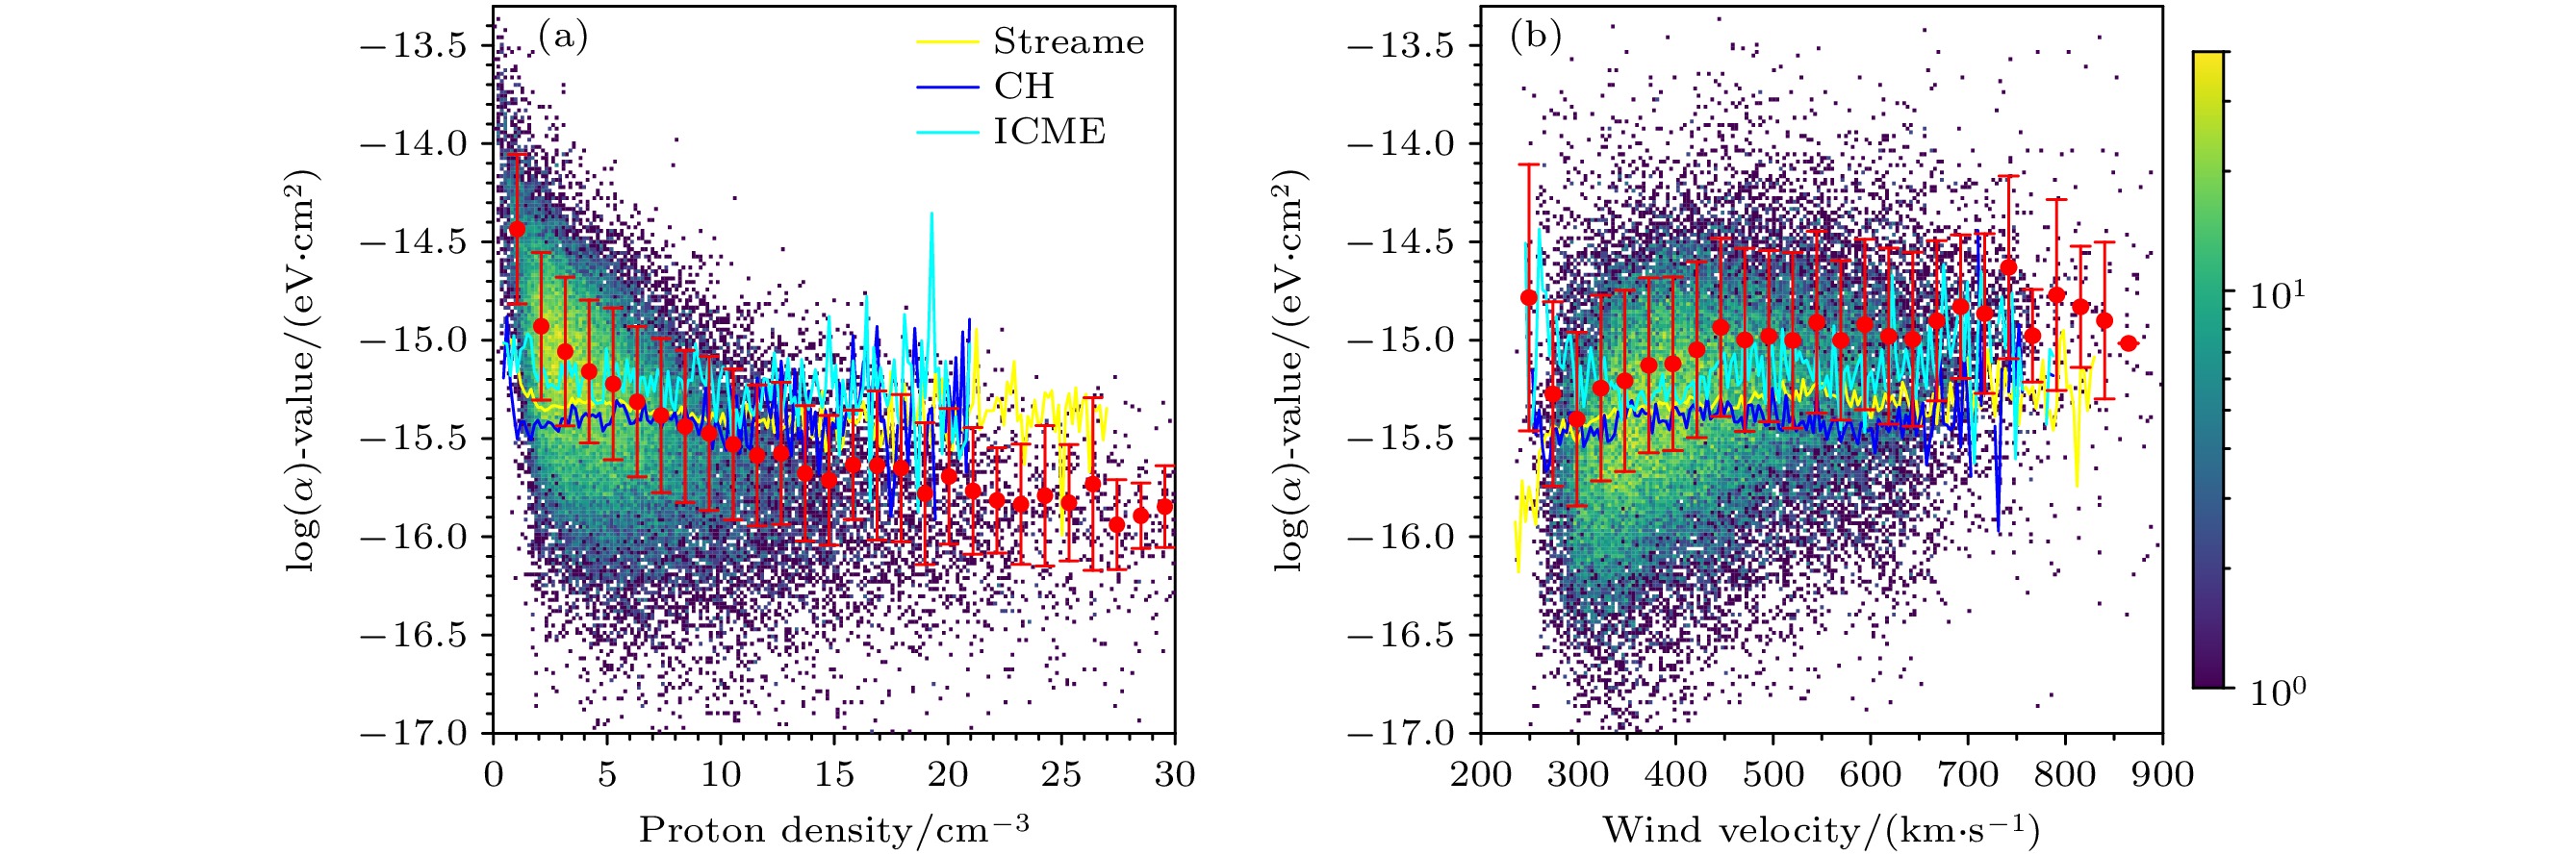
图 5 1998—2011年2小时平均的不同太阳风离子电荷交换X射线总辐射因子α值与质子数密度(a)和速度(b)的二维直方图. 带误差棒实心圆点表示质子数密度和速度相应网格辐射因子的平均值和其方差, 折线分别表示冕物质抛射(青色)、冕流(黄色)和冕洞(蓝色)的辐射因子平均值
Fig. 5. 2D histograms of the charge-exchange emission factor α-value of all particles in solar wind versus proton density (a) and velocity (b) for 2-hour averaged data in 1998–2011. Filled symbols with errorbars refer to mean and standard variance of the α distribution at the grids of the proton density and velocity. Broken curves denotes mean α-value for ICMEs (cyan), Streamer (yellow) and CH (blue).
表 1 不同太阳风离子与中性氢原子碰撞电荷交换截面数据来源
Table 1. Charge exchange cross-setion sources of different solar wind ions with neutral hydrogen.
 下载: 导出CSV
-
[1] Snowden S L, Freyberg M J, Plucinsky P P, Schmitt J H M M, Trümper J, Voges W, Edgar R J, McCammon D, Sanders W T 1995 Astrophys. J. 454 643
Google Scholar
[2] Snowden S L, Egger R, Freyberg M J, McCammon D, Plucinsky P P, Sanders W T, Schmitt J H M M, Trümper J, Voges W 1997 Astrophys. J. 485 125
Google Scholar
[3] Breitschwerdt D, Freyberg M J, Trümper J 1998 The Local Bubble and Beyond (Berlin: Springer
[4] Lisse C M, Dennerl K, Englhauser J, Harden M, Marshall F E, Mumma M J, Petre R, Pye J P, Ricketts M J, Schmitt J, Trümper J, West R G 1996 Science 274 205
Google Scholar
[5] Cravens T E 1997 Gelphys. Res. Lett. 24 105
Google Scholar
[6] Breitschwerdt D, Freyberg M J, Trümper J 1998 The local bubble and beyond: proceedings of the IAU Colloquim no. 166 Garching, Germany, April 21–25 1997 p121
Breitschwerdt D, Freyberg M J, Trümper J 1998 The local bubble and beyond: proceedings of the IAU Colloquim no. 166 Garching, Germany, April 21–25 1997 p121
[7] Cravens T E 2000 Astrophys. J. 532 L153
Google Scholar
[8] Wargelin B J, Markevitch M, Juda M, Kharchenko V, Edgar R & Dalgarno A 2004 Astrophys. J. 607 596
Google Scholar
[9] Bhardwaj A, Gladstone G R, Elsner R F, et al. 2002 Proc. ESLAB 36 Symposium: Earth-Like Planets and Moons Noordwijk, Netherlands, June 3–8, 2002 pp215–226
[10] Robertson I P, Cravens T E 2003 Gelphys. Res. Lett. 30 1439
Google Scholar
[11] Sembay S, Alme A L, Agnolon D, et al. 2024 Earth Planet. Phys. 8 5
Google Scholar
[12] Beiersdorfer P, Boyce K R, Brown G V, Chen H, Kahn S M, Kelley R L, May M, Olson R E, Porter F S, Stahle C K, Tillotson W A 2003 Science 300 1558
Google Scholar
[13] Zhang R T, Liao T, Zhang C J, Zhou L P, Guo D L, Gao Y, Gu L Y, Zhu X L, Zhang S F, Ma X 2023 Mon. Not. R. Astron. Soc. 520 1417
Google Scholar
[14] Jin H, Mao J J, Chen L B, Chen N H, Cui W, Gao B, Li J J, Li X F, Liu J J, Quan J, Jiang C Y, Wang G L, Wang L, Wang Q, Wang S F, Xiao A M, Zhang S 2024 J. Low Temperature Phys. 215 256
Google Scholar
[15] Sun T R, Connor H, Samsonov A 2024 Earth Planet. Phys. 8 1
Google Scholar
[16] Schwadron N A, Cravens T E 2000 Astrophys. J. 544 558
Google Scholar
[17] Smith R K, Foster A R, Brickhouse N S 2012 Astron. Nachr 333 301
Google Scholar
[18] Gu L Y, Kaastra J, Raassen A J J 2016 Astron. Astrophys. 588 A52
Google Scholar
[19] Cumbee R, Stancil P, Mcilvane S 2021 American Astronomical Society Meeting 238 12601
[20] Liang G Y, Li F, Wang F L, Wu Y, Zhong J Y, Zhao G 2014 Astrophys. J. 783 124
Google Scholar
[21] Liang G Y, Zhu X L, Wei H G, Yuan D W, Zhong J Y, Wu Y, Hutton R, Cui W, Ma X W, Zhao G 2021 Mon. Not. R. Astron. Soc. 508 2194
Google Scholar
[22] Whittaker I C, Sembay S 2016 Gelphys. Res. Lett. 43 7328
Google Scholar
[23] Koutroumpa D 2024 Earth Planet. Phys. 8 105
Google Scholar
[24] Liang G Y, Sun T R, Lu H Y, Zhu X L, Wu Y, Li S B, Wei H G, Yuan D W, Zhong J Y, Cui W, Ma X W, Zhao G 2023 Astrophys. J. 943 85
Google Scholar
[25] Midha J M, Gupta S C 1994 J. Quant. Spectrosc. Radiat. Transfer 52 897
Google Scholar
[26] Wargelin B J, Beiersdorfer P, Brown G V 2008 Can. J. Phys. 86 151
Google Scholar
[27] Zhang R T, Seely D G, Andrianarijaona V M, Draganić I N, Havener C C 2022 Astrophys. J. 931 1
Google Scholar
[28] Wu Y, Stancil P C, Schultz D R, Hui Y, Liebermann H P, Buenker R J 2012 J. Phs. B: At. Mol. Opt. Phys. 45 235201
Google Scholar
[29] Nolte J L, Stancil P C, Liebermann H P, Buenker R J, Hui Y, Schultz D R 2012 J. Phs. B: At. Mol. Opt. Phys. 45 245202
Google Scholar
[30] Liu L, Wu Y, Wang J G, Janev R K 2022 At. Data & Nuclear Data Tables 143 101464
Google Scholar
[31] Janev R K, Winter H 1985 Phys. Rep. 117 265
Google Scholar
[32] Royal Observatory of Belgium, Brussels (Sunspot Number catalogue ‘1998-2012’) http://www.sidc.be/SILSO/
[33] Landi E, Gruesbeck J R, Lepri S T, Zurbuchen T H, Fisk L A 2012 Astrophys. J. 761 48
Google Scholar
[34] Zhao L, Zurbuchen T H, Fisk L A 2009 Gelphys. Res. Lett. 36 L14104
Google Scholar
[35] Zhao L, Landi E, Lepri S T, Kocher M, Zurbuchen T H, Fisk L A, Raines M J 2017 Astrophys. J. Supp. Ser. 228 4
Google Scholar
[36] Zhang C, Ling Z X, Sun X J, et al. 2022 Astrophys. J. Lett. 941 L2
Google Scholar

 下载:
下载:
计量
- 文章访问数: 2146
- PDF下载量: 37
- 被引次数: 0
