


-
惯性约束聚变中, 热斑离子温度是决定聚变增益的关键参数, 热斑离子温度时空分布能够揭示热斑能量的沉积与耗散过程, 针对此物理研究需求, 提出了一种基于多诊断参数分析的一维内爆热斑离子温度时空分布计算方法. 本文以冲击压缩内爆为例, 分析了离子温度时空分布的特性, 建立了离子温度时空分布数学模型. 利用计算算例作为模拟实验给出了离子温度相关的多个关键诊断量, 以此作为离子温度时空分布求解的约束. 通过遗传算法计算出了模型中的待定参数, 计算参数给出的离子温度时空分布与模拟实验基本相符, 验证了本方法的有效性. 本方法可以应用于近一维内爆实验热斑离子温度时空分布的计算, 为更深入地了解内爆热斑的形成与演化过程提供了实验观测手段.
In inertial confinement fusion (ICF), the ion temperature of hot spots is a critical parameter determining fusion gain, and its spatiotemporal distribution provides insights into energy deposition and dissipation processes. However, directly diagnosing such a distribution remains challenging due to the extreme spatiotemporal scales of hot spots (~100 ps, ~100 μm). To cope with this challenge, a computational method of reconstructing the spatiotemporal ion temperature distribution in one-dimensional implosion hot spots through multi-diagnostic parameter analysis is proposed in this work. Taking shock-compressed implosions for example, the physical process is simulated via the one-dimensional (1D) radiation-hydrodynamics code Multi1D. The analysis shows two key mechanisms. One is that the propagation of reflected shock waves governs the rapid temperature rise and spatiotemporal differences in peak temperatures, and the other is that ion-ion conduction and ion-electron thermal conduction dominate the slow temperature decline. These mechanisms are found to be universal under different initial conditions. Based on these characteristics, a mathematical model with 10 parameters is developed to describe the spatiotemporal ion temperature distribution. The relationships between this distribution and experimental diagnostic quantities, including neutron yield, average ion temperature, time-dependent fusion reaction rate, and neutron imaging profile, are rigorously derived. Using computational cases as simulated experiments, key diagnostic parameters related to ion temperature are generated as constraints. Genetic algorithm is employed to optimize the model parameters, and the resulting ion temperature distributions show excellent agreement with simulation results in the fusion phase, thus validating the effectiveness of the method. This approach provides a way to reconstruct the ion temperature distribution in near-one-dimensional ICF experiments by using traditional neutron diagnostics, thus bypassing the limitations of spatiotemporally resolved measurement techniques. Although theoretically extensible to 2D/3D scenarios, challenges such as increased model complexity and insufficient multidimensional diagnostic data must be addressed. This method provides a valuable experimental way for understanding formation and evolution of hot spots, calibrating radiation-hydrodynamics codes, and optimizing implosion designs, which is of great significance for achieving fusion ignition. 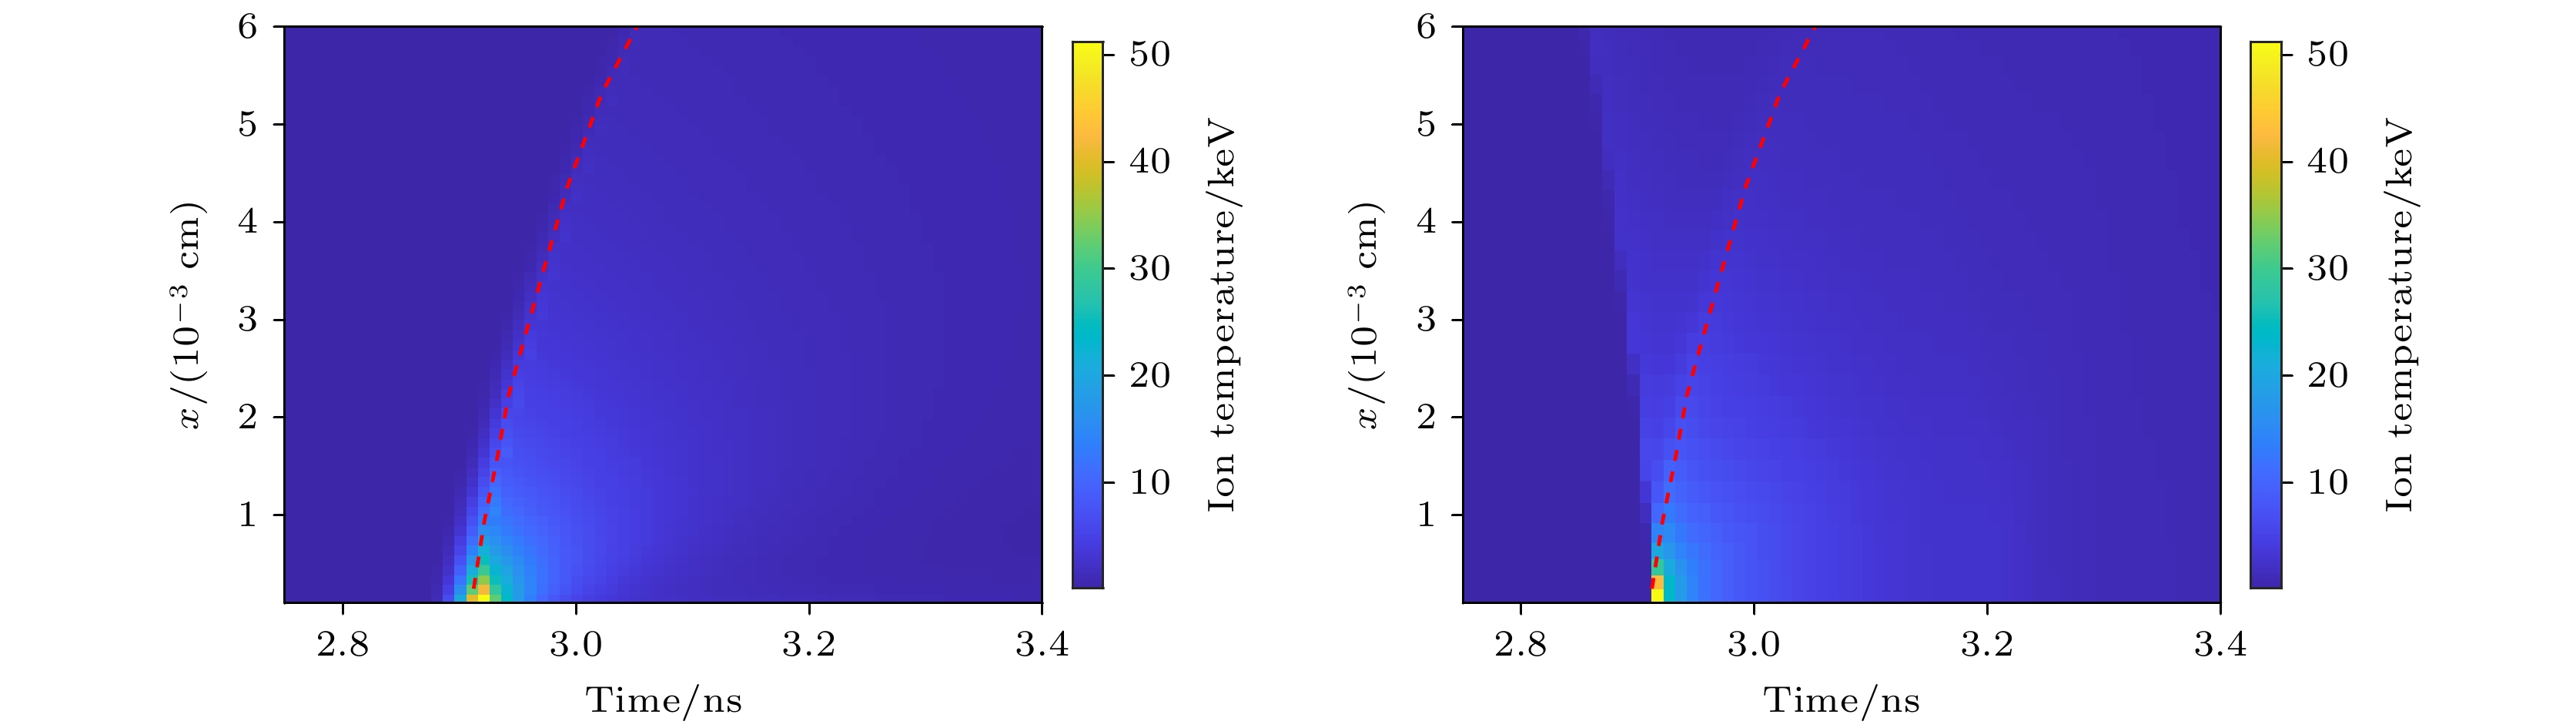
-
Keywords:
- inertial confinement fusion /
- temporal and spatial distribution of ion temperature /
- neutron diagnostics /
- multi-parameter analysis
[1] 张棋, 马积瑞, 范金燕, 张杰 2022 物理学报 71 135202
 Google Scholar
Zhang Q, Ma J R, Fan J Y, Zhang J 2022 Acta Phys. Sin. 71 135202
Google Scholar
[2] 张占文, 漆小波, 李波 2012 物理学报 61 145204
Google Scholar
Zhang Z W, Qi X B, Li B 2012 Acta Phys. Sin. 61 145204
Google Scholar
[3] 张家泰, 何斌, 贺贤土, 常铁强, 许林宝 2001 物理学报 50 921
Google Scholar
Zhang J T, He B, He X T, Chang T Q, Xu L B 2001 Acta Phys. Sin. 50 921
Google Scholar
[4] 何民卿, 张华, 李明强, 彭力, 周沧涛 2023 物理学报 72 095201
Google Scholar
He M Q, Zhang H, Li M Q, Peng L, Zhou C T 2023 Acta Phys. Sin. 72 095201
Google Scholar
[5] 袁强, 胡东霞, 张鑫, 赵军普, 胡思德, 黄文会, 魏晓峰 2011 物理学报 60 015202
Google Scholar
Yuan Q, Hu D X, Zhang X, Zhao J P, Hu S D, Huang W H, Wei X F 2011 Acta Phys. Sin. 60 015202
Google Scholar
[6] 赵英奎, 欧阳碧耀, 文武, 王敏 2015 物理学报 64 045205
Google Scholar
Zhao Y K, Ouyang B Y, Wen W, Wang M 2015 Acta Phys. Sin. 64 045205
Google Scholar
[7] 高凡, 袁鹏, 黄浩彬, 寇琦, 贾青, 远晓辉, 张喆, 张杰, 郑坚 2023 物理学报 72 175203
Google Scholar
Gao F, Yuan P, Huang H B, Kou Q, Jia Q, Yuan X H, Zhang Z, Zhang J, Zheng J 2023 Acta Phys. Sin. 72 175203
Google Scholar
[8] Zylstra A B, Hurricane O A, Callahan D A, et al. 2022 Nature 601 542
Google Scholar
[9] Abu-Shawareb H, et al. (Indirect Drive ICF Collaboration) 2022 Phys. Rev. Lett. 129 075001
Google Scholar
[10] Lerche R A, Coleman L Q, Houghton J W, Speck D R, Storm E K 1977 Appl. Phys. Lett. 31 645
Google Scholar
[11] Lerche R A, Glebov V Y, Moran M J, et al. 2010 Rev. Sci. Instrum. 81 10D319
Google Scholar
[12] Glebov V Y, Sangster T C, Stoeckl C, et al. 2010 Rev. Sci. Instrum. 81 10D325
Google Scholar
[13] Tang Q, Chen J B, Xiao Y Q, Yi T, Liu Z J, Zhan X Y, Song Z F 2020 Rev. Sci. Instrum. 91 023508
Google Scholar
[14] Frenje J A, Hilsabeck T J, Wink C W, Bell P, Bionta R, Cerjan C, Johnson M G, Kilkenny J D, Li C K, Séguin F H, Petrasso R D 2016 Rev. Sci. Instrum. 87 11D806
Google Scholar
[15] Kunimune J H, Frenje J A, Berg G P A, et al. 2021 Rev. Sci. Instrum. 92 033514
Google Scholar
[16] Moore A S, Schlossberg D J, Eckart M J, Hartouni E P, Hilsabeck T J, Jeet J S, Kerr S M, Nora R C, Kilkenny J 2022 Rev. Sci. Instrum. 93 113536
Google Scholar
[17] Meaney K D, Kim Y, Hoffman N M, et al. 2022 Rev. Sci. Instrum. 93 083520
Google Scholar
[18] Birge N, Geppert-Kleinrath V, Danly C, et al. 2022 Rev. Sci. Instrum. 93 113510
Google Scholar
[19] Bleuel D L, Yeamans C B, Bernstein L A, et al. 2012 Rev. Sci. Instrum. 83 10D313
Google Scholar
[20] Stoeckl C, Boni R, Ehrne F, et al. 2016 Rev. Sci. Instrum. 87 053501
Google Scholar
[21] Ress D, Lerche R A, Ellis R J, Lane S M, Nugent K A 1988 Science 241 956
Google Scholar
[22] Fittinghoff D N, Birge N, Geppert-Kleinrath V 2023 Rev. Sci. Instrum. 94 021101
Google Scholar
[23] 余波, 应阳君, 许海波 2010 物理学报 59 5351
Google Scholar
Yu B, Ying Y J, Xu H B 2010 Acta Phys. Sin. 59 5351
Google Scholar
[24] 王胜, 邹宇斌, 温伟伟, 李航, 刘树全, 王浒, 陆元荣, 唐国有, 郭之虞 2013 物理学报 62 122801
Google Scholar
Wang S, Zou Y B, Wen W W, Li H, Liu S Q, Wang H, Lu Y R, Tang G Y, Guo Z Y 2013 Acta Phys. Sin. 62 122801
Google Scholar
[25] 章法强, 祁建敏, 张建华, 李林波, 陈定阳, 谢红卫, 杨建伦, 陈进川 2014 物理学报 63 128701
Google Scholar
Zhang F Q, Qi J M, Zhang J H, Li L B, Chen D Y, Xie H W, Yang J L, Chen J C 2014 Acta Phys. Sin. 63 128701
Google Scholar
[26] Ramis R, Schmalz R, Meyer-Ter-Vehn J 1988 Comput. Phys. Commun. 49 475
Google Scholar
[27] 李维新 2003 一维不定常流与冲击波(北京: 国防工业出版社)第343—355页
Li W X 2003 One-Dimensional Nonsteady Flow and Shock Waves (Beijing: National Defense Industry Press) pp343–355
-
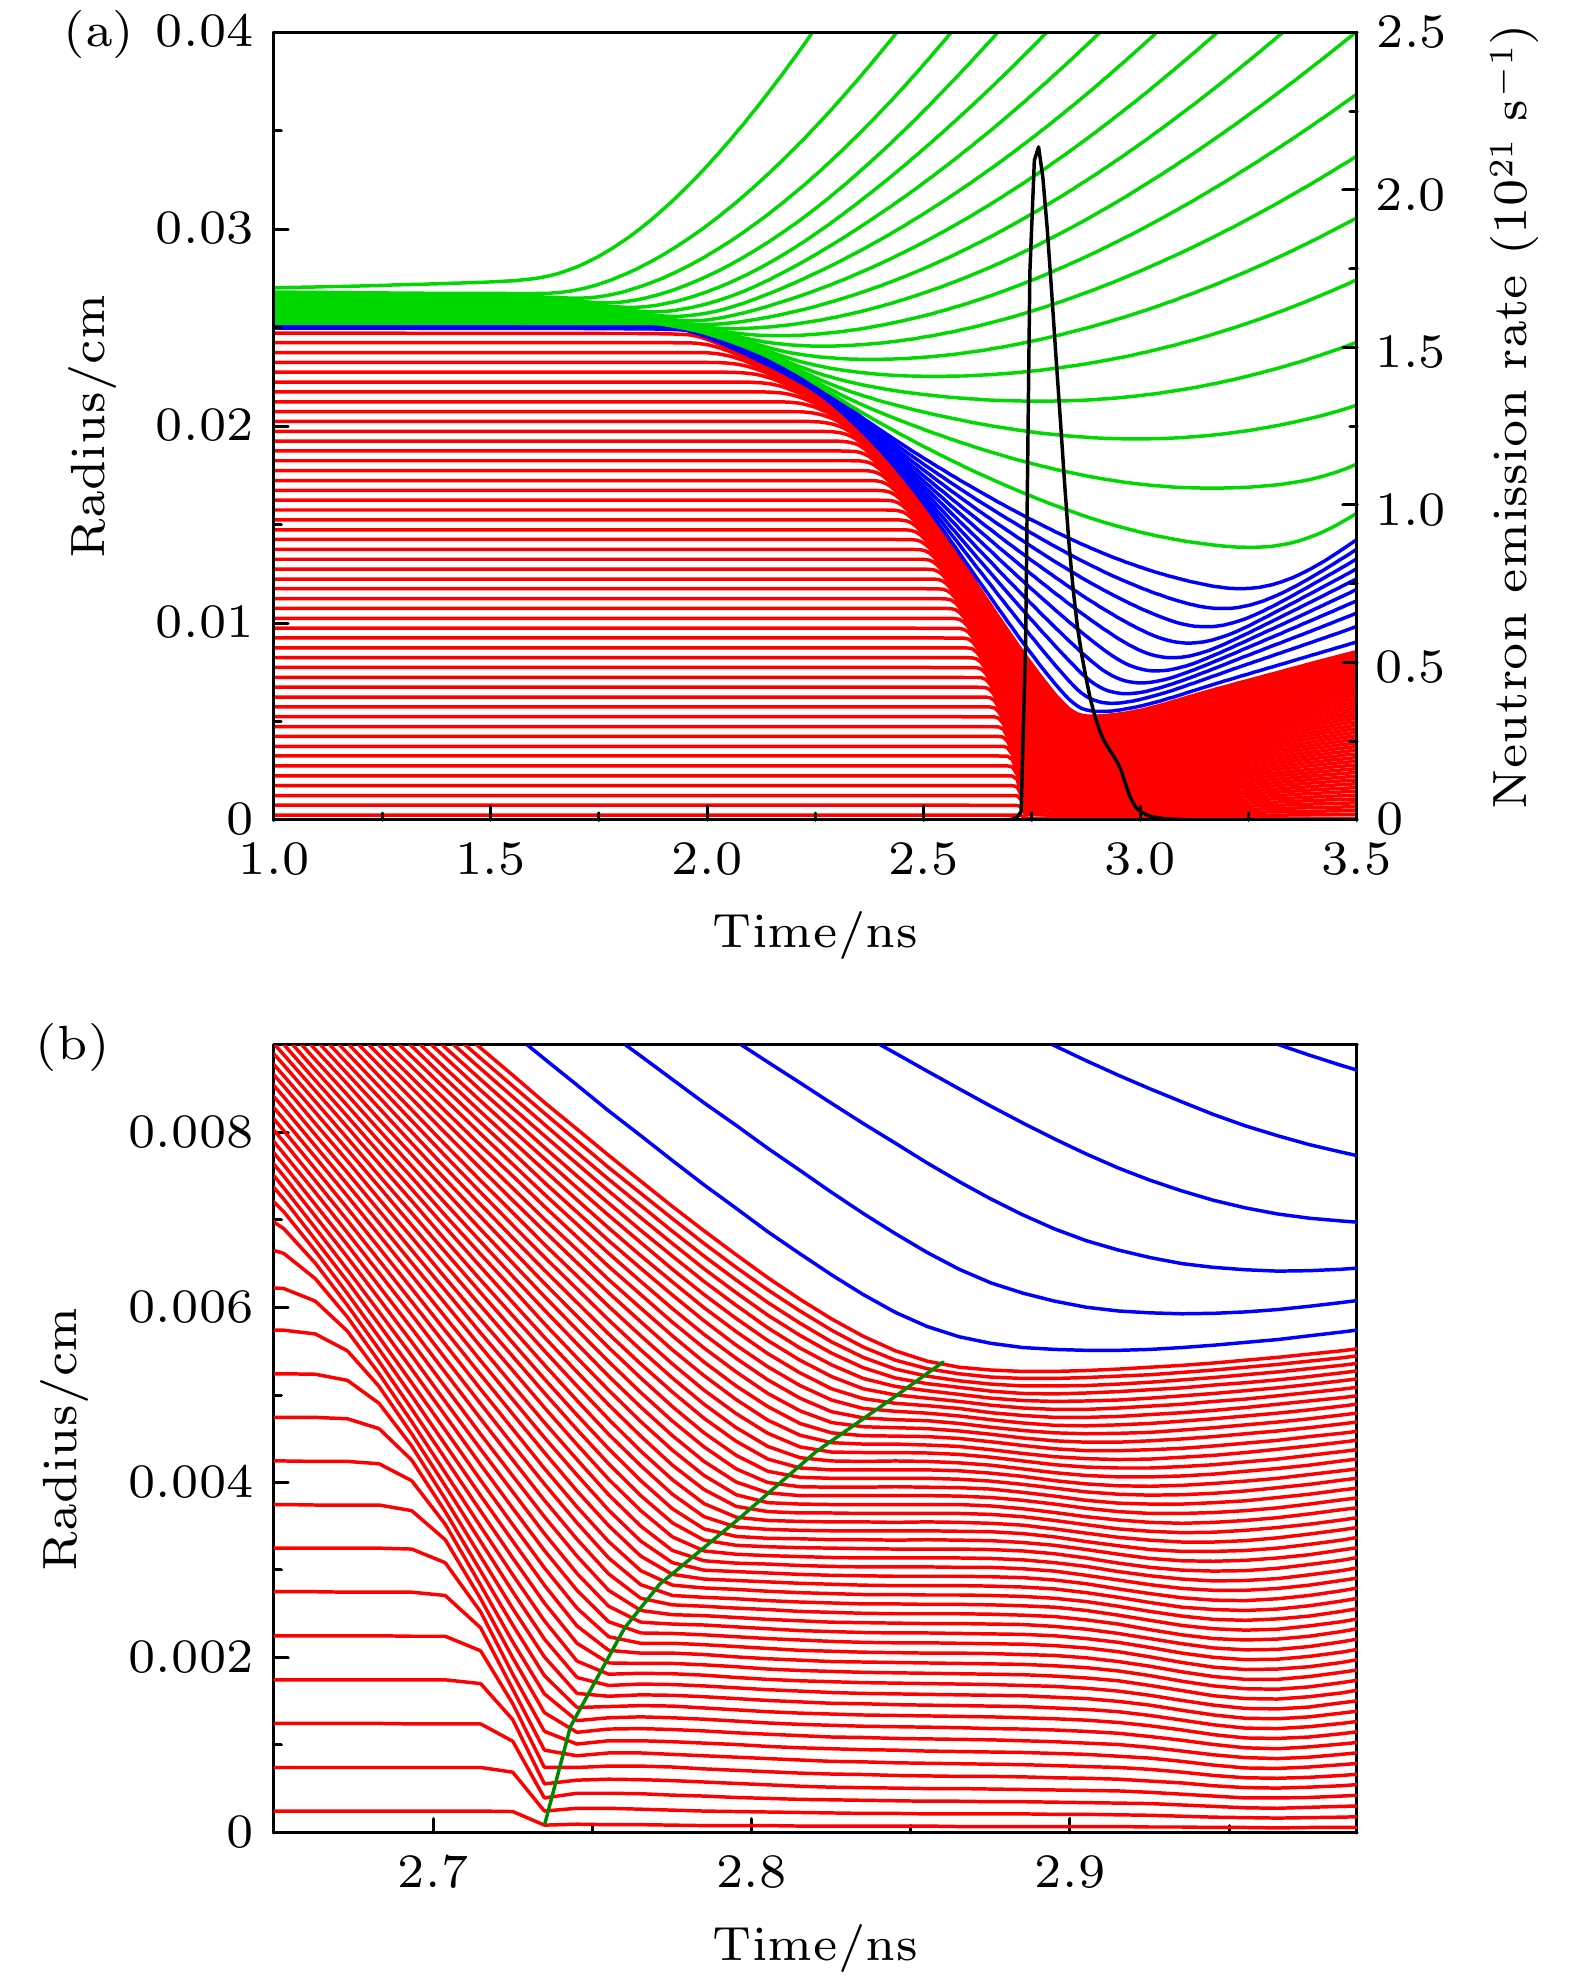
图 2 模拟计算的内爆靶丸流线(a)和阻滞阶段燃料的流线(b). 图(a)中红色线条表示DT燃料的运动轨迹, 蓝色线条表示SiO2的运动轨迹, 绿色线条表示CH的运动轨迹, 黑色线条表示聚变速率曲线. 图(b)中红色线条表示DT燃料的运动轨迹, 绿色曲线表示冲击波的轨迹
Fig. 2. Streamline of the inertial confinement target capsule (a) and the streamlines of the fuel in the stagnation phase (b) during simulation calculations. In panel (a), the red lines represent the trajectory of the DT fuel, the blue lines indicate the trajectory of SiO2, the green lines show the trajectory of CH, and the black lines represent the fusion rate curve. In panel (b), the red lines depict the trajectory of the DT fuel, while the green curve represents the trajectory of the shock wave.
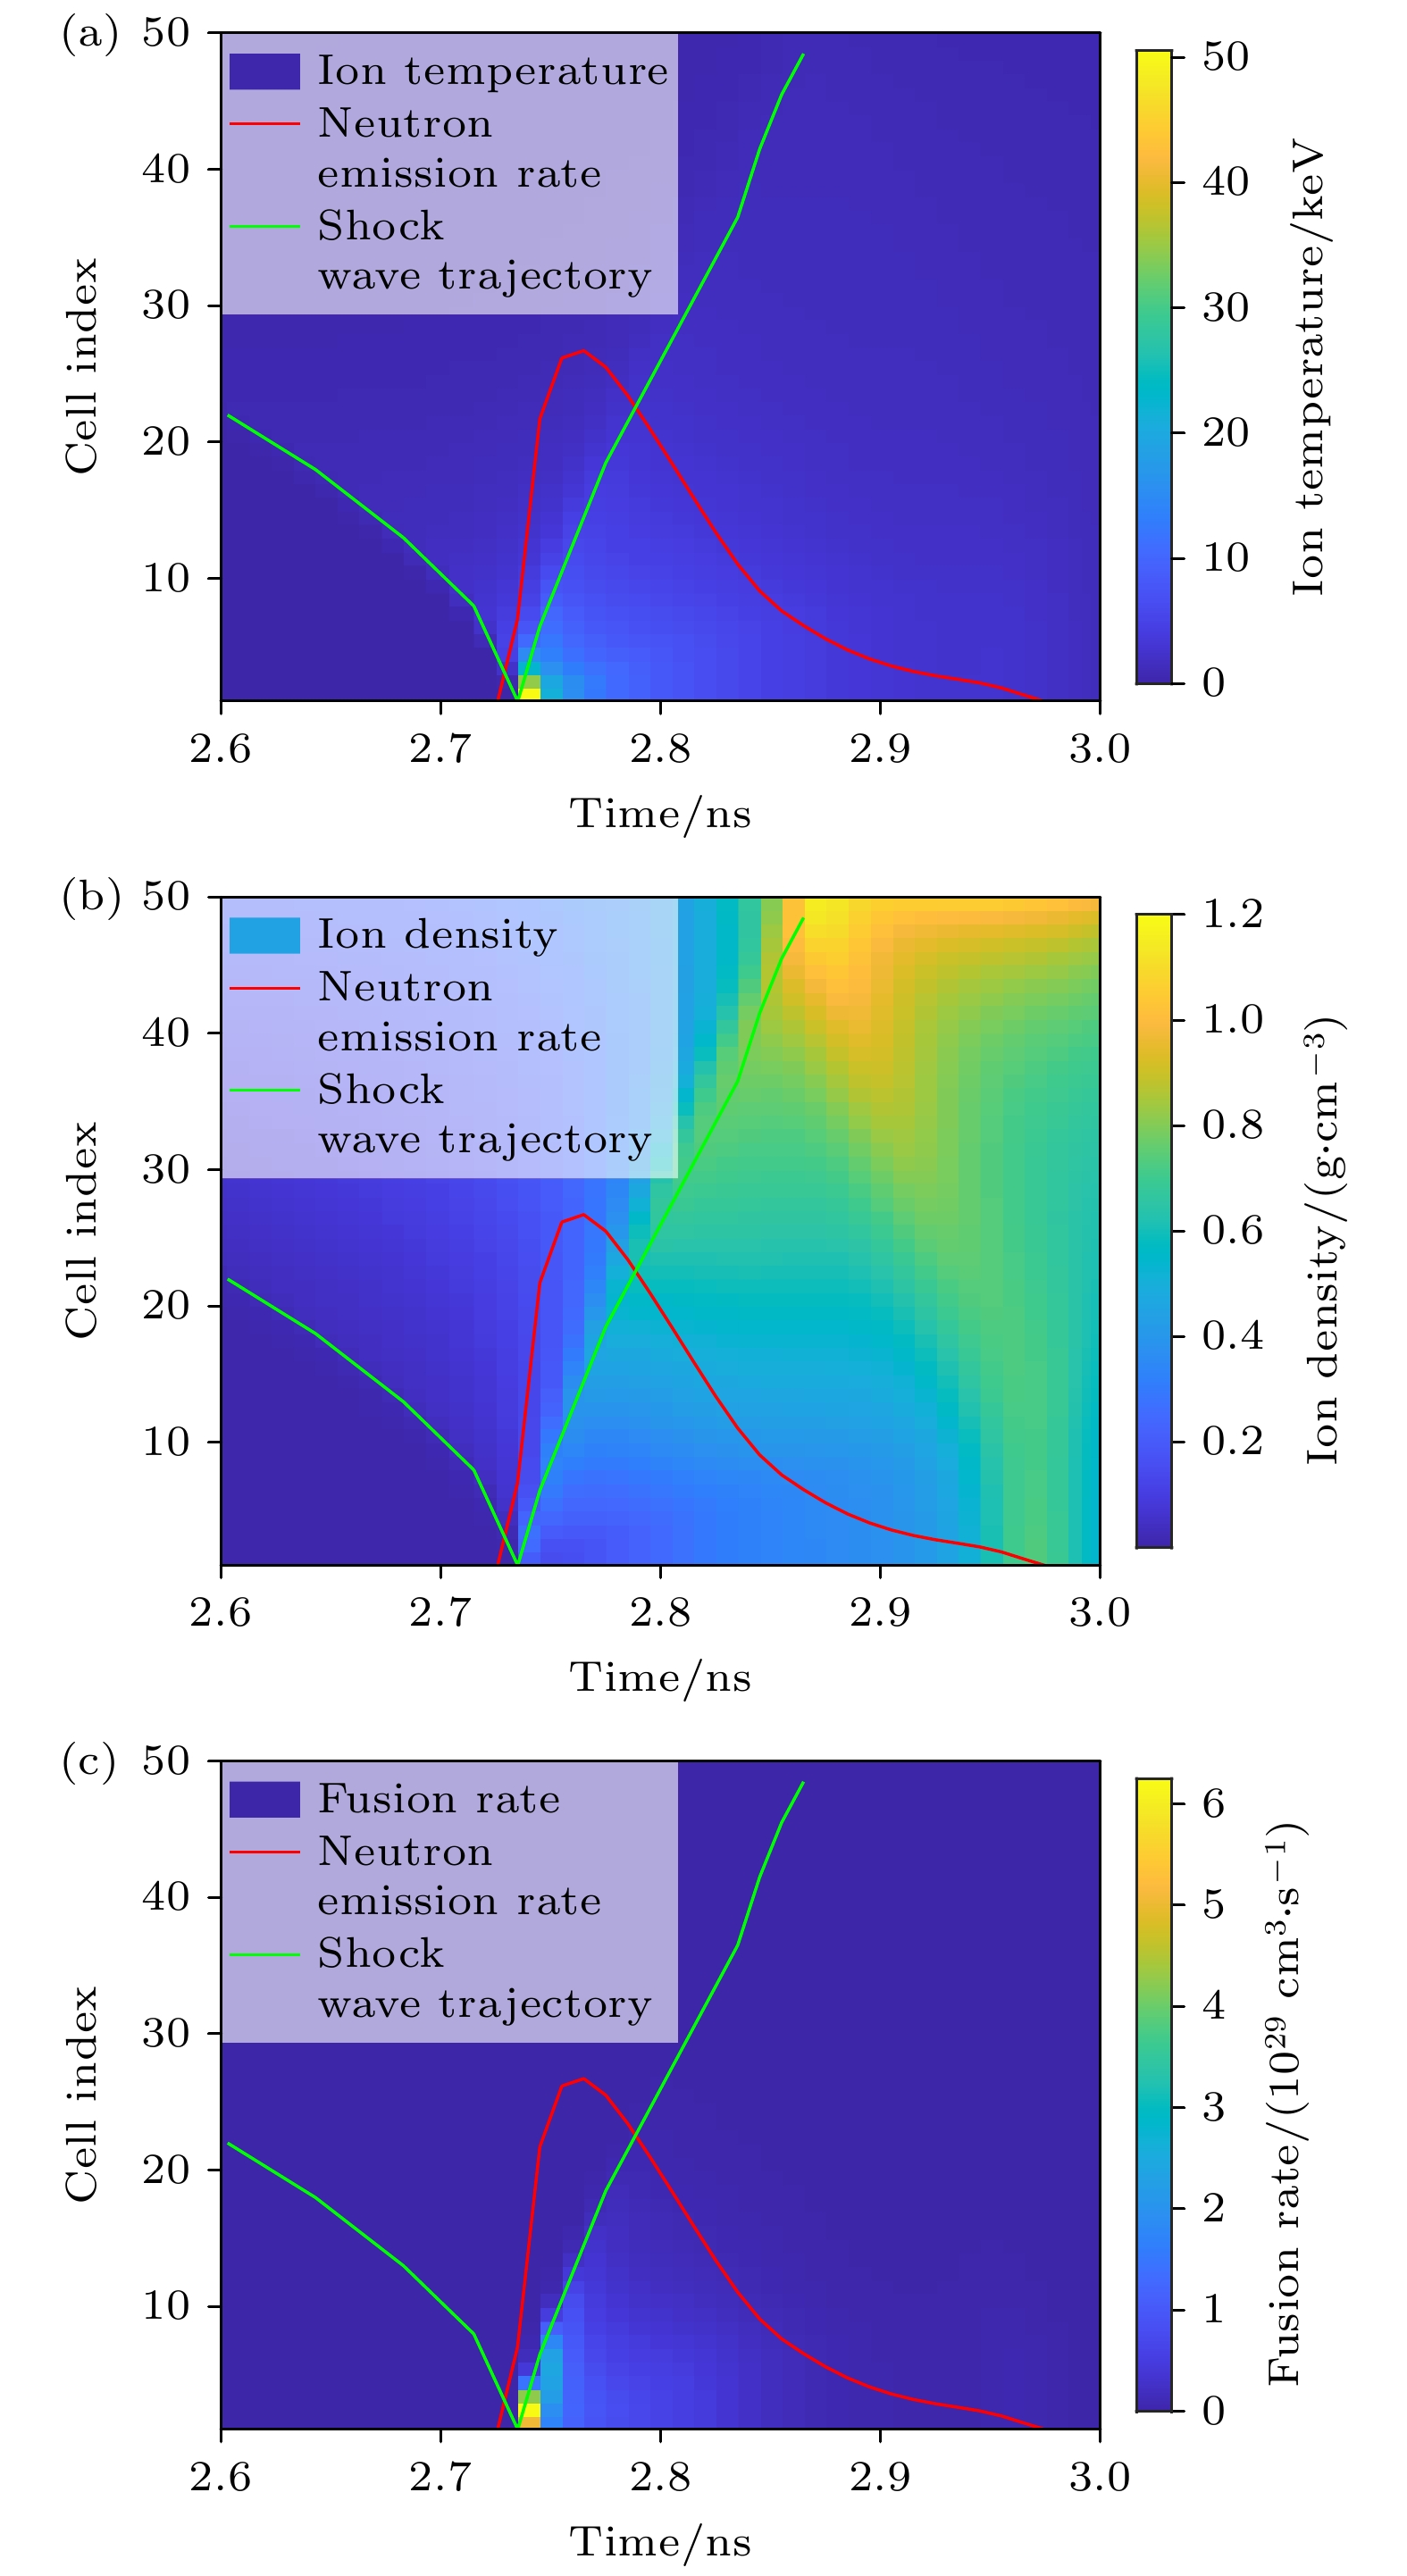
图 3 一维模拟给出的冲击压缩内爆热斑离子温度(a)、离子密度(b)和聚变反应率(c)的时空分布
Fig. 3. The one-dimensional simulation provides the temporal and spatial distributions of ion temperature (a), ion density (b), and fusion reaction rate (c) in the hot spot of the shock-compressed implosion.
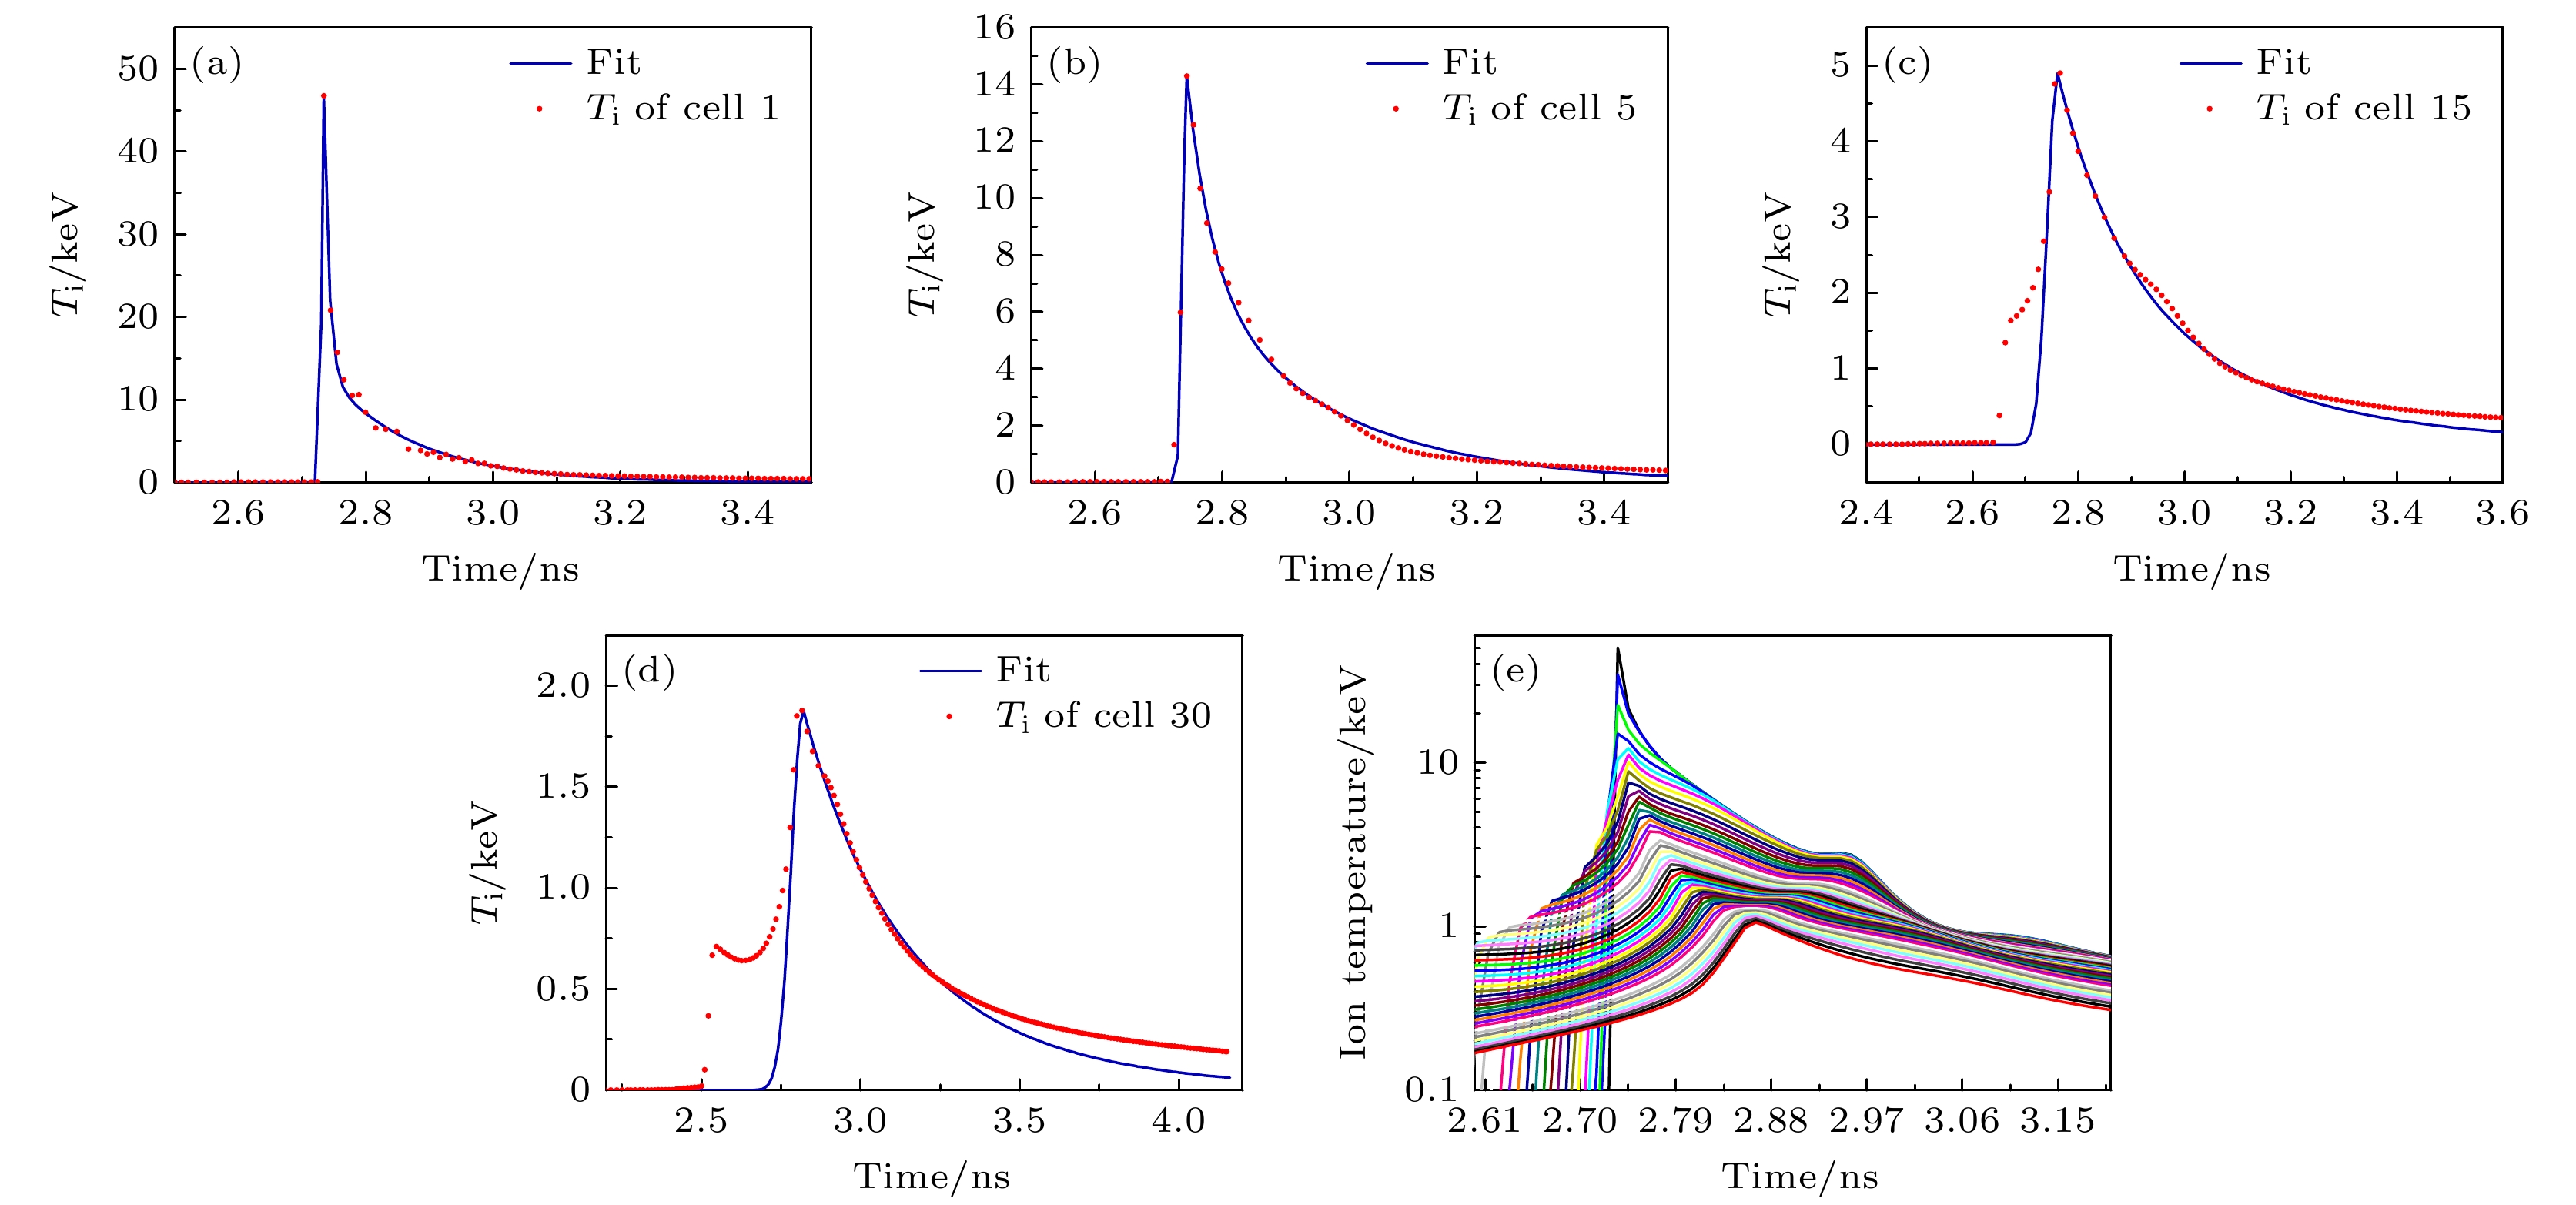
图 5 第1个(a)、第5个(b)、第15个(c)、第30个网格(d)以及所有网格(e)的燃料离子温度时间演化过程. Ti为网格的离子温度
Fig. 5. Temporal evolution of fuel ion temperature for the 1st (a), 5th (b), 15th (c), and 30th (d) grid, as well as for all grids (e). Ti is the ion temperature of the grid.

图 6 第1个 (a)、第5个 (b)、第15个 (c)和第30个 (d)网格的诊断时间窗口. Ti为网格的离子温度, x是网格的坐标
Fig. 6. Diagnostic time windows for the 1 st (a), 5 th (b), 15 th (c), and 30 th grid (d). Ti is the ion temperature of the grid, and x is the coordinate of the grid.
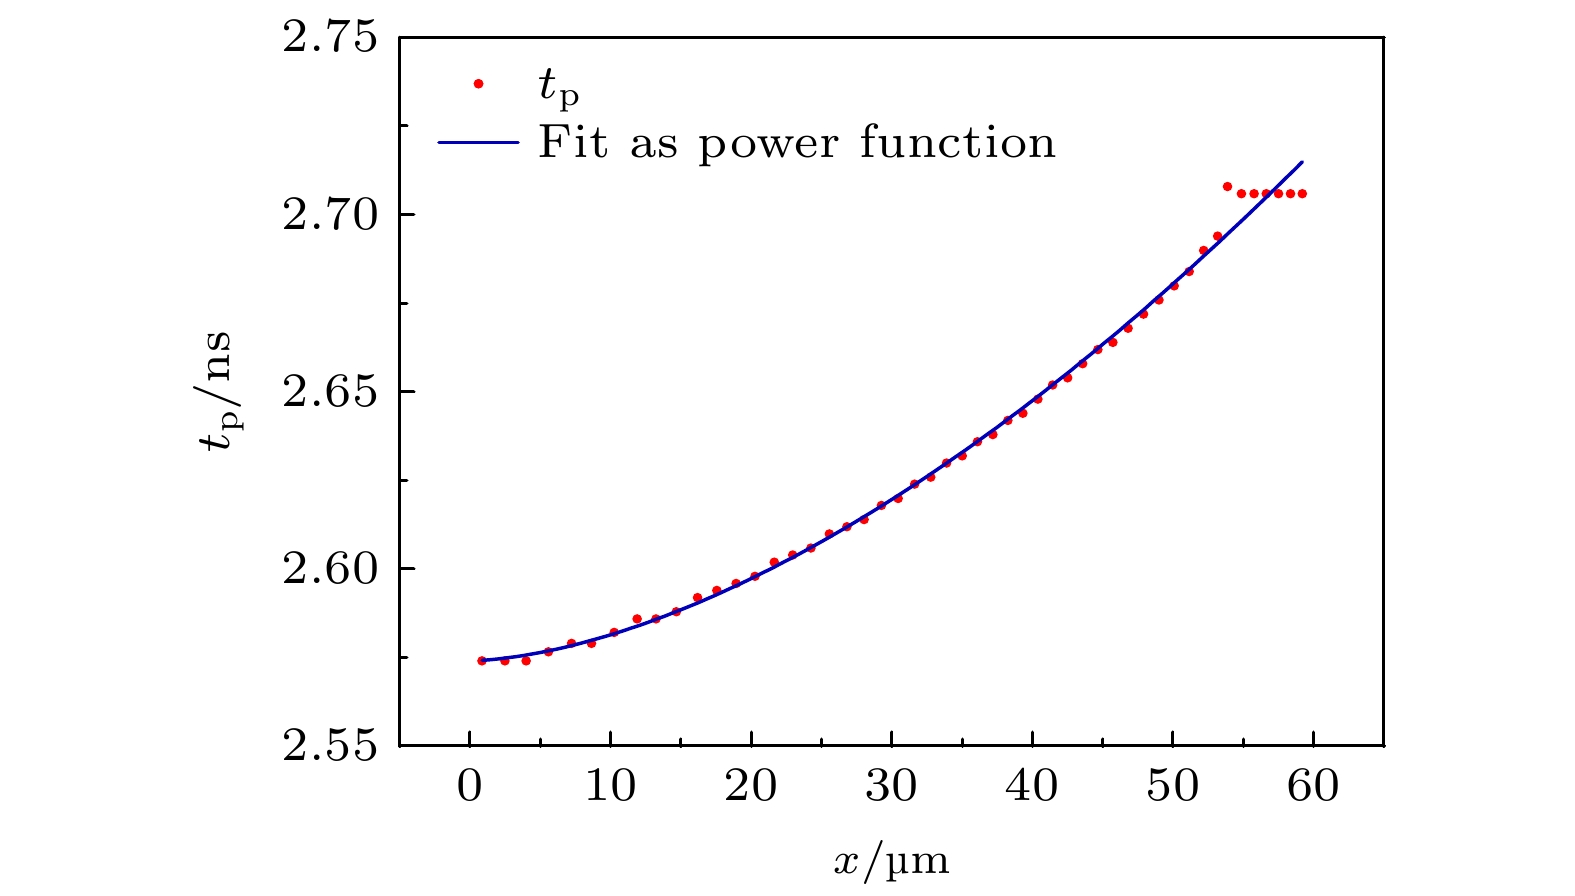
图 7 不同位置离子温度峰值时刻按照幂指数拟合, tp是温度的峰值时刻
Fig. 7. Peak ion temperature times at different locations fitted to a power-law model, where tp is the peak time of the ion temperature.
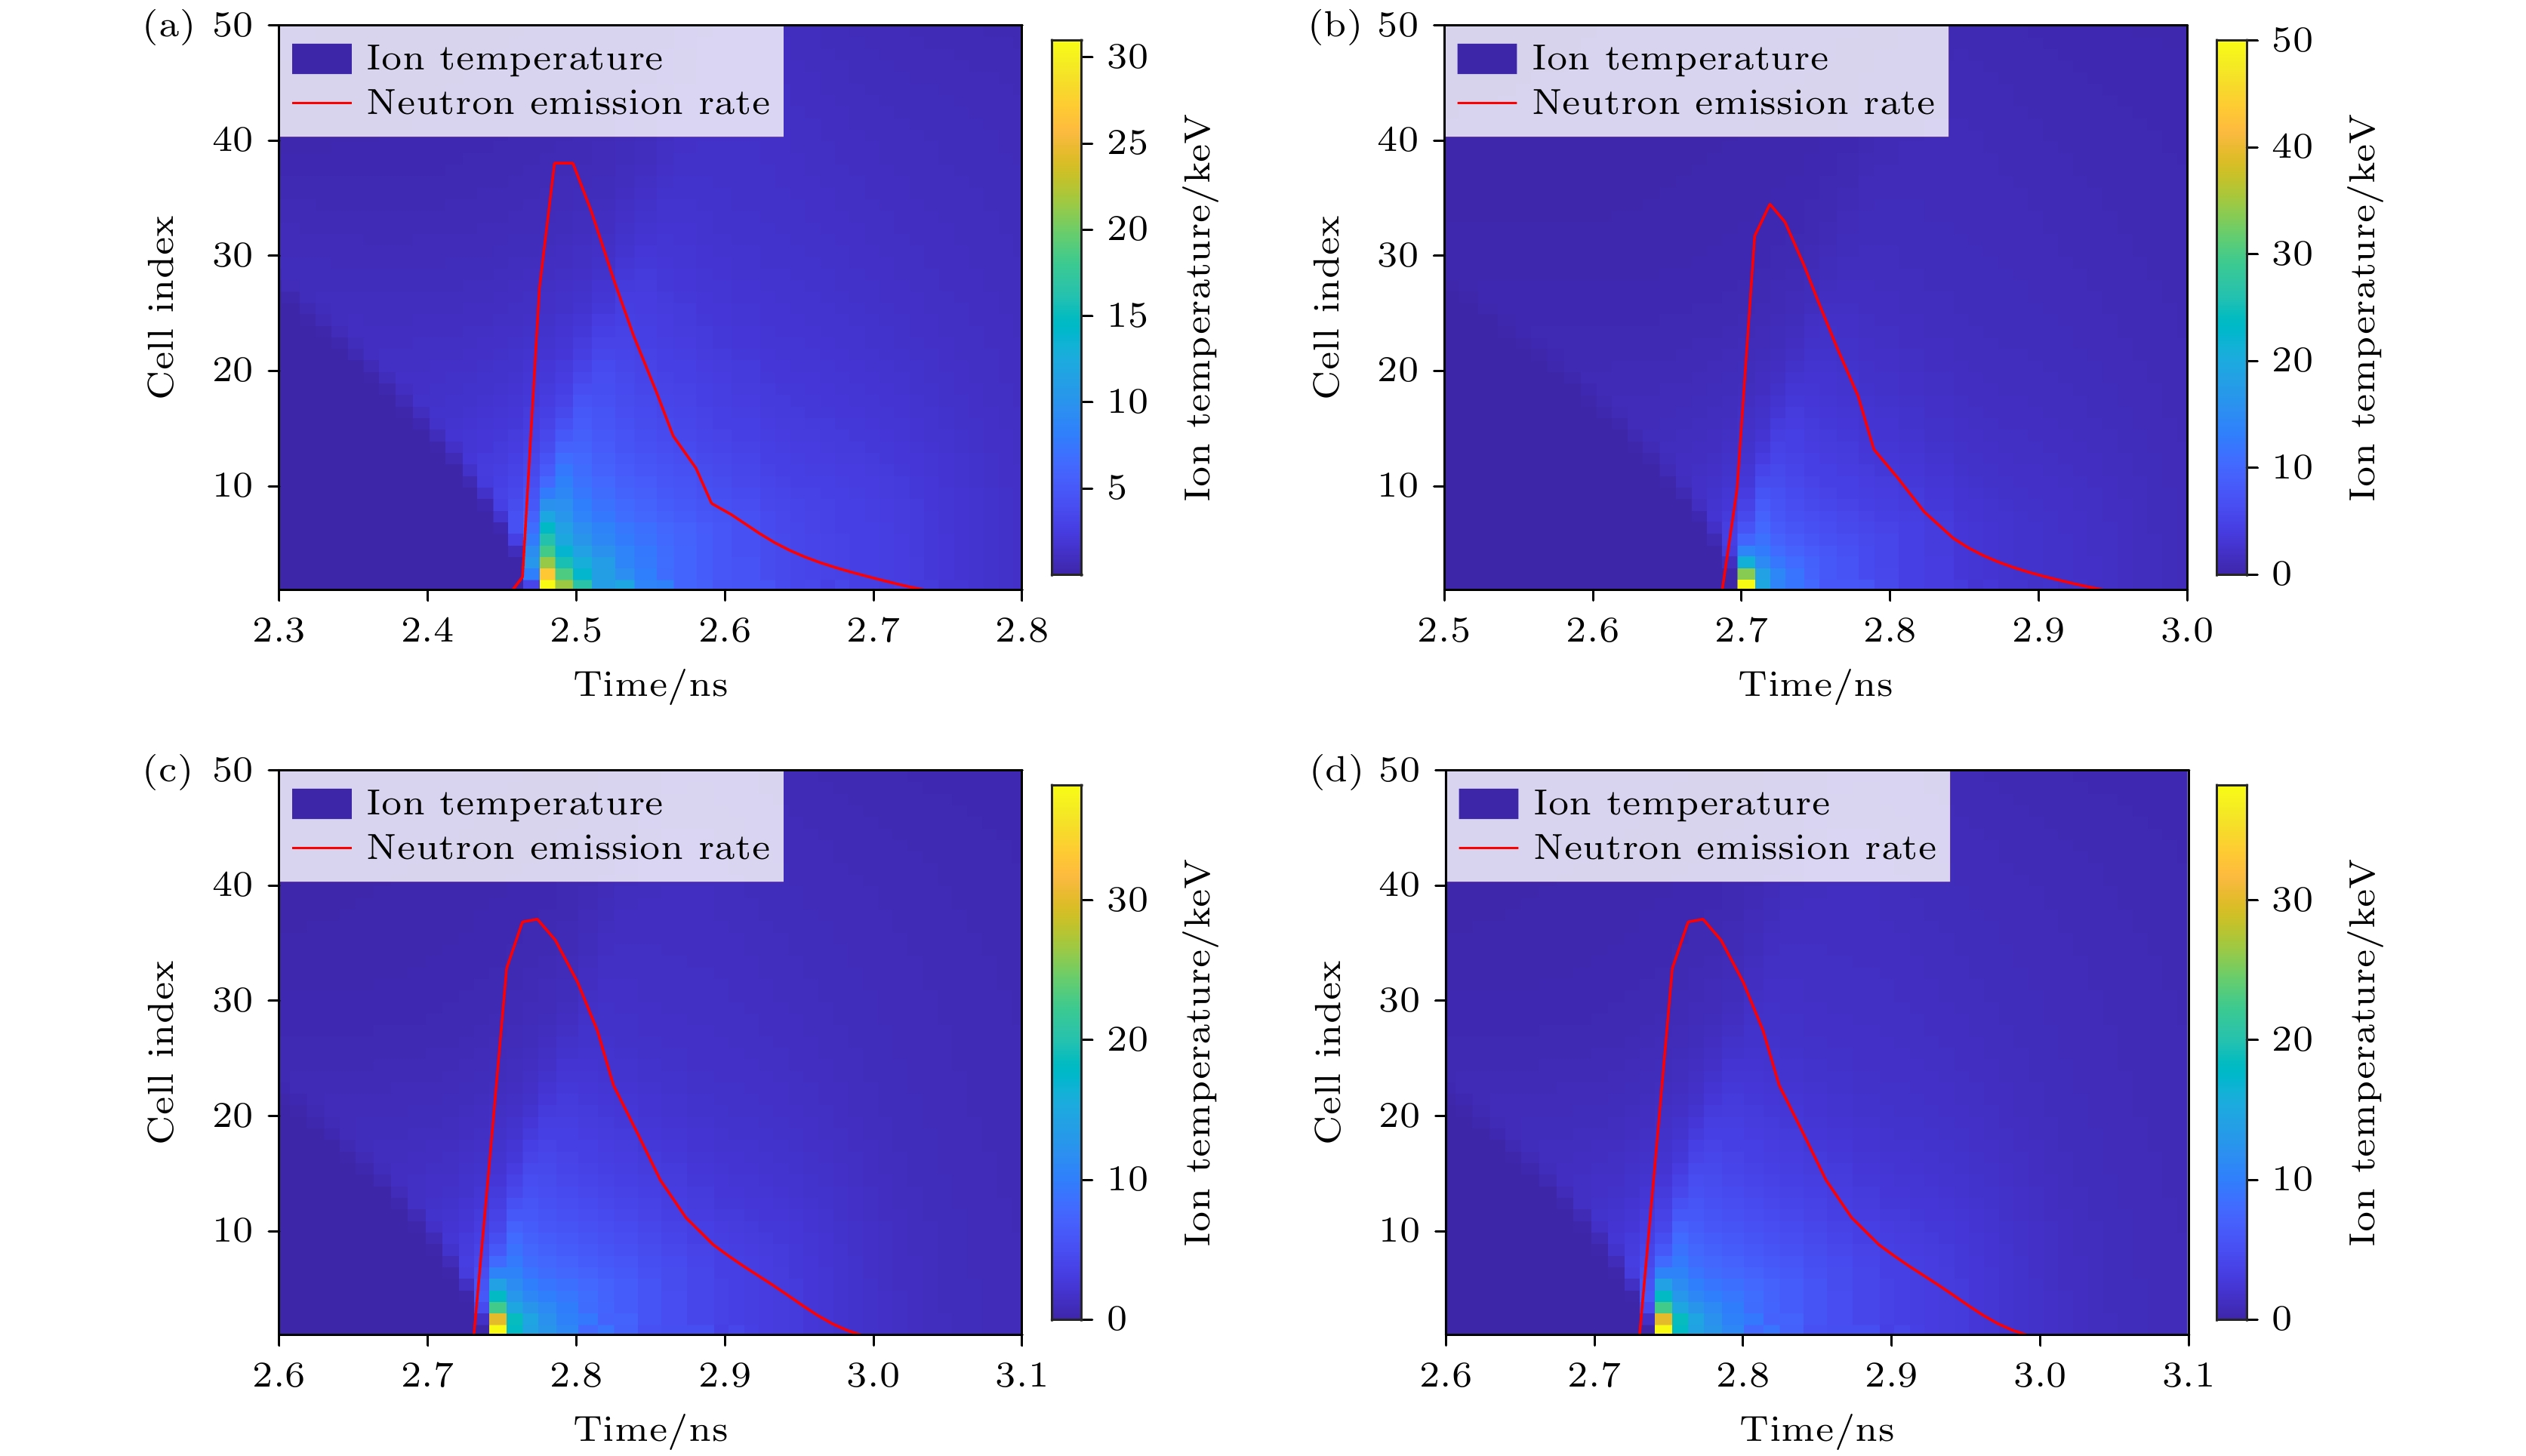
图 8 不同实验条件下离子温度的时空分布 (a)辐射强度提升1.2倍; (b)壳层厚度减薄为16 μm; (c)燃料气压降低到35 atm; (d)电子离子热传导率降低20%. 图中的红色线条是热斑的聚变速率曲线
Fig. 8. Spatio-temporal distribution of ion temperature under different experimental conditions is shown as follows: (a) Radiation intensity increased by 1.2 times; (b) shell thickness reduced to 16 μm; (c) fuel gas pressure decreased to 35 atm; (d) electron-ion thermal conductivity reduced by 20%. In all figures, the red lines indicate the fusion rate curve of the hot spots.
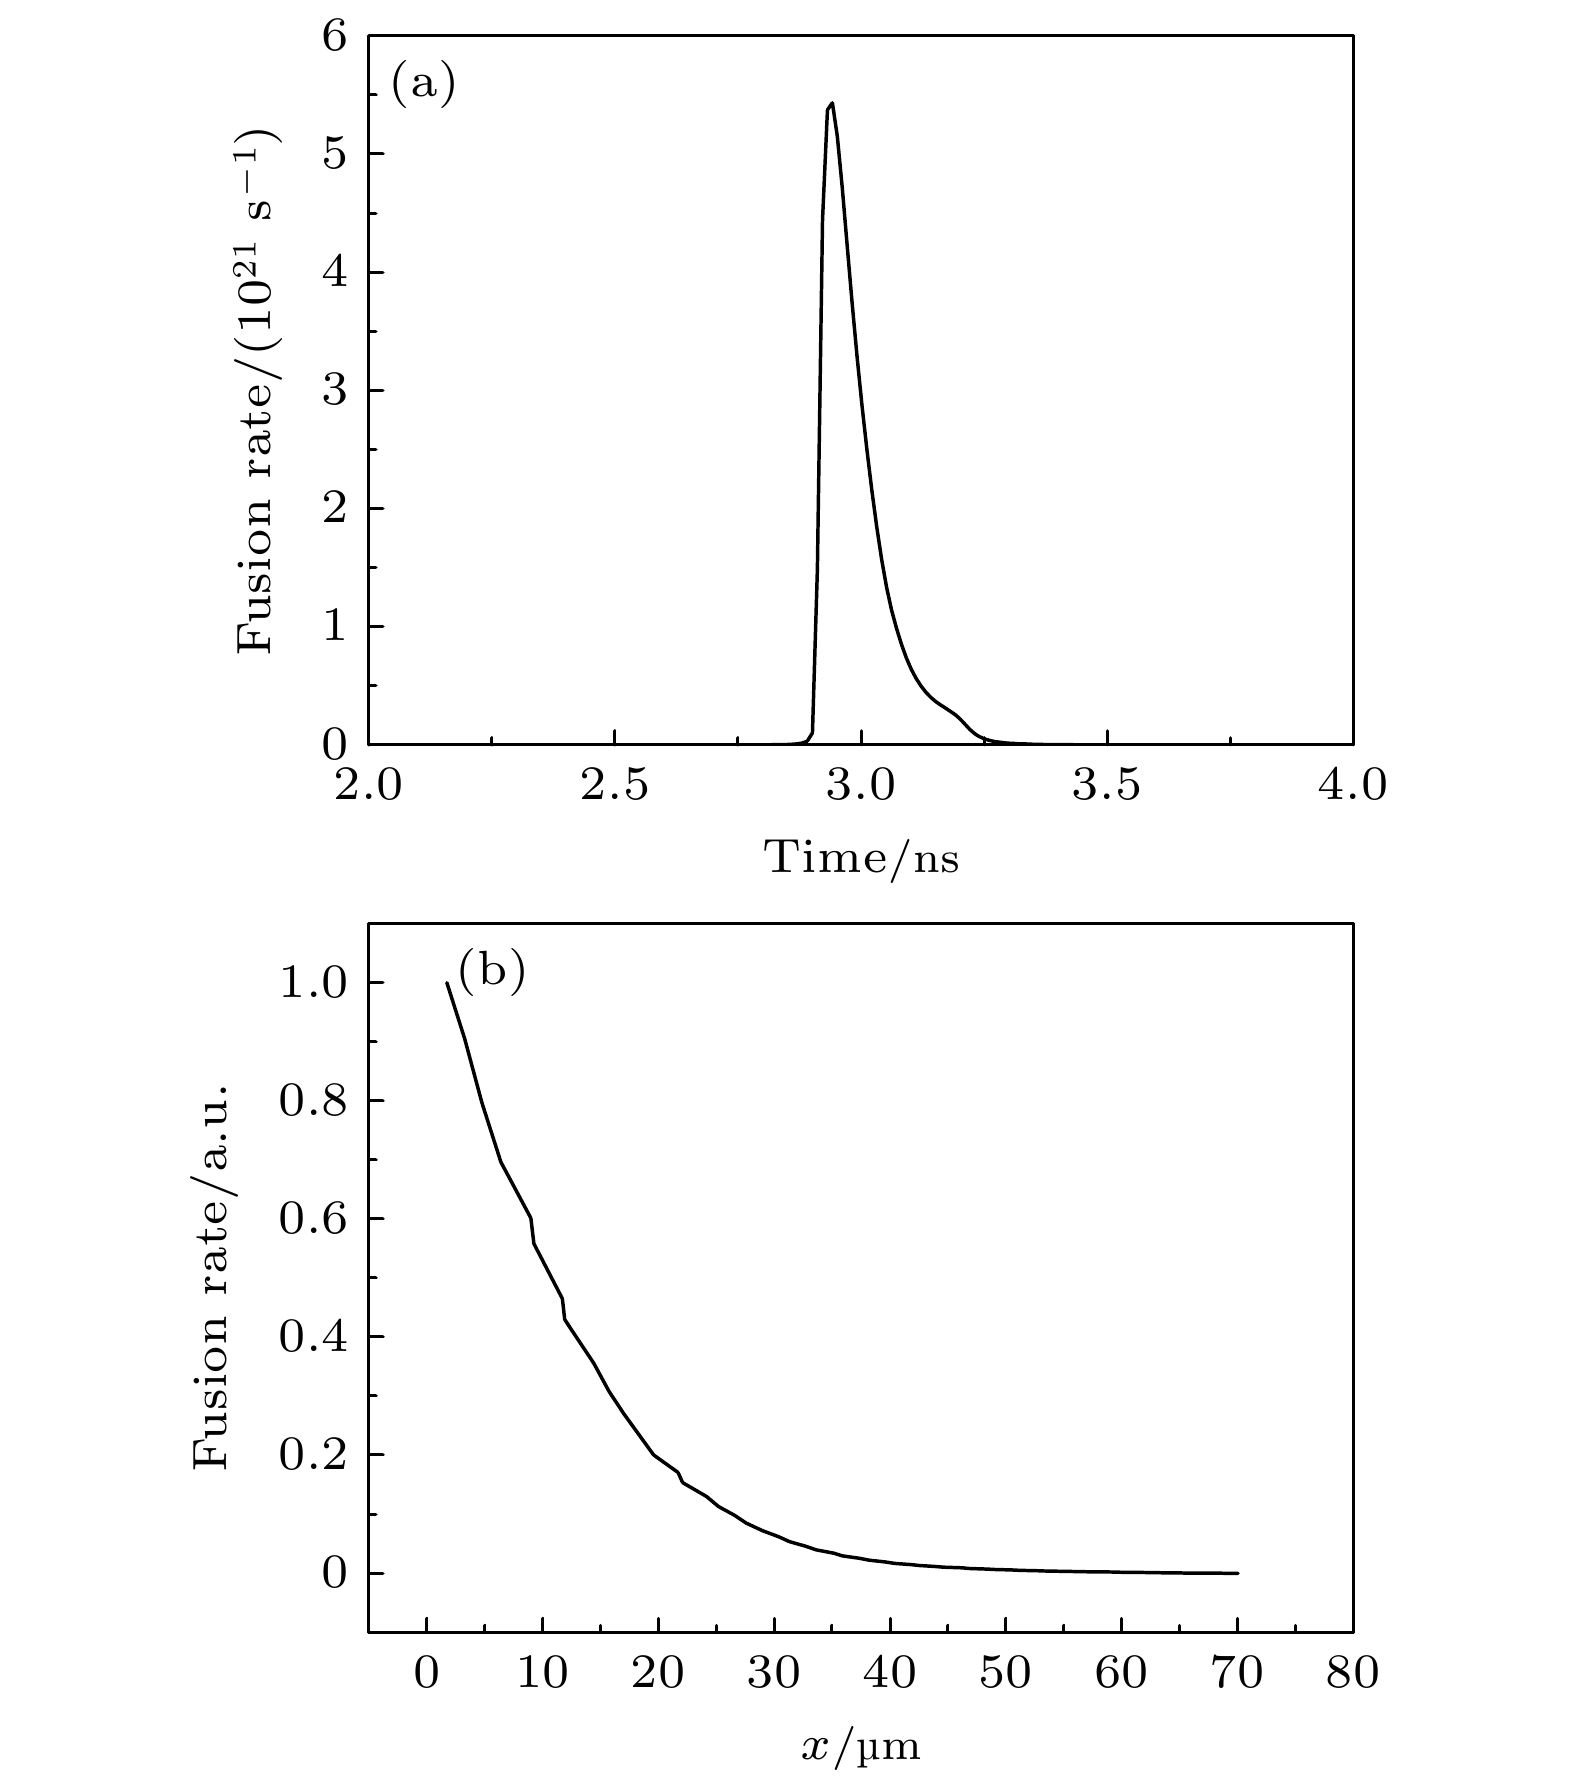
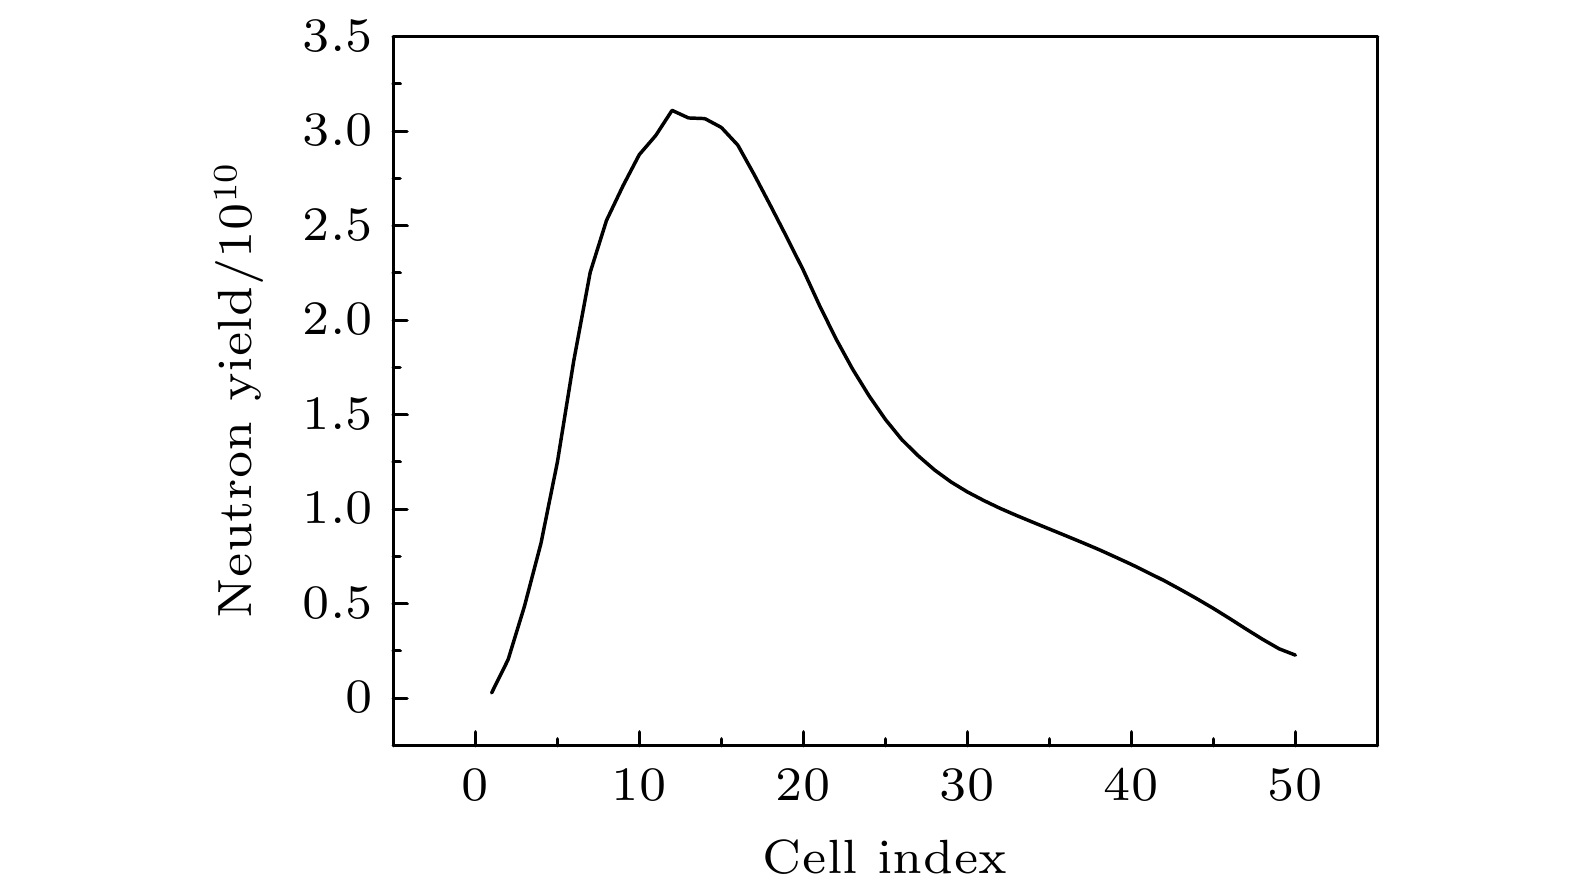
图 9 模拟实验的聚变速率曲线(a)和中子成像强度分布(b)
Fig. 9. The fusion rate curve (a) and the neutron imaging intensity distribution (b) of simulated experiment.
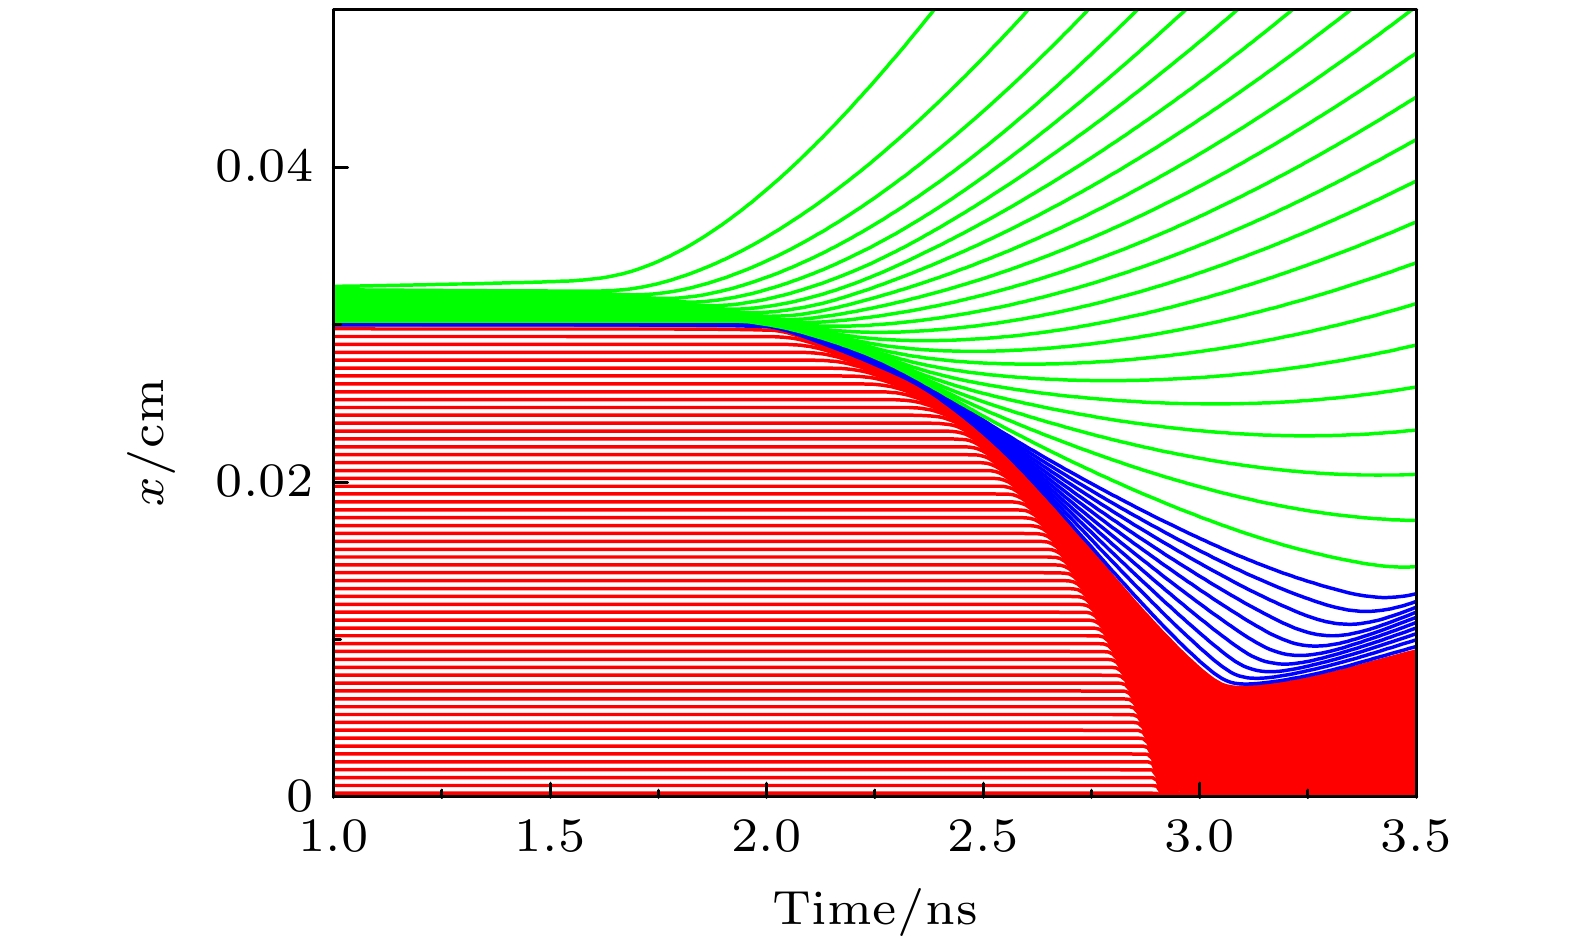
图 10 模拟实验的流线图, 其中红色线条表示DT燃料的运动轨迹, 蓝色线条表示SiO2的运动轨迹, 绿色线条表示CH的运动轨迹
Fig. 10. Simulation experiment’s streamline diagram, red lines represent the motion trajectory of DT fuel, blue lines indicate the motion trajectory of SiO2 and green lines depict the motion trajectory of CH.
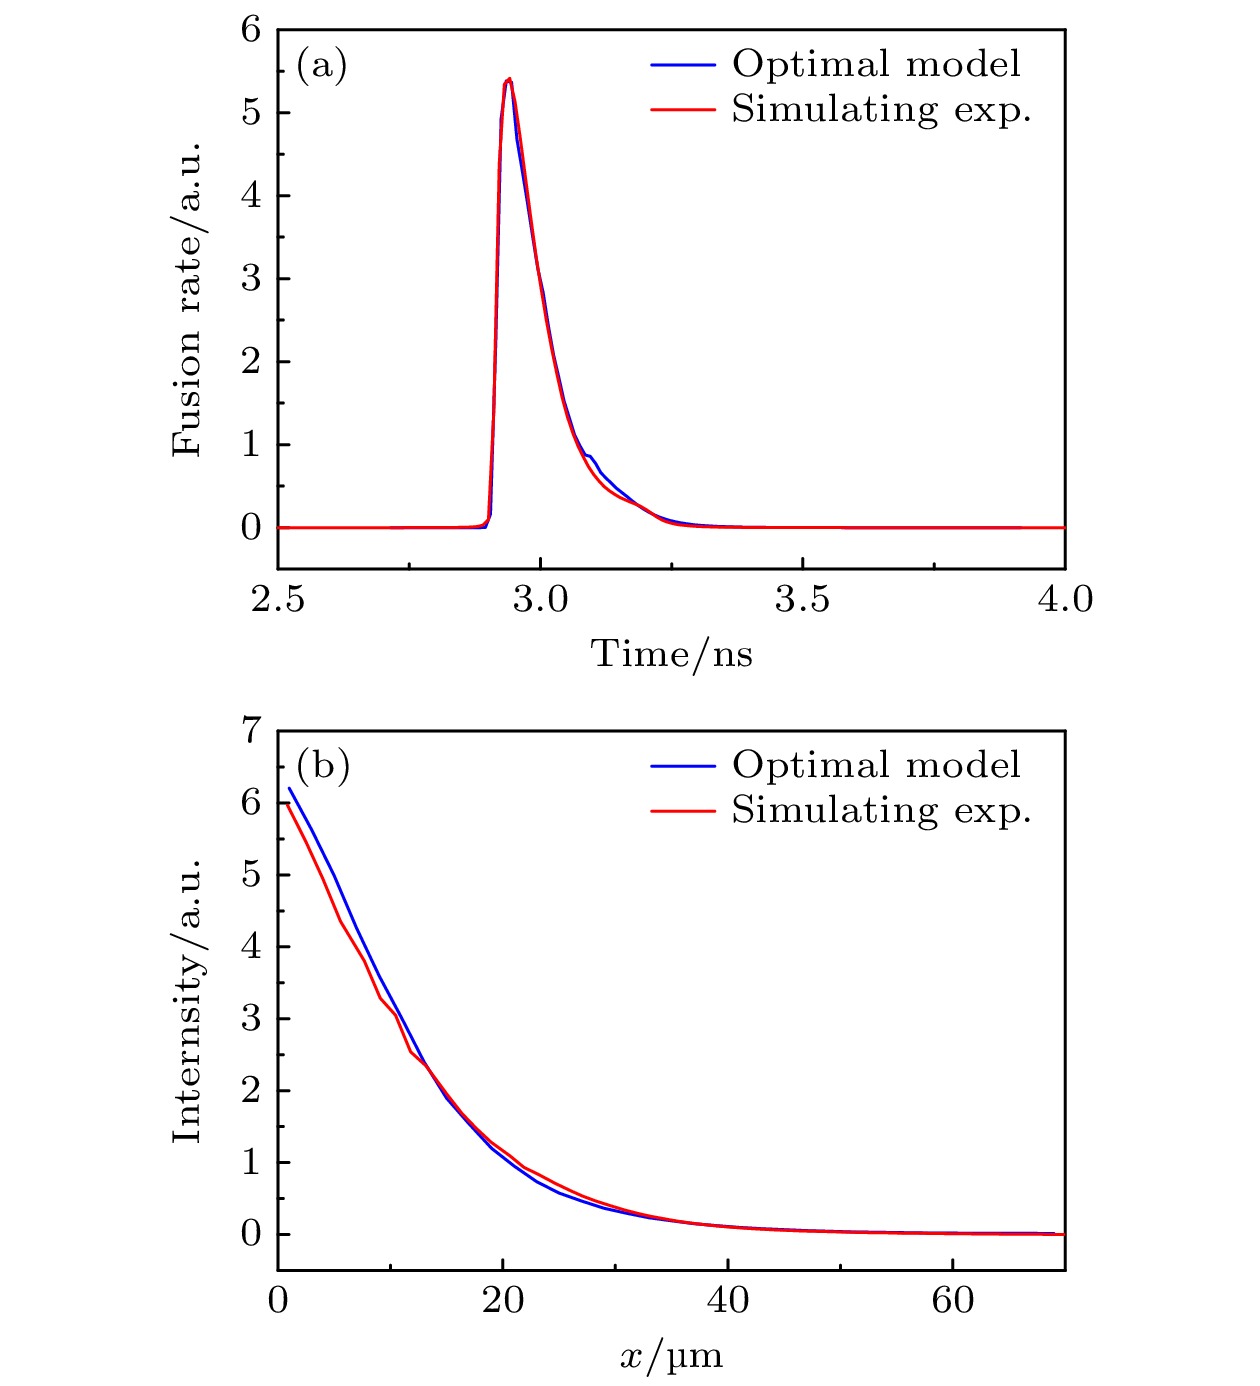
图 11 计算值对应的聚变速率曲线(a)和中子图像空间分布(b)与模拟实验诊断数据的比较
Fig. 11. Comparison of the calculated fusion rate curve (a) and the spatial distribution of neutron imaging (b) with the diagnostic data from the simulation experiments.
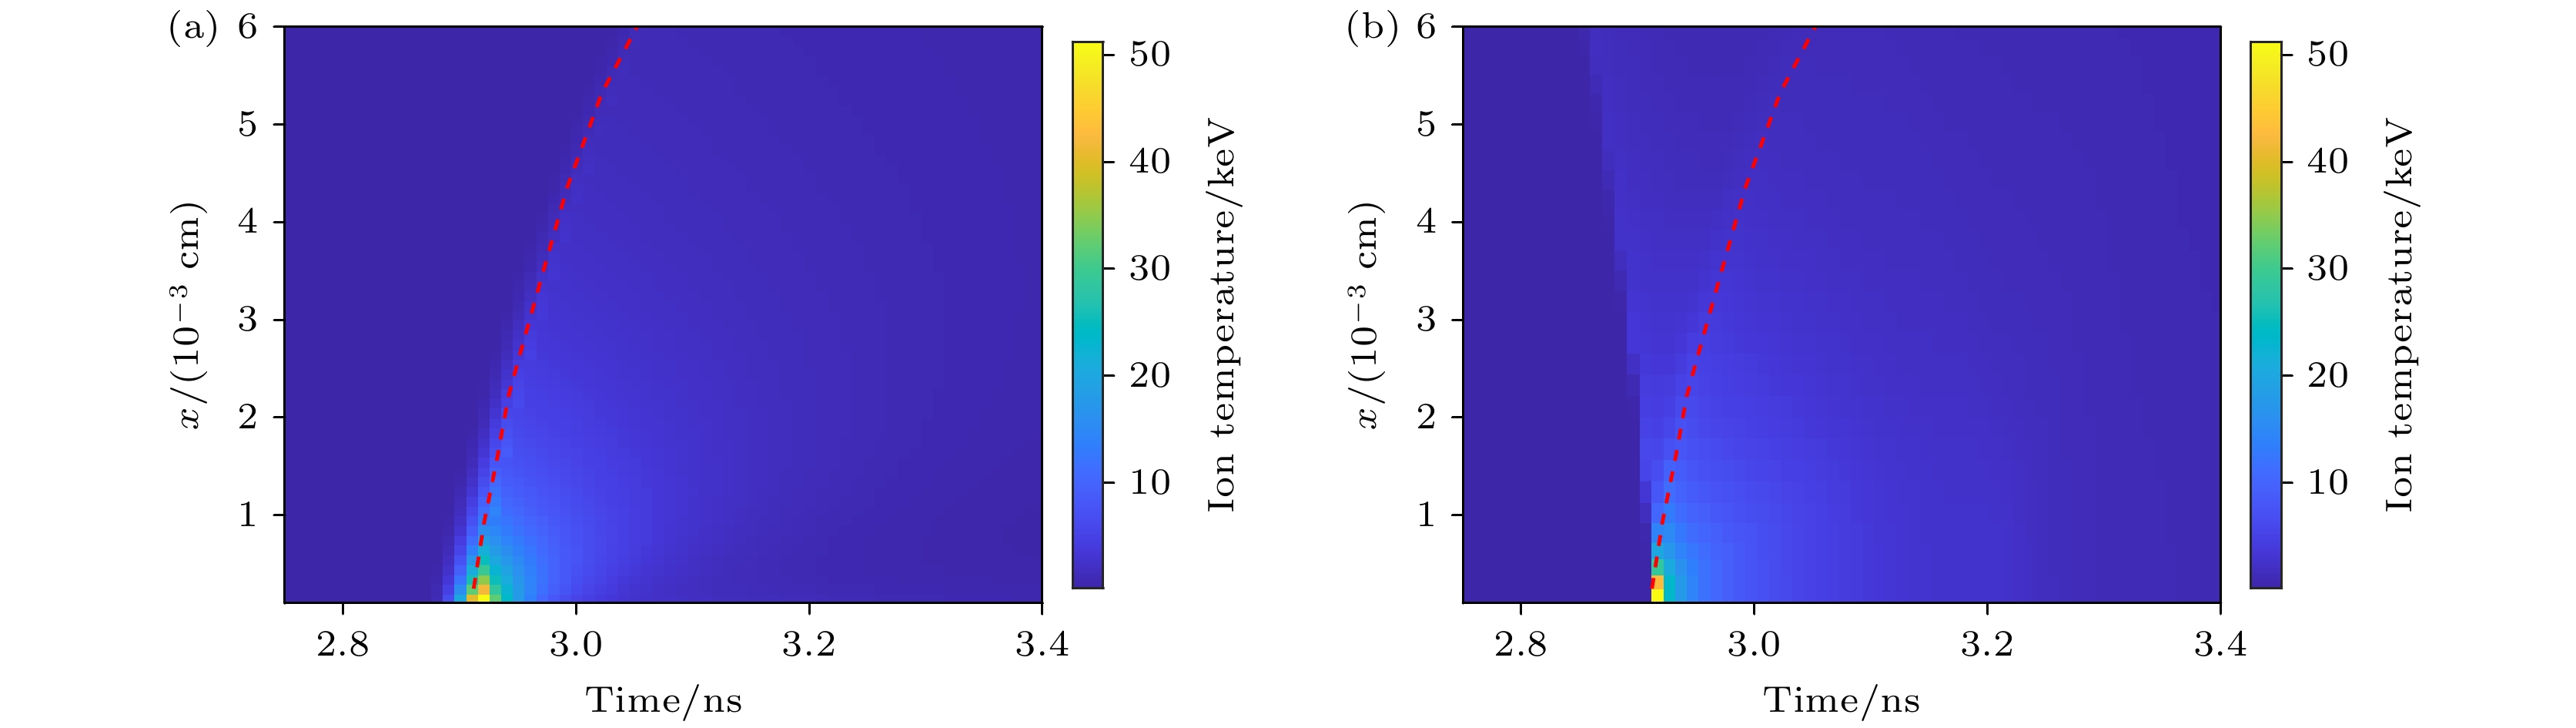
图 12 计算的离子温度时空分布(a)与模拟实验的离子温度时空分布(b). 图中的红色虚线表示冲击波的轨迹
Fig. 12. Calculated spatio-temporal distribution of ion temperature (a) compared to that from the simulation experiments (b). The red dashed line indicating the trajectory of the shock wave.
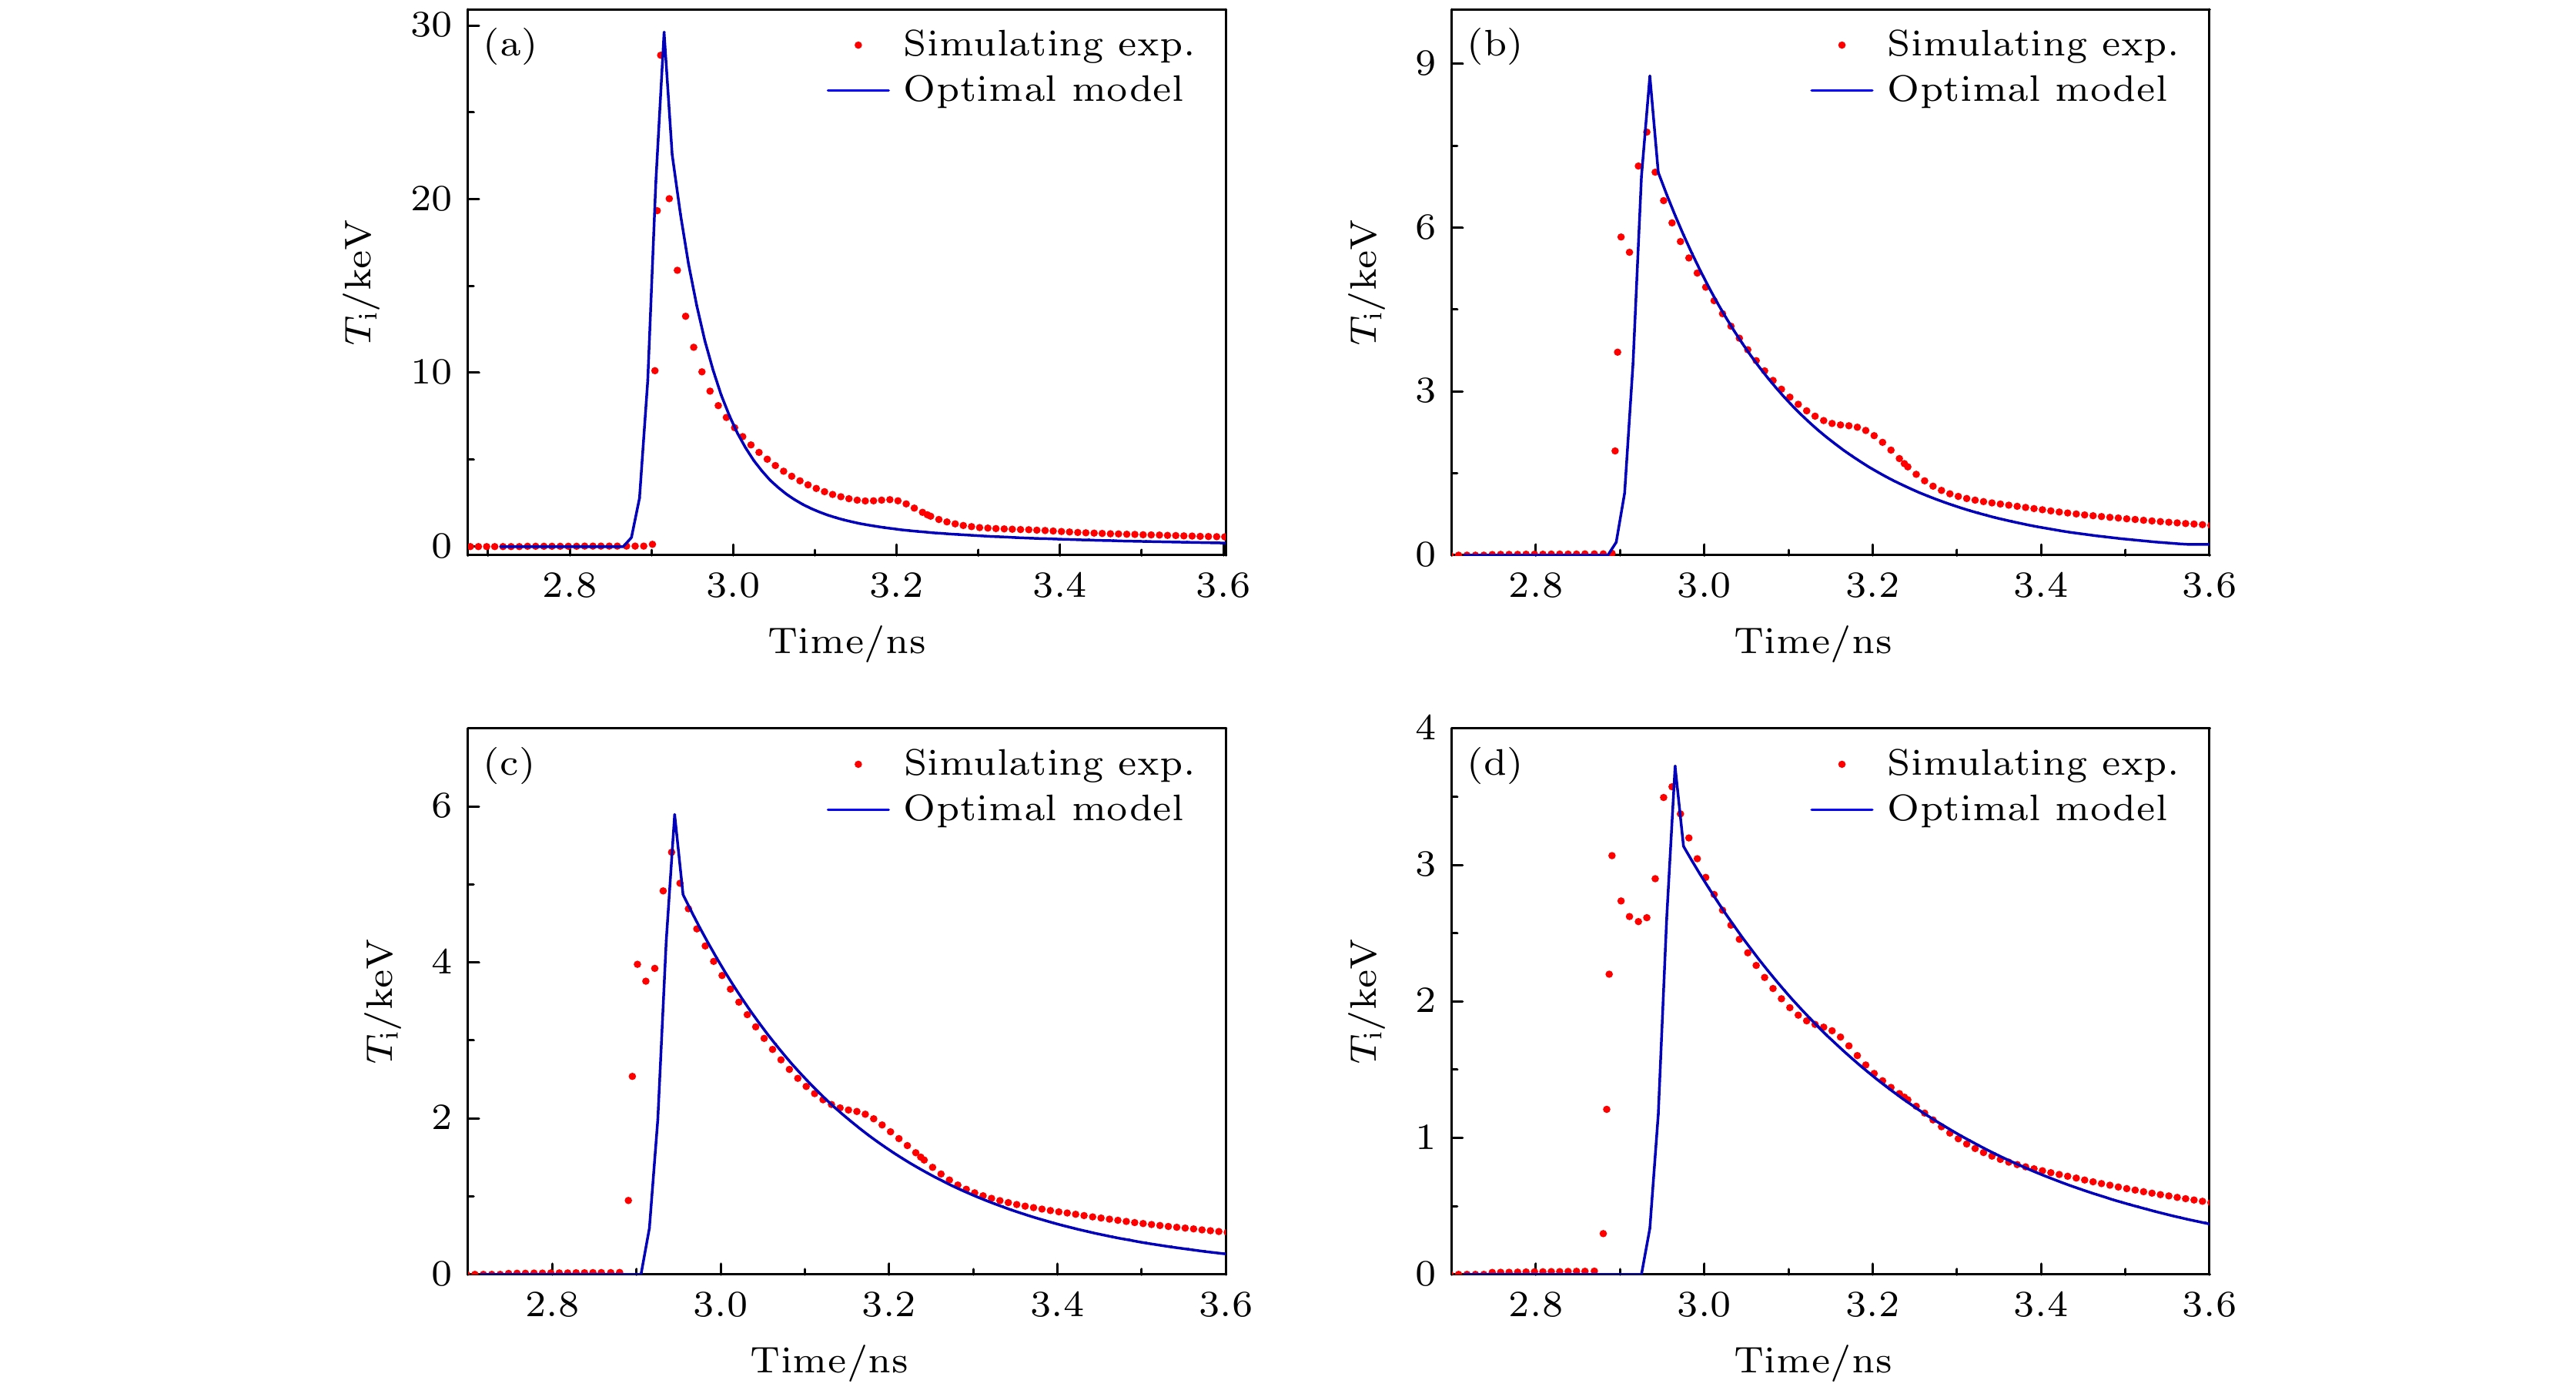
图 13 阻滞时刻距热斑中心4 μm (a)、16 μm (b)、22 μm (c)和31 μm (d) 4个体元离子温度时间曲线的计算值与模拟实验值的比较, Ti为网格的离子温度, x是网格的坐标
Fig. 13. Comparison of the calculated ion temperature time curves with the simulation values for four spatial points at distances of 4 μm (a), 16 μm (b), 22 μm (c), and 31 μm (d) from the center of the hot spot at the stagnation moment. Ti is the ion temperature of the grid, and x is the coordinate of the grid.
表 1 利用遗传算法得到的模拟实验离子温度时空分布参数的最优解
Table 1. Optimal solution for the spatio-temporal distribution parameters of ion temperature in the simulation experiments obtained using a genetic algorithm.
tp/ns t0/ns a1/(ns·cm–1) b1 2.915 230 1.45 υ/ns 0.0151 H/eV H0/cm a2/(eV·cm–1) b2 0.00698 0.345 –1.67 τ1/ns τ01/ns a3/(ns·cm–1) 0.0204 88 τ2/ns 0.284  下载: 导出CSV
-
[1] 张棋, 马积瑞, 范金燕, 张杰 2022 物理学报 71 135202
Google Scholar
Zhang Q, Ma J R, Fan J Y, Zhang J 2022 Acta Phys. Sin. 71 135202
Google Scholar
[2] 张占文, 漆小波, 李波 2012 物理学报 61 145204
Google Scholar
Zhang Z W, Qi X B, Li B 2012 Acta Phys. Sin. 61 145204
Google Scholar
[3] 张家泰, 何斌, 贺贤土, 常铁强, 许林宝 2001 物理学报 50 921
Google Scholar
Zhang J T, He B, He X T, Chang T Q, Xu L B 2001 Acta Phys. Sin. 50 921
Google Scholar
[4] 何民卿, 张华, 李明强, 彭力, 周沧涛 2023 物理学报 72 095201
Google Scholar
He M Q, Zhang H, Li M Q, Peng L, Zhou C T 2023 Acta Phys. Sin. 72 095201
Google Scholar
[5] 袁强, 胡东霞, 张鑫, 赵军普, 胡思德, 黄文会, 魏晓峰 2011 物理学报 60 015202
Google Scholar
Yuan Q, Hu D X, Zhang X, Zhao J P, Hu S D, Huang W H, Wei X F 2011 Acta Phys. Sin. 60 015202
Google Scholar
[6] 赵英奎, 欧阳碧耀, 文武, 王敏 2015 物理学报 64 045205
Google Scholar
Zhao Y K, Ouyang B Y, Wen W, Wang M 2015 Acta Phys. Sin. 64 045205
Google Scholar
[7] 高凡, 袁鹏, 黄浩彬, 寇琦, 贾青, 远晓辉, 张喆, 张杰, 郑坚 2023 物理学报 72 175203
Google Scholar
Gao F, Yuan P, Huang H B, Kou Q, Jia Q, Yuan X H, Zhang Z, Zhang J, Zheng J 2023 Acta Phys. Sin. 72 175203
Google Scholar
[8] Zylstra A B, Hurricane O A, Callahan D A, et al. 2022 Nature 601 542
Google Scholar
[9] Abu-Shawareb H, et al. (Indirect Drive ICF Collaboration) 2022 Phys. Rev. Lett. 129 075001
Google Scholar
[10] Lerche R A, Coleman L Q, Houghton J W, Speck D R, Storm E K 1977 Appl. Phys. Lett. 31 645
Google Scholar
[11] Lerche R A, Glebov V Y, Moran M J, et al. 2010 Rev. Sci. Instrum. 81 10D319
Google Scholar
[12] Glebov V Y, Sangster T C, Stoeckl C, et al. 2010 Rev. Sci. Instrum. 81 10D325
Google Scholar
[13] Tang Q, Chen J B, Xiao Y Q, Yi T, Liu Z J, Zhan X Y, Song Z F 2020 Rev. Sci. Instrum. 91 023508
Google Scholar
[14] Frenje J A, Hilsabeck T J, Wink C W, Bell P, Bionta R, Cerjan C, Johnson M G, Kilkenny J D, Li C K, Séguin F H, Petrasso R D 2016 Rev. Sci. Instrum. 87 11D806
Google Scholar
[15] Kunimune J H, Frenje J A, Berg G P A, et al. 2021 Rev. Sci. Instrum. 92 033514
Google Scholar
[16] Moore A S, Schlossberg D J, Eckart M J, Hartouni E P, Hilsabeck T J, Jeet J S, Kerr S M, Nora R C, Kilkenny J 2022 Rev. Sci. Instrum. 93 113536
Google Scholar
[17] Meaney K D, Kim Y, Hoffman N M, et al. 2022 Rev. Sci. Instrum. 93 083520
Google Scholar
[18] Birge N, Geppert-Kleinrath V, Danly C, et al. 2022 Rev. Sci. Instrum. 93 113510
Google Scholar
[19] Bleuel D L, Yeamans C B, Bernstein L A, et al. 2012 Rev. Sci. Instrum. 83 10D313
Google Scholar
[20] Stoeckl C, Boni R, Ehrne F, et al. 2016 Rev. Sci. Instrum. 87 053501
Google Scholar
[21] Ress D, Lerche R A, Ellis R J, Lane S M, Nugent K A 1988 Science 241 956
Google Scholar
[22] Fittinghoff D N, Birge N, Geppert-Kleinrath V 2023 Rev. Sci. Instrum. 94 021101
Google Scholar
[23] 余波, 应阳君, 许海波 2010 物理学报 59 5351
Google Scholar
Yu B, Ying Y J, Xu H B 2010 Acta Phys. Sin. 59 5351
Google Scholar
[24] 王胜, 邹宇斌, 温伟伟, 李航, 刘树全, 王浒, 陆元荣, 唐国有, 郭之虞 2013 物理学报 62 122801
Google Scholar
Wang S, Zou Y B, Wen W W, Li H, Liu S Q, Wang H, Lu Y R, Tang G Y, Guo Z Y 2013 Acta Phys. Sin. 62 122801
Google Scholar
[25] 章法强, 祁建敏, 张建华, 李林波, 陈定阳, 谢红卫, 杨建伦, 陈进川 2014 物理学报 63 128701
Google Scholar
Zhang F Q, Qi J M, Zhang J H, Li L B, Chen D Y, Xie H W, Yang J L, Chen J C 2014 Acta Phys. Sin. 63 128701
Google Scholar
[26] Ramis R, Schmalz R, Meyer-Ter-Vehn J 1988 Comput. Phys. Commun. 49 475
Google Scholar
[27] 李维新 2003 一维不定常流与冲击波(北京: 国防工业出版社)第343—355页
Li W X 2003 One-Dimensional Nonsteady Flow and Shock Waves (Beijing: National Defense Industry Press) pp343–355

 下载:
下载:
计量
- 文章访问数: 1782
- PDF下载量: 44
- 被引次数: 0
