


-
Based on Josephson junction (JJ), superconducting quantum bit (qubit) is operated at frequencies of several GHz. Dissipation of JJs in this frequency range can cause energy relaxation in qubits, and limit coherence time, therefore it is highly concerned and needs to be determined quantitatively. The dissipation of JJs can be quantified by microwave quality factor. It is usually done at very low temperature (~mK) to determine whether a JJ is suitable for qubit devices by measuring the quality factor. In this paper, a method based on nonlinear frequency response of JJs is proposed to determine the quality factor. This method can be used in thermal activation regime, which may bring great conveniences to experiments. To analyze high frequency properties of JJs, the dynamic equation of a current-biased JJ, which describes high frequency oscillation of the JJ, is introduced. A fourth-order potential approximation is used to obtain the analytical equation of non-linear response. The dependence on quality factor, as well as on amplitude, of difference between JJ’s plasma frequency and resonant frequency, is derived from the equation. The approximate treatment is quantitatively validated by our numerical simulations with practical JJ parameters including different environment influences. Thus, based on nonlinear frequency response of JJs, a reliable and simple method to determine quality factor of JJ is proposed, which is desirable for exploring JJ based microwave devices such as parametric amplifier, superconducting qubit. Being driven well into the nonlinear microwave response regime, due to frequency-amplitude interaction, the resonant frequency of a current bias JJ deviates from the JJ’s plasma frequency. The deviation is directly related to the microwave quality factor. Hence, the quality factor can be deducted from the experimental measurement of the resonant frequency deviation, with different microwave power values applied. In comparison with linear resonance experiment, the nonlinear resonance used by the proposed method produces stronger signal. Therefore it is more robust against external noise. When being conducted at high temperature, the proposed method is more reliable. The accuracy of the measured quality factor primarily depends on those of the JJ’s parameters such as critical current and capacitance, while those parameters can be experimentally determined with high precision.
-
Keywords:
- Josephson junction /
- nonlinear resonance /
- quality factor /
- qubit
[1] Devoret M H Schoelkopf R J 2013 Science 339 1169
 Google Scholar
[2] van Theodore D, Charles W T 1998 Principles of Superconductive Devices and Circuits Second Edition (Upper Saddle River: Prentice Hall) p194
[3] Mattis D C, Bardeen J 1958 Phys. Rev. 111 412
Google Scholar
[4] Leggett A J, Chakravarty S, Dorsey A T, Fisher M P A, Garg A, Zwerger W 1987 Rev. Mod. Phys. 59 1
Google Scholar
[5] Makhlin Y, Schön G, Shnirman A 2001 Rev. Mod. Phys. 73 357
Google Scholar
[6] Martinis J M, Cooper K B, McDermott R, Steffen M, Ansmann M, Osborn K D, Cicak K, Oh S, Pappas D P, Simmonds R W, Yu C C 2005 Phys. Rev. Lett. 95 210503
Google Scholar
[7] Tinkham M 2004 Introduction to Superconductivity (2nd Ed.) (Dover) p76
[8] Pop I M, Geerlings K, Catelani G, Schoelkopf R J, Glazman L I, Devoret M H 2014 Nature 508 369
Google Scholar
[9] Yan F, Gustavsson S, Kamal A, Birenbaum J, Sears A P, Hover D, Gudmundsen T J, RosenBerg D, Samach G, Weber S, Yoder J L, Orlando T P, Clarke J, Kerman A J, Oliver W D 2016 Nat. Commun. 7 12964
Google Scholar
[10] Cosmelli C, Carelli P, Castellano M G, Chiarello F, Diambrini Palazzi G, Leoni R, Torrioli G 1999 Phys. Rev. Lett. 82 5357
Google Scholar
[11] Han S, Rouse R 2001 Phys. Rev. Lett. 86 4191
Google Scholar
[12] Dutta S K, Xu H, Berkley A J, Ramos R C, Gubrud M A, Anderson J R, Lobb C J, Wellstood F C 2004 Phys. Rev. B 70 140502
Google Scholar
[13] Han S, Yu Y, Chu X, Chu S, Wang Z 2001 Science 293 1457
Google Scholar
[14] McCumber D E 1968 J. Appl. Phys. 39 3113
Google Scholar
[15] Stewart W C 1968 Appl. Phys. Lett. 12 277
Google Scholar
[16] Landau L D, Lifshitz E M 2007 Mechanics Third Edition (Beijing: World Publishing Corporation) p88
[17] Li S X, Yu Y, Zhang Y, Qiu W, Han S, Wang Z 2002 Phys. Rev. Lett. 89 098301
Google Scholar
[18] Martinis J M, Nam S, Aumentado J 2002 Phys. Rev. Lett. 89 117901
Google Scholar
[19] Devoret M H, Esteve D, Martinis J M, Cleland A, Clarke J 1987 Phys. Rev. B 36 58
Google Scholar
[20] Manucharyan V E, Boaknin E, Metcalfe M, Vijay R, Siddiqi I, Devoret M 2007 Phys. Rev. B 76 014524
Google Scholar
[21] Mao B, Han S 2007 IEEE Trans. Appl. Supercond. 17 94
Google Scholar
[22] Sun G, Chen J, Ji Z, Xu W, Kang L, Wu P, Dong N, Mao G, Yu Y, Xing D 2006 App. Phys. Lett. 89 082516
Google Scholar
-
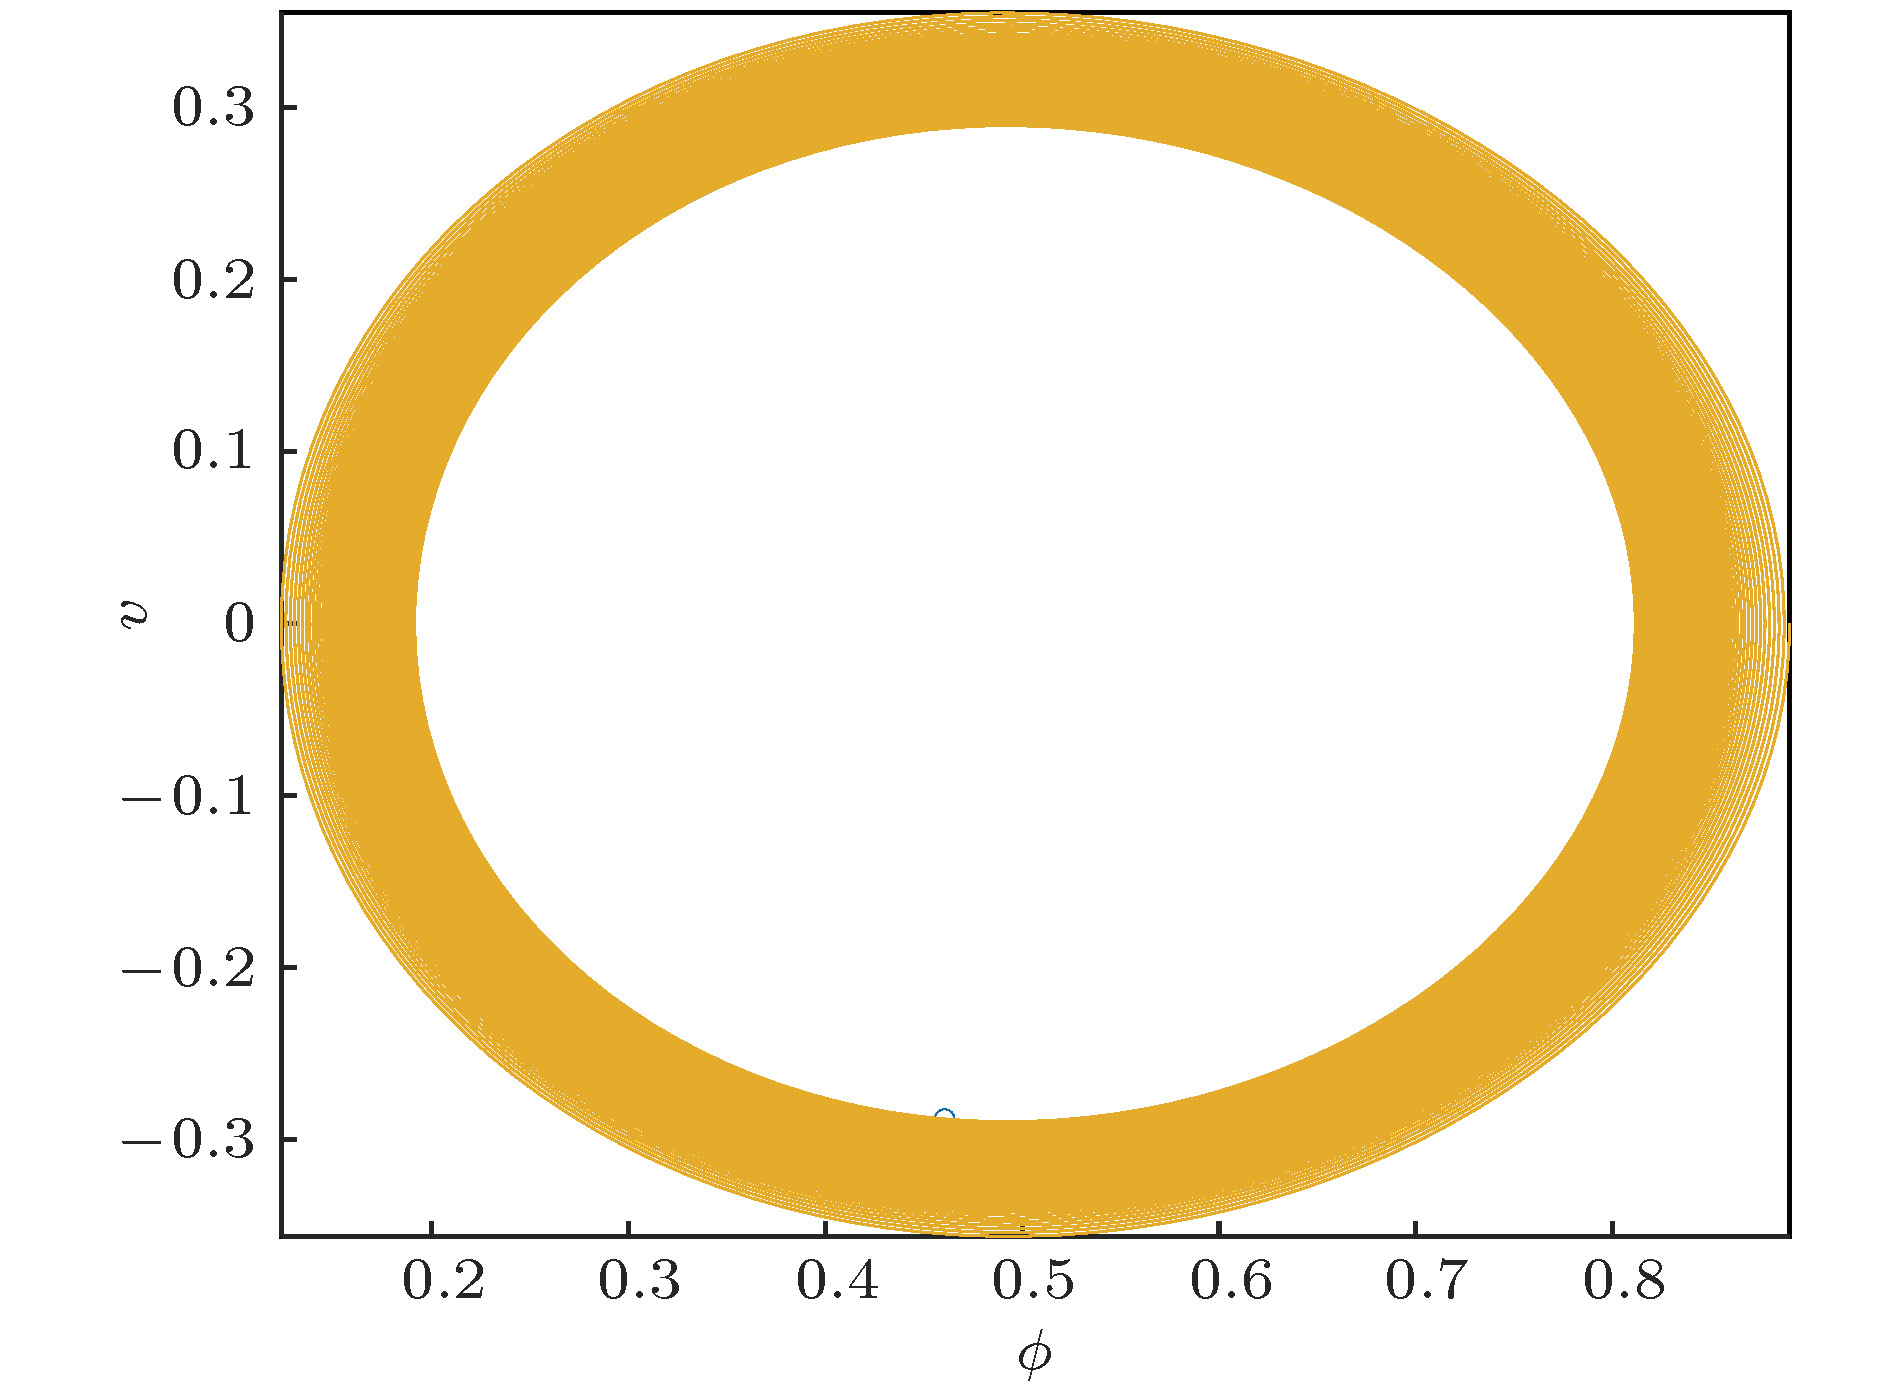
图 1 计算得到的相位粒子在相空间中的运动轨迹 纵坐标
$ v = {{{\rm{d}}\phi } / {{\mathop{\scriptsize\rm d}\nolimits} \tau }}$ , 计算采用的实验参数为${i_{{\rm{dc}}}} = {\rm 0.473},{i_{{\rm{rf}}}} =$ $ {\rm 5.5} \times {\rm 10^{ - 4}}$ , γ = 0.9306Figure 1. Calculated trajectory of phase particle with experiment parameters for junction 3:
${i_{{\rm{dc}}}} = 0.473$ ,${i_{{\rm{rf}}}} = 5.5 \times $ 10–4, γ = 0.9306. Vertical axis$v = {{{\rm{d}}\phi } / {{\rm{d}}\tau }}$ .
图 2 结(
${I_{\rm{C}}} = 8$ μA, Q = 515.7)在不同的微波驱动下, (5)式(曲线)和模拟(误差棒)得到的响应振幅b随归一直流偏置${i_{\rm{dc}}}$ 的函数变化关系, 响应曲线按其最大振幅从小到大顺序对应的外加微波强度分别为${i_{{\rm{rf}}}}={\rm{ 1}}.{\rm{63}} \times {\rm{1}}{{\rm{0}}^{ - 4}},{\rm{ 2}}.{\rm{44}} \times $ ${\rm{1}}{{\rm{0}}^{ - 4}},{\rm{ 3}}.{\rm{67}} \times {\rm{1}}{{\rm{0}}^{ - 4}}$ 和$ {\rm{5}}.{\rm{50}} \times {\rm{1}}{{\rm{0}}^{ - 4}}$ , 点划线显示了最大振幅对应的${i_{{\rm{dc}}}}$ 随外加微波强度的变化Figure 2. Microwave response curves obtained by Eq. (5) (curves) and numerical simulation (error bars), for junction (
${I_{\rm{C}}} = 8$ μA, Q = 515.7) with applied microwave${i_{{\rm{rf}}}}=$ ${\rm{ 1}}.{\rm{63}} \times {\rm{1}}{{\rm{0}}^{ - 4}},{\rm{ 2}}.{\rm{44}} \times {\rm{1}}{{\rm{0}}^{ - 4}},{\rm{ 3}}.{\rm{67}} \times {\rm{1}}{{\rm{0}}^{ - 4}}\;{\rm{ and }}\;5.{\rm{50}} \times {\rm{1}}{{\rm{0}}^{ - 4}}$ for the curves with the maximum amplitude from small to large respectively. Dot-dash line shows the dependence of${i_{{\rm{dc}}}}$ where corresponding to the maximum oscillation amplitude on the power of the applied microwave.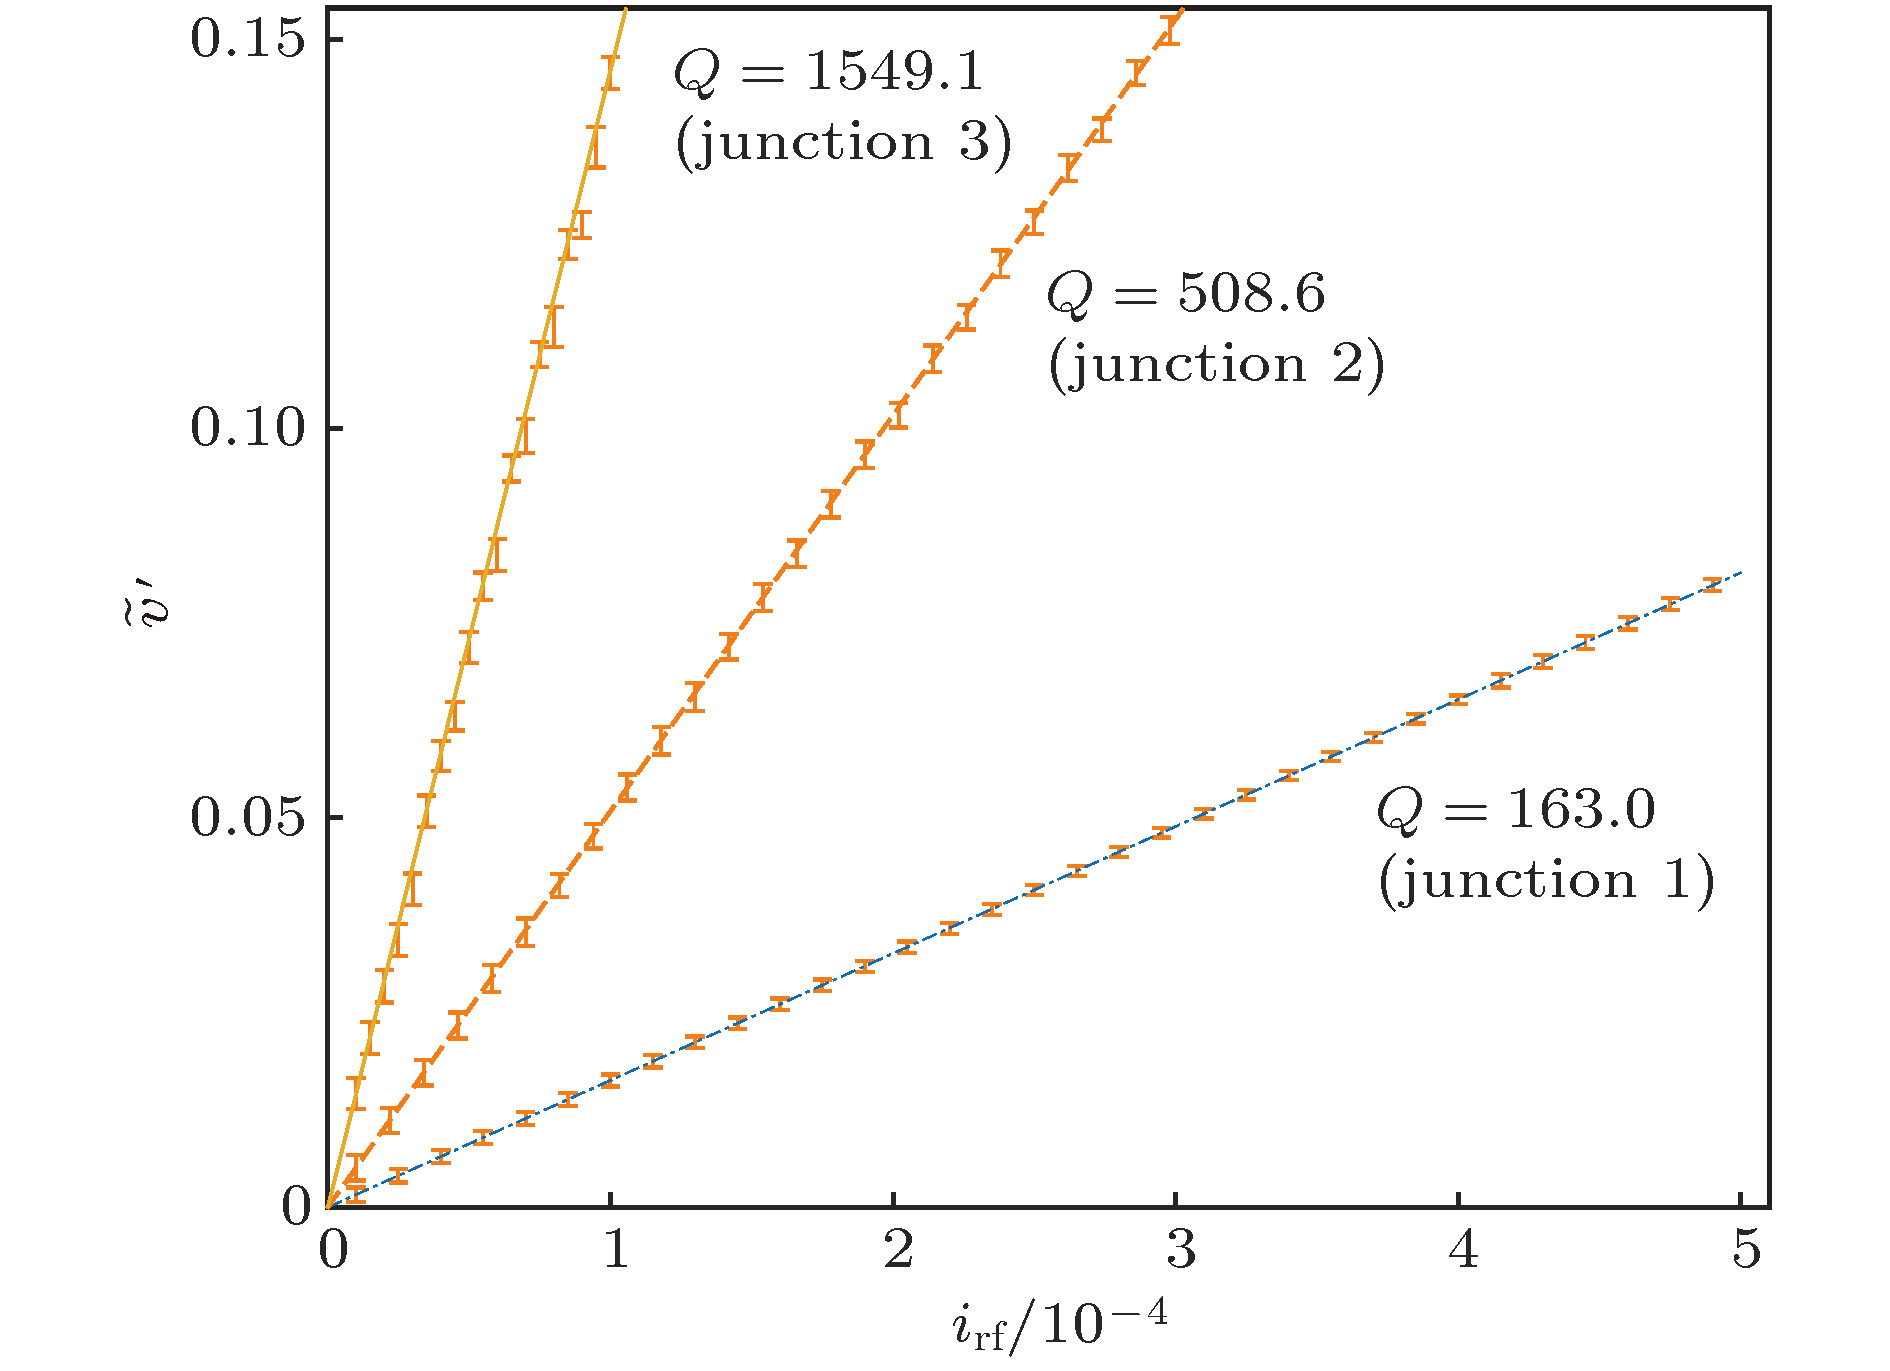
图 3 表1中三个样品结的
$ \tilde v = \sqrt {{{\Delta \omega }}/{k}} {\omega _{\rm{p}}}$ 随$ {i_{{\rm{rf}}}}$ 的变化关系图, 线是(7)式的结果, 误差棒是$\tilde v $ 的数值模拟结果, 图中直线斜率从小到大分别对应Q值163.0(结1), 508.6(结2), 1549.1(结3)Figure 3.
$\tilde v = \sqrt {{{\Delta \omega }}/{k}} {\omega _{\rm{p}}}$ as a function of${i_{{\rm{rf}}}}$ for different parameters of sample Josephson junctions in Table 1. Lines are results of Eq. (7). Error bars are numerical simulation results of$\tilde v$ . The lines of slops from small to large corresponding to Q values: 163.0 (junction 1), 508.6 (junction 2), 1549.1 (junction 3).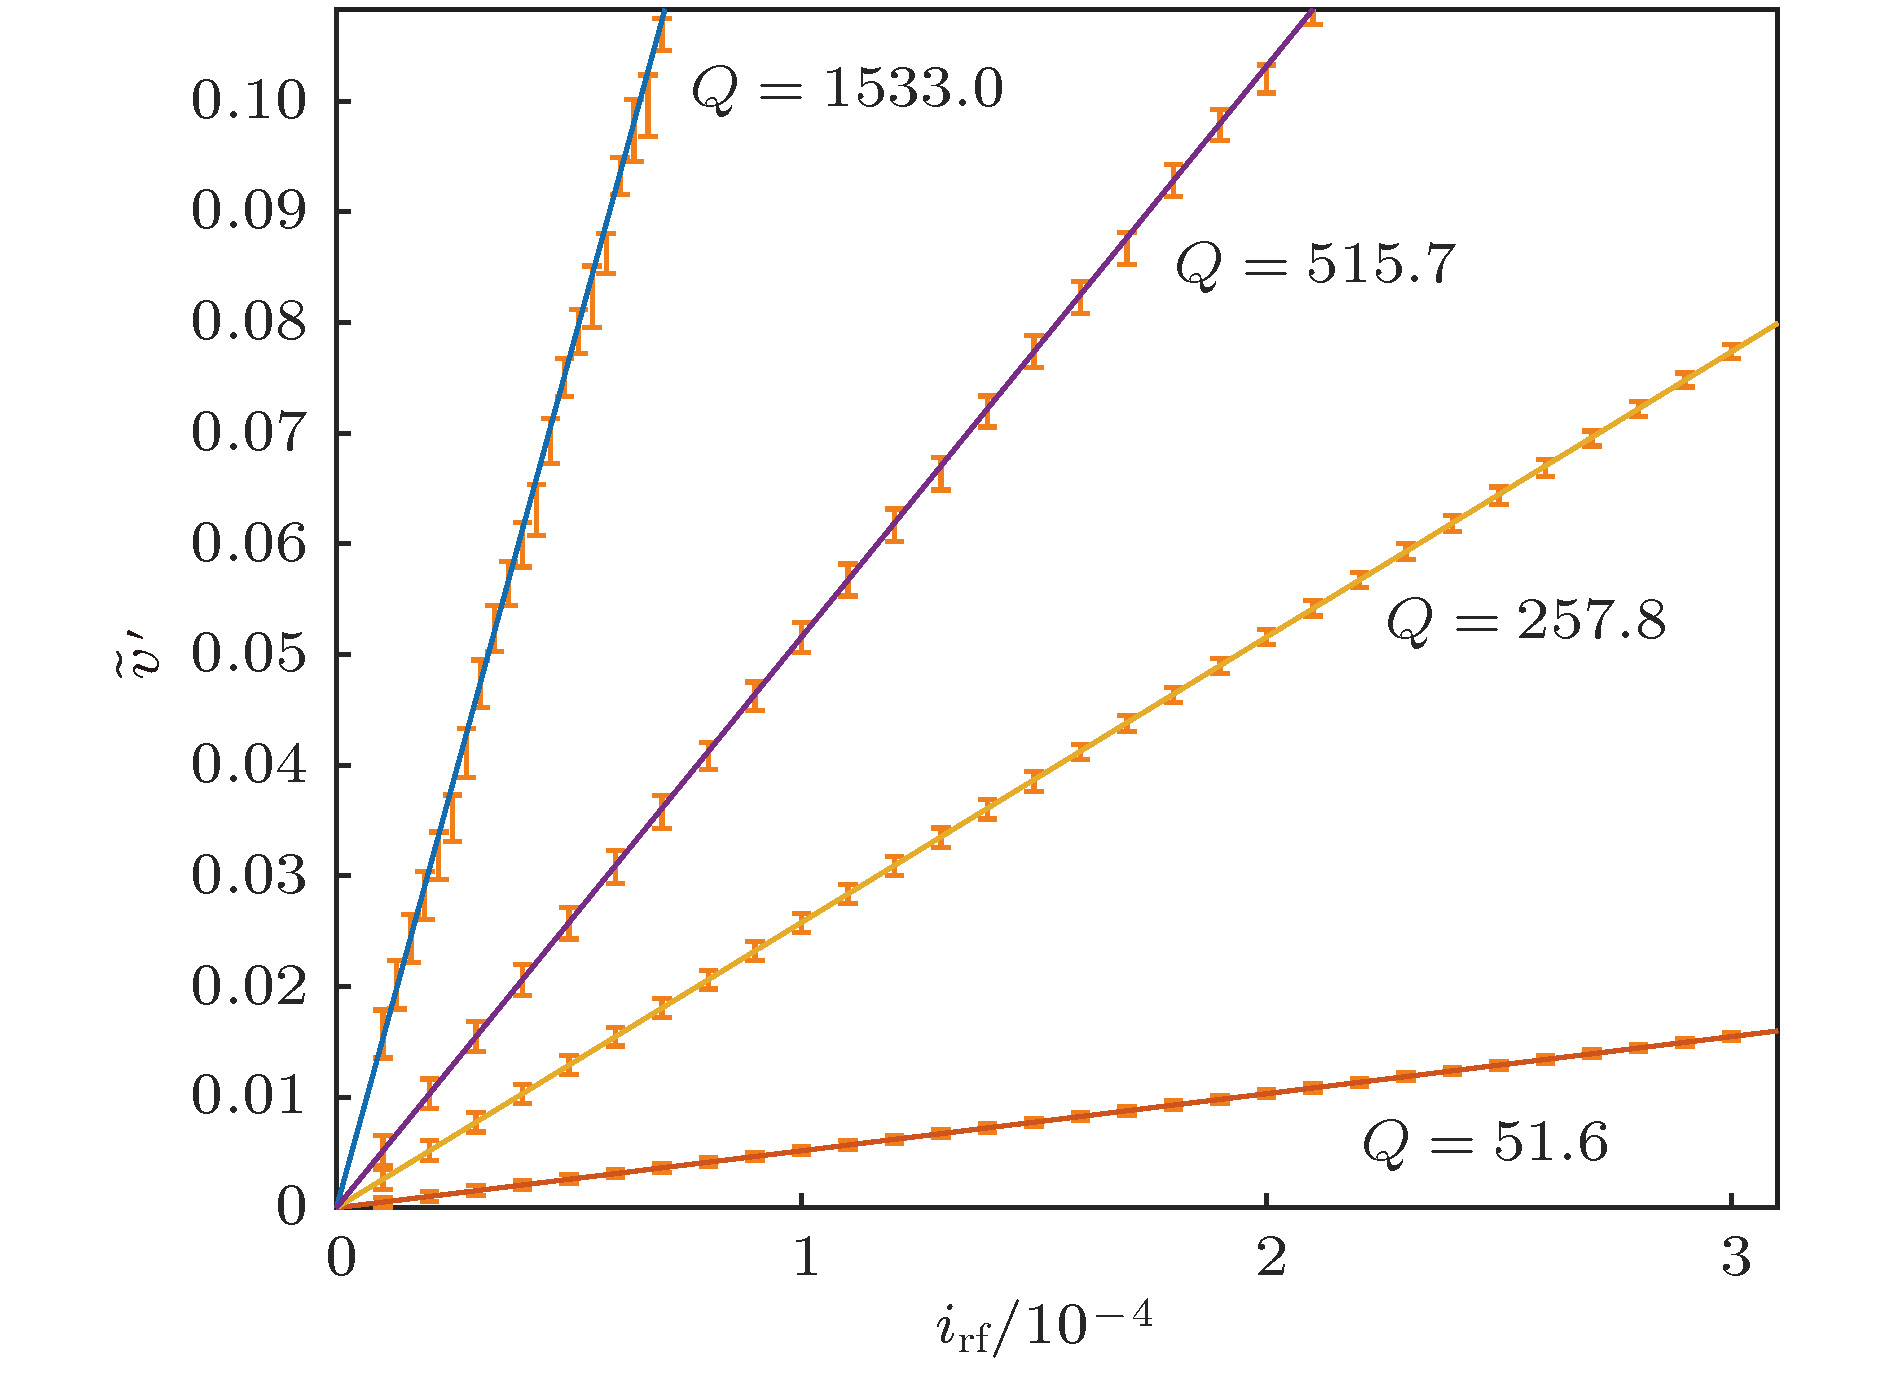
图 4 结2在不同的电路环境下, 导致不同的品质因子Q (51.6, 257.8, 515.7, 1533.0, 对应直线斜率从小到大)时,
$\tilde v$ 随${i_{{\rm{rf}}}}$ 的变化关系, 直线是(7)式的结果, 误差棒是$\tilde v$ 的数值模拟结果Figure 4.
$\tilde v$ as a function of${i_{{\rm{rf}}}}$ for different quality factors. Lines are Eq. (7)’s results. Error bars are numerical simulation results of$\tilde v$ . The lines of slops from small to large corresponding to Q values: 51.6, 257.8, 515.7, 1533.0 accounting for junction 2 with different environment influences.表 1 数值模拟采用的结参数
Table 1. Parameters of Josephson junctions used in numerical simulations.
结参数 结1 结2 结3 临界电流密度jc/A·cm–2 100 150 200 比电容Cs/fF·μm–2 42.9 46.4 50.5 品质因子Q 163.0 508.6 1459.1  DownLoad: CSV
表 2 数值模拟采用的实验参数
Table 2. Experiment settings used in numerical simulations.
实验参数 表示符号 取值 归一直流偏置 idc 0.46—0.52 归一微波电流 irf 1.6 × 10⁻⁴—5.5 × 10⁻⁴ 归一微波频率 γ 0.9306
DownLoad: CSV
-
[1] Devoret M H Schoelkopf R J 2013 Science 339 1169
Google Scholar
[2] van Theodore D, Charles W T 1998 Principles of Superconductive Devices and Circuits Second Edition (Upper Saddle River: Prentice Hall) p194
[3] Mattis D C, Bardeen J 1958 Phys. Rev. 111 412
Google Scholar
[4] Leggett A J, Chakravarty S, Dorsey A T, Fisher M P A, Garg A, Zwerger W 1987 Rev. Mod. Phys. 59 1
Google Scholar
[5] Makhlin Y, Schön G, Shnirman A 2001 Rev. Mod. Phys. 73 357
Google Scholar
[6] Martinis J M, Cooper K B, McDermott R, Steffen M, Ansmann M, Osborn K D, Cicak K, Oh S, Pappas D P, Simmonds R W, Yu C C 2005 Phys. Rev. Lett. 95 210503
Google Scholar
[7] Tinkham M 2004 Introduction to Superconductivity (2nd Ed.) (Dover) p76
[8] Pop I M, Geerlings K, Catelani G, Schoelkopf R J, Glazman L I, Devoret M H 2014 Nature 508 369
Google Scholar
[9] Yan F, Gustavsson S, Kamal A, Birenbaum J, Sears A P, Hover D, Gudmundsen T J, RosenBerg D, Samach G, Weber S, Yoder J L, Orlando T P, Clarke J, Kerman A J, Oliver W D 2016 Nat. Commun. 7 12964
Google Scholar
[10] Cosmelli C, Carelli P, Castellano M G, Chiarello F, Diambrini Palazzi G, Leoni R, Torrioli G 1999 Phys. Rev. Lett. 82 5357
Google Scholar
[11] Han S, Rouse R 2001 Phys. Rev. Lett. 86 4191
Google Scholar
[12] Dutta S K, Xu H, Berkley A J, Ramos R C, Gubrud M A, Anderson J R, Lobb C J, Wellstood F C 2004 Phys. Rev. B 70 140502
Google Scholar
[13] Han S, Yu Y, Chu X, Chu S, Wang Z 2001 Science 293 1457
Google Scholar
[14] McCumber D E 1968 J. Appl. Phys. 39 3113
Google Scholar
[15] Stewart W C 1968 Appl. Phys. Lett. 12 277
Google Scholar
[16] Landau L D, Lifshitz E M 2007 Mechanics Third Edition (Beijing: World Publishing Corporation) p88
[17] Li S X, Yu Y, Zhang Y, Qiu W, Han S, Wang Z 2002 Phys. Rev. Lett. 89 098301
Google Scholar
[18] Martinis J M, Nam S, Aumentado J 2002 Phys. Rev. Lett. 89 117901
Google Scholar
[19] Devoret M H, Esteve D, Martinis J M, Cleland A, Clarke J 1987 Phys. Rev. B 36 58
Google Scholar
[20] Manucharyan V E, Boaknin E, Metcalfe M, Vijay R, Siddiqi I, Devoret M 2007 Phys. Rev. B 76 014524
Google Scholar
[21] Mao B, Han S 2007 IEEE Trans. Appl. Supercond. 17 94
Google Scholar
[22] Sun G, Chen J, Ji Z, Xu W, Kang L, Wu P, Dong N, Mao G, Yu Y, Xing D 2006 App. Phys. Lett. 89 082516
Google Scholar


 DownLoad:


Catalog
Metrics
- Abstract views: 10634
- PDF Downloads: 94
- Cited By: 0
