


-
Precise measurement of blood flow is of vital importance in studying the formation of thrombus and atherosclerotic plaque. However, conventional color Doppler methods are limited to obtaining the velocity component along the ultrasound beam and have poor accuracy. Several Doppler flow imaging methods based on the plane wave emission can estimate the blood velocity vectors and visualize hemodynamic parameters, which provide more detailed blood flow information and effectively improve the capability of clinical diagnosis treatment. Considering the low accuracy of the Doppler flow methods for measuring velocity in complex flow fields, an optimization technique is used to improve the imaging quality and the accuracy of velocity estimation. In this study we propose a modified vector Doppler method through combining multi-angle compound technique, to reconstruct blood velocity vectors of carotid bifurcations obtained from 3D printing. Since the multi-angle compound technology can effectively improve the quality of imaging, this technology is applied to Doppler imaging to achieve high-accuracy velocity estimation. It can significantly reduce the velocity estimation errors. Comparing the velocity estimation accuracy of different angle compound numbers (n = 1, 3, 5, and 7) in the simulation, it is found that the accuracy of velocity estimation increases with angle compound increasing. Beside, the 5-angle compound method is more robust for velocity estimation and can obtain higher frames. The experiments were carried out using a programmable ultrasonic array system and a high-frequency linear array transducer L12-5c with a central frequency of 8.125 MHz. The sample rate is set to be 31.25 MHz. The imaging results of carotid bifurcation also show that the vector Doppler based on 5-angle compound can obtain a clear image of intravascular vector flow, which is beneficial to the identifying of complex flow state, and realize intravascular dynamic imaging. Especially, it can capture the vortex phenomenon in the blood stream. The quantitative results indicate that this method significantly reduces the error between the flow calculation results and the reference results, making the estimation results more accurate. In conclusion, the vector Doppler method based on multi-angle compound has the good performance of visualizing complex blood flow and calculating hemodynamic parameters. It also provides the reference for the diagnosis of cardiovascular disease and the research of flow imaging methods.
-
Keywords:
- multi-angle compound /
- ultrasonic Doppler /
- carotid bifurcation /
- vector flow imaging
[1] Stein J H, Korcarz C E, Hurst R T, Lonn E, Kendall C B, Mohler E R, Najjar S S, Rembold C M and Post W S 2008 J. Am. Soc. Echocardiogr. 21 93
 Google Scholar
[2] Kornblum H I, Araujo D M, Annala A J, Tatsukawa K J, Phelps M E, Cherry S R 2000 Nat. Biotechnol. 18 655
Google Scholar
[3] Ogawa S, Lee T M, Kay A R, Tank D W 1990 Proc. Natl. Acad. Sci. U. S. A. 87 9868
Google Scholar
[4] Denarie B, Tangen T A, Ekroll I K, Rolim N, Torp H, Bjastad T, Lovstakken L 2013 IEEE Trans. Med. Imaging 32 1265
Google Scholar
[5] Cloutier G, Zhao Q, Durand L G, Teh B G 1996 IEEE Trans. Biomed. Eng. 43 441
Google Scholar
[6] Tanter M, Bercoff J, Sandrin L, Fink M 2002 IEEE Trans. Ultrason. Ferroelectr. Freq. Control 49 1363
Google Scholar
[7] Mace E, Montaldo G, Cohen I, Baulac M, Fink M, Tanter M 2011 Nat. Methods 8 662
Google Scholar
[8] 臧佳琦, 许凯亮, 韩清见, 陆起涌, 梅永丰, 他得安 2020 物理学报 70 114303
Google Scholar
Zang J Q, Xu K L, Han Q J, Lu Q Y, Mei Y F, Ta D A 2020 Acta. Phys. Sin 70 114303
Google Scholar
[9] Fredriksen T D, Avdal J, Ekroll IK, Dahl T, Løvstakken L, Torp H 2014 IEEE Trans. Ultrason. Ferroelect. Freq. Control 61 1161
Google Scholar
[10] Tortoli P, Dallai A, Boni E, Francalanci L, Ricci S 2010 Ultrasound Med. Biol. 36 488
Google Scholar
[11] Jensen J, Hoyos C A V, Stuart M B, Ewertsen C, Nielsen M B, Jensen J A 2017 IEEE Trans. Ultrason. Ferroelect. Freq. Control 64 1050
Google Scholar
[12] Behar V, Adanm D, Friedman Z 2003 Ultrasonics 41 377
Google Scholar
[13] Lovstakken L, Torp H 2010 IEEE International Ultrasonics Symposium San Diego, CA, USA, Oct 11–14, 2010 p1198
[14] Wan M X, Gong X Z, Qian M 1999 IEEE Trans. Biomed. Eng. 46 1074
Google Scholar
[15] Steel R, Fish P J 2002 IEEE Trans. Ultrason. Ferroelect. Freq. Control 49 1375
Google Scholar
[16] Girault J M, Kouame D, Ouahabi A 2000 Ultrasonics 38 682
Google Scholar
[17] Peronneau P, Bournat J P, Bugnon A, Barbet A, Xhaard M 1974 Cardiovascular Applications of Ultrasound Netherlands, North Holland, 1974 p66
[18] Tortoli P, Bambi G, Ricci S 2006 IEEE Trans. Ultrason. Ferroelect. Freq. Control 53 1425
Google Scholar
[19] Dunmire B, Beach K W, Labs K H, Plett M, Strandness D E 2000 Ultrasound Med. Biol. 26 1213
Google Scholar
[20] Phillips P J, Kadi A P, Von Ramm O T 1995 Ultrasound Med. Biol. 21 217
Google Scholar
[21] Scabia M, Calzolai M, Capineri L, Masotti L, Fort A 2000 Ultrasound Med. Biol. 26 121
Google Scholar
[22] Tsang I K H, Yiu B Y S, Yu A C H 2009 IEEE International Ultrasonics Symposium Rome, Italy, Sept 20–23, 2009 p1387
[23] Ricci S, Ramalli A, Bassi L, Boni E, Tortoli P 2017 IEEE Trans. Ultrason. Ferroelect. Freq. Control 65 201
Google Scholar
[24] Bjaerum S, Torp H, and Kristoffersen K, 2002 IEEE Trans. Ultrason. Ferroelect. Freq. Control 49 204
Google Scholar
[25] Revellin R, Rousset F, Baud D, Bonjour J 2009 Theor. Biol. Med. Modell. 6 1
Google Scholar
-

图 1 方法流程图
Figure 1. Flow chart of the proposed method.
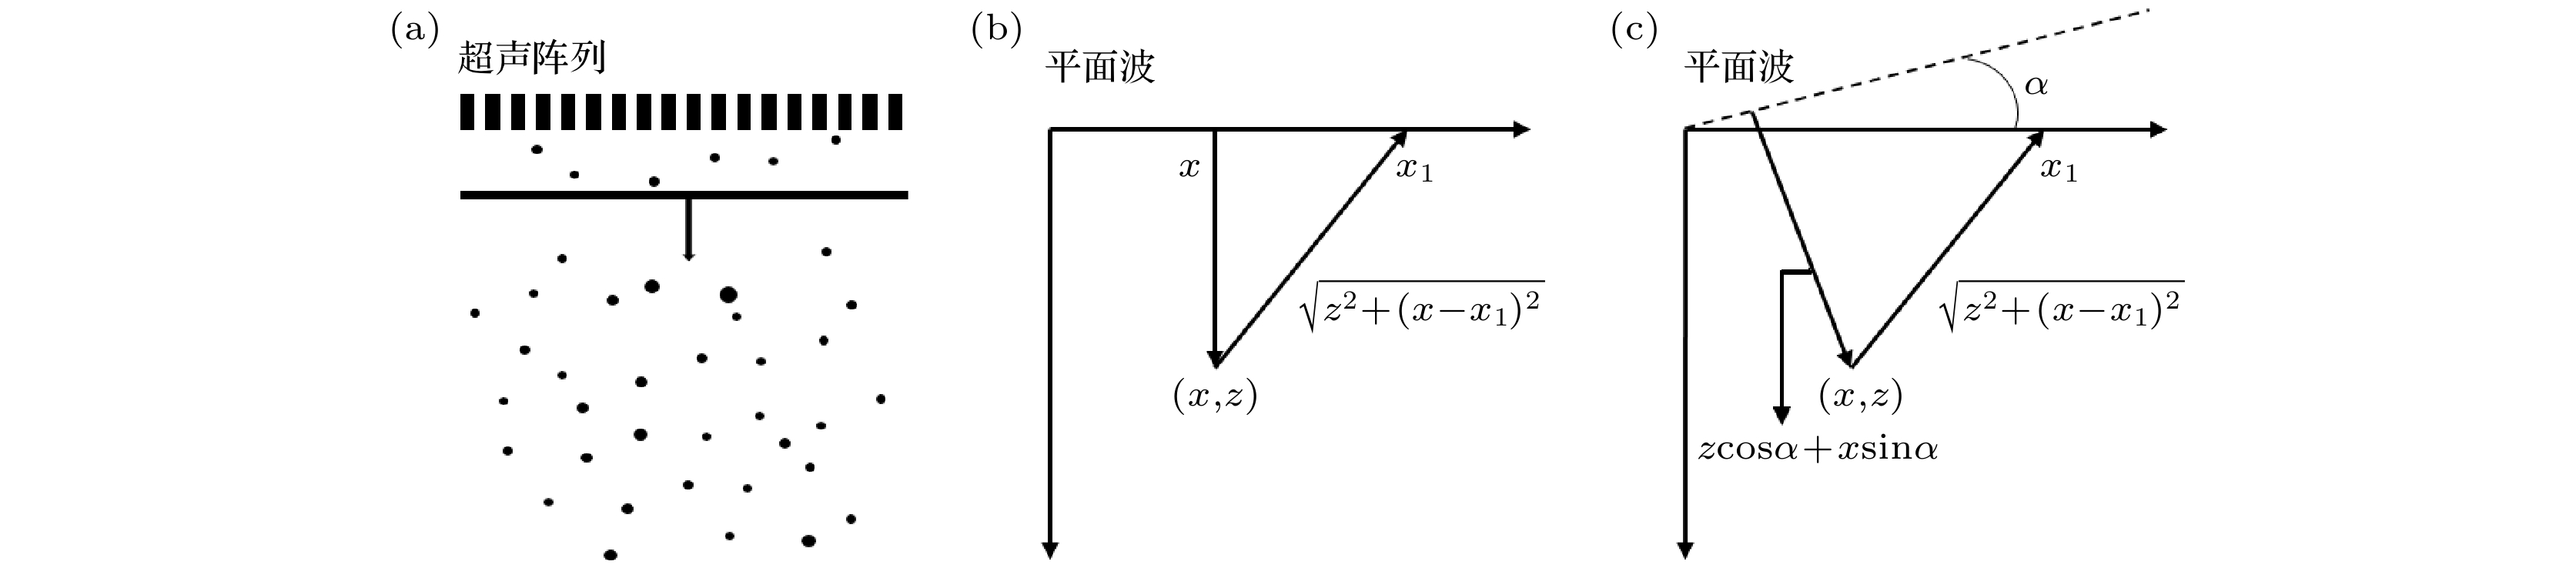
图 2 (a)平面波传输示意图; (b)无偏转角的平面波传输路径; (c)偏转角为
$ \alpha $ 时声波传输的路径Figure 2. (a) Plane wave transmission; (b) time delays for a plane wave emission and reception; (c) time delays for a plane wave of the angle
$ \alpha $ .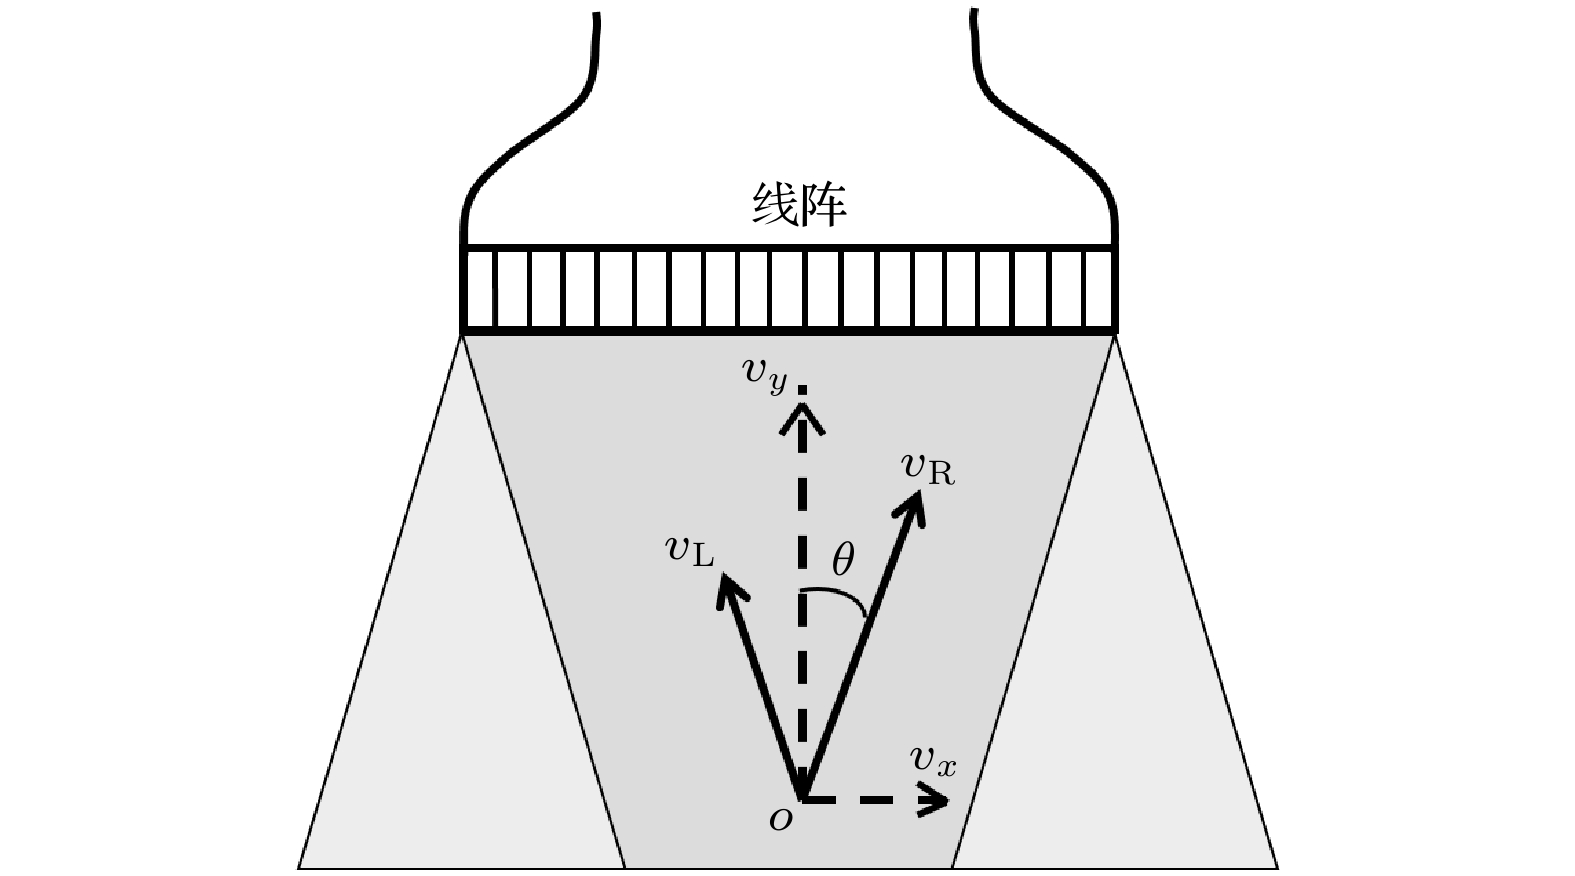
图 3 交叉波速示意图.
Figure 3. Schematic diagram of crossed-beam vector Doppler.
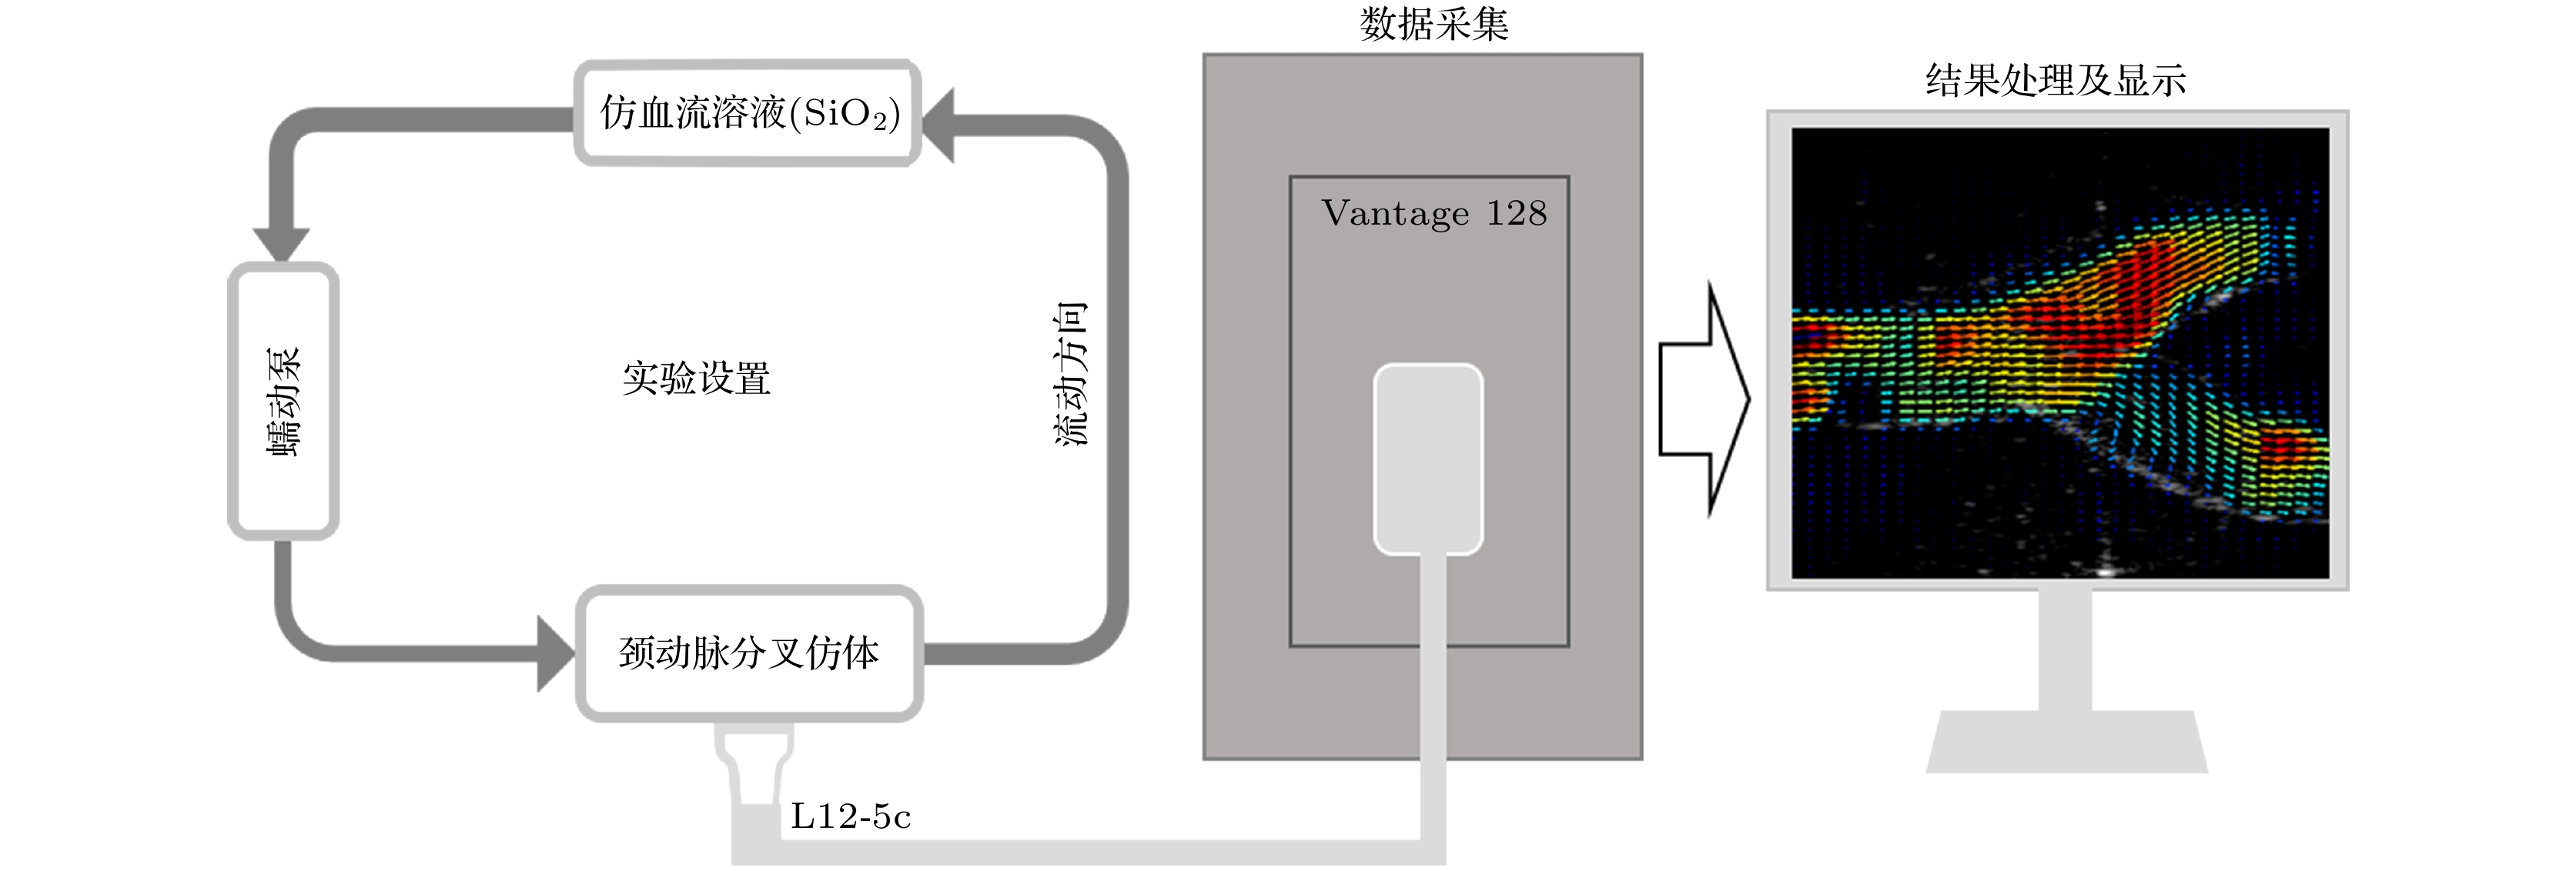
图 4 实验系统原理图
Figure 4. Schematic diagram of the experimental system.

图 5 颈动脉分叉实验装置图
Figure 5. Experimental setup of carotid bifurcation.
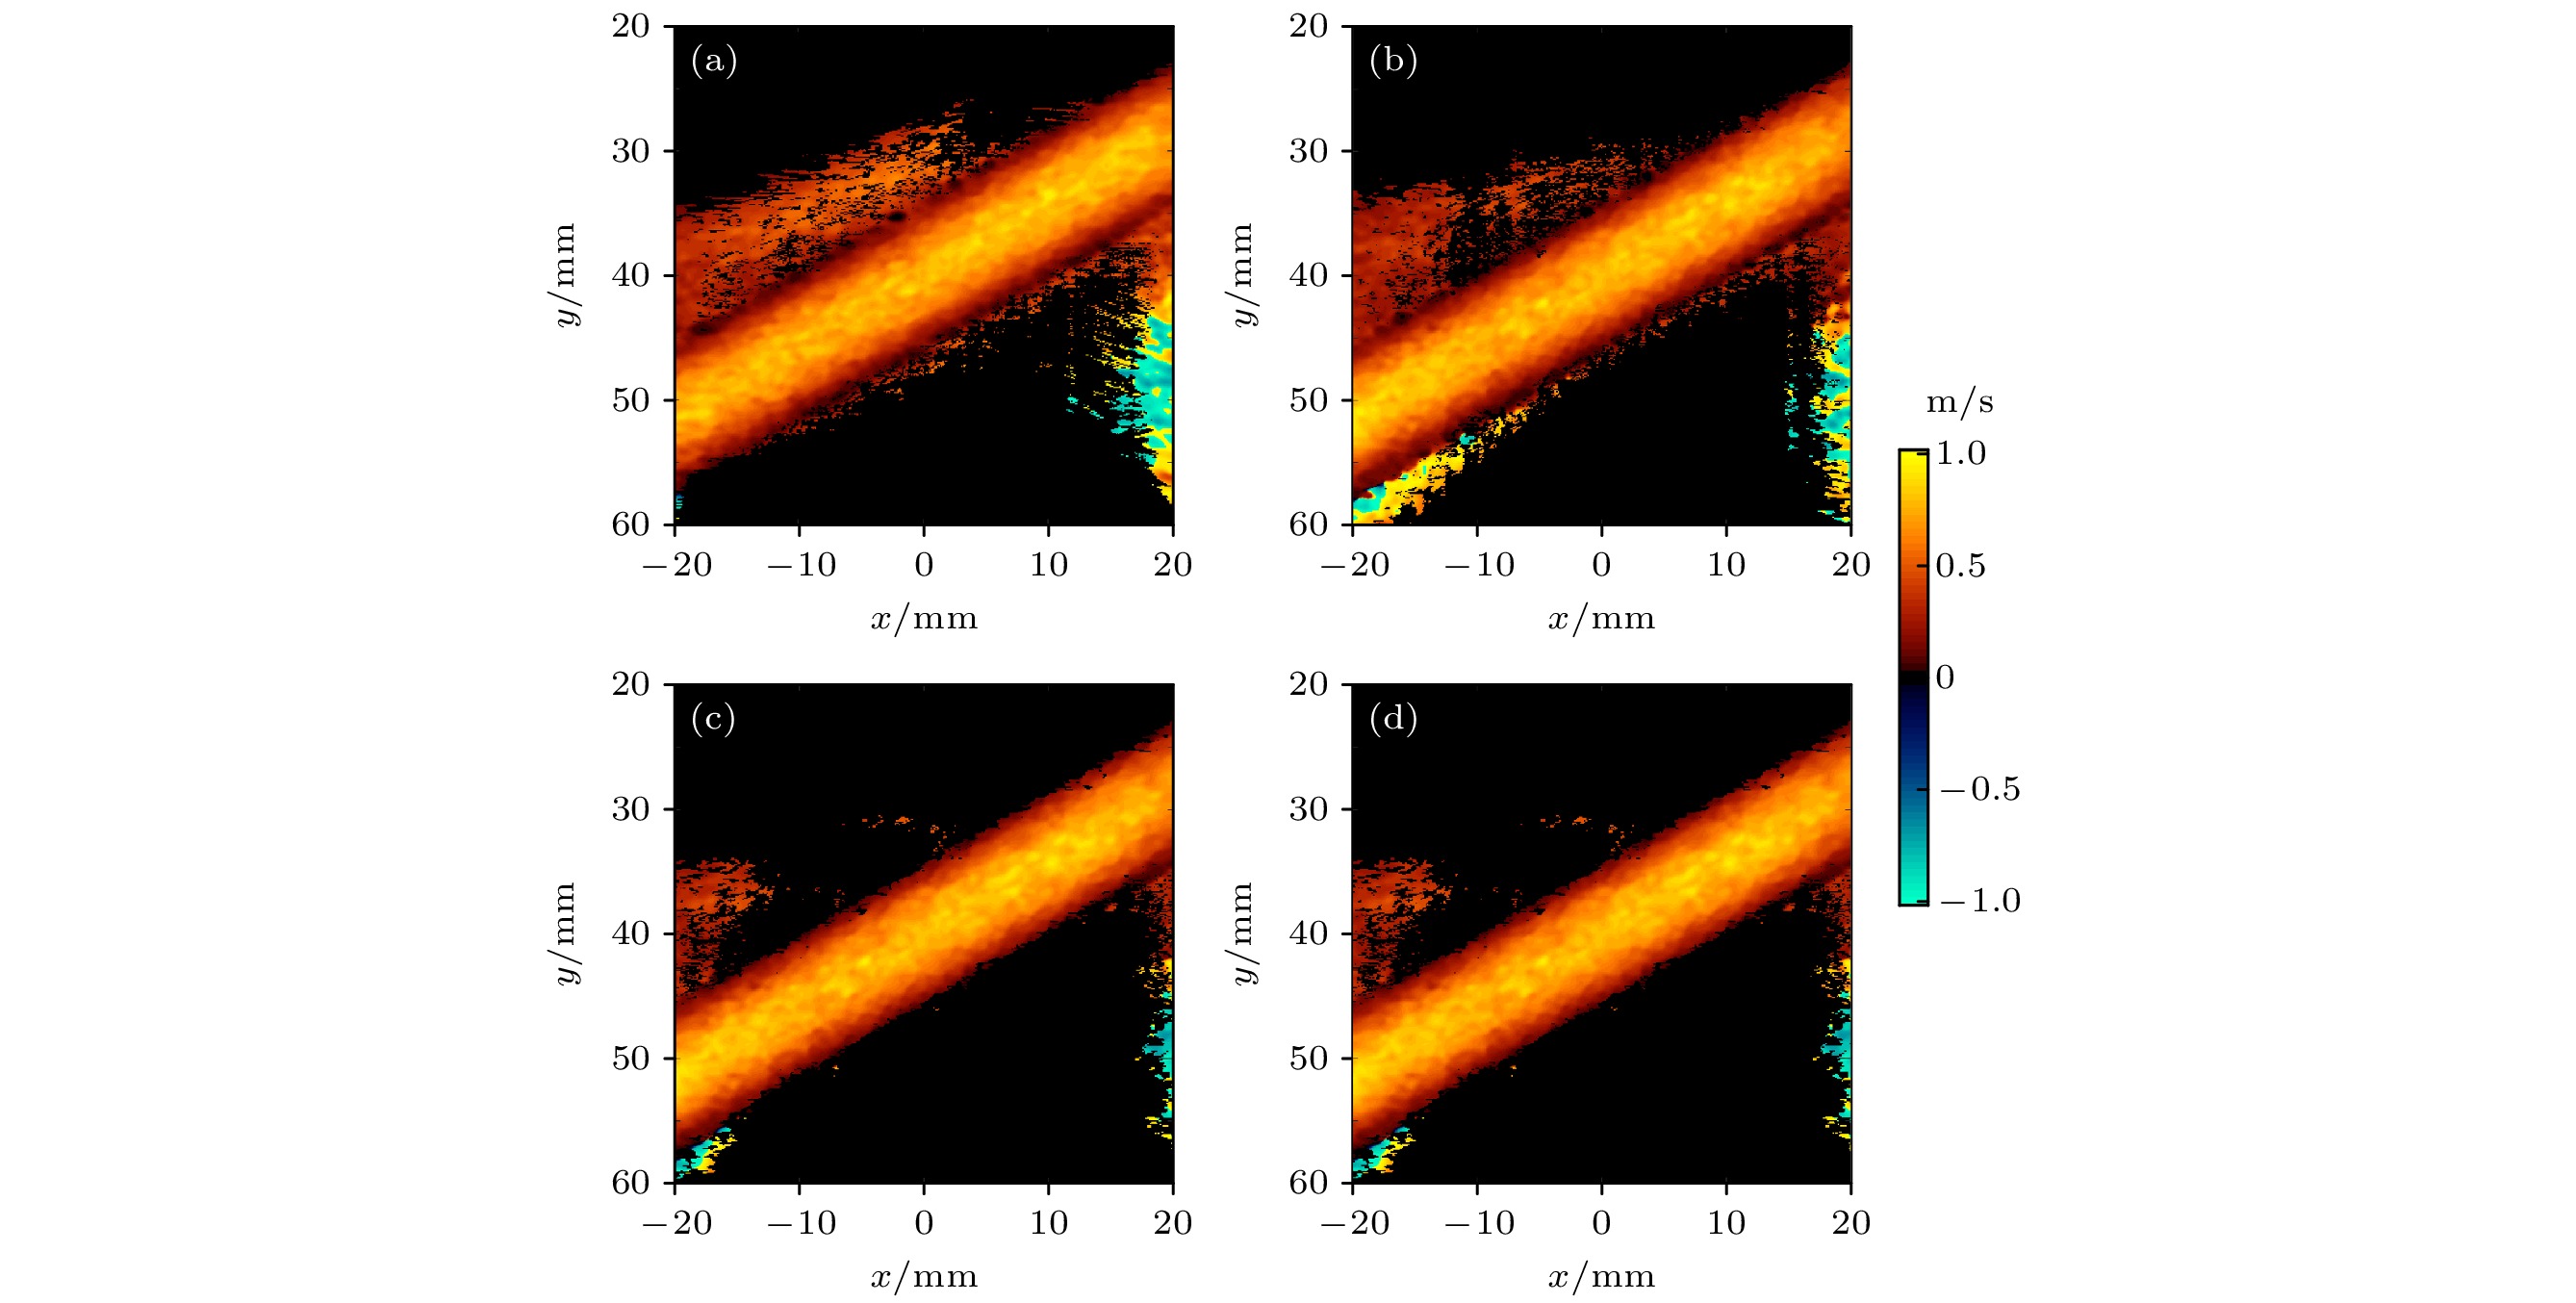
图 6 多角度复合多普勒成像结果 (a) 单角度复合; (b) 3个角度复合; (c) 5个角度复合; (d) 7个角度复合
Figure 6. Multi-angle compound Doppler imaging results: (a) Single angle compound; (b) 3 angles compound; (c) 5 angles compound; (d) 7 angles compound.
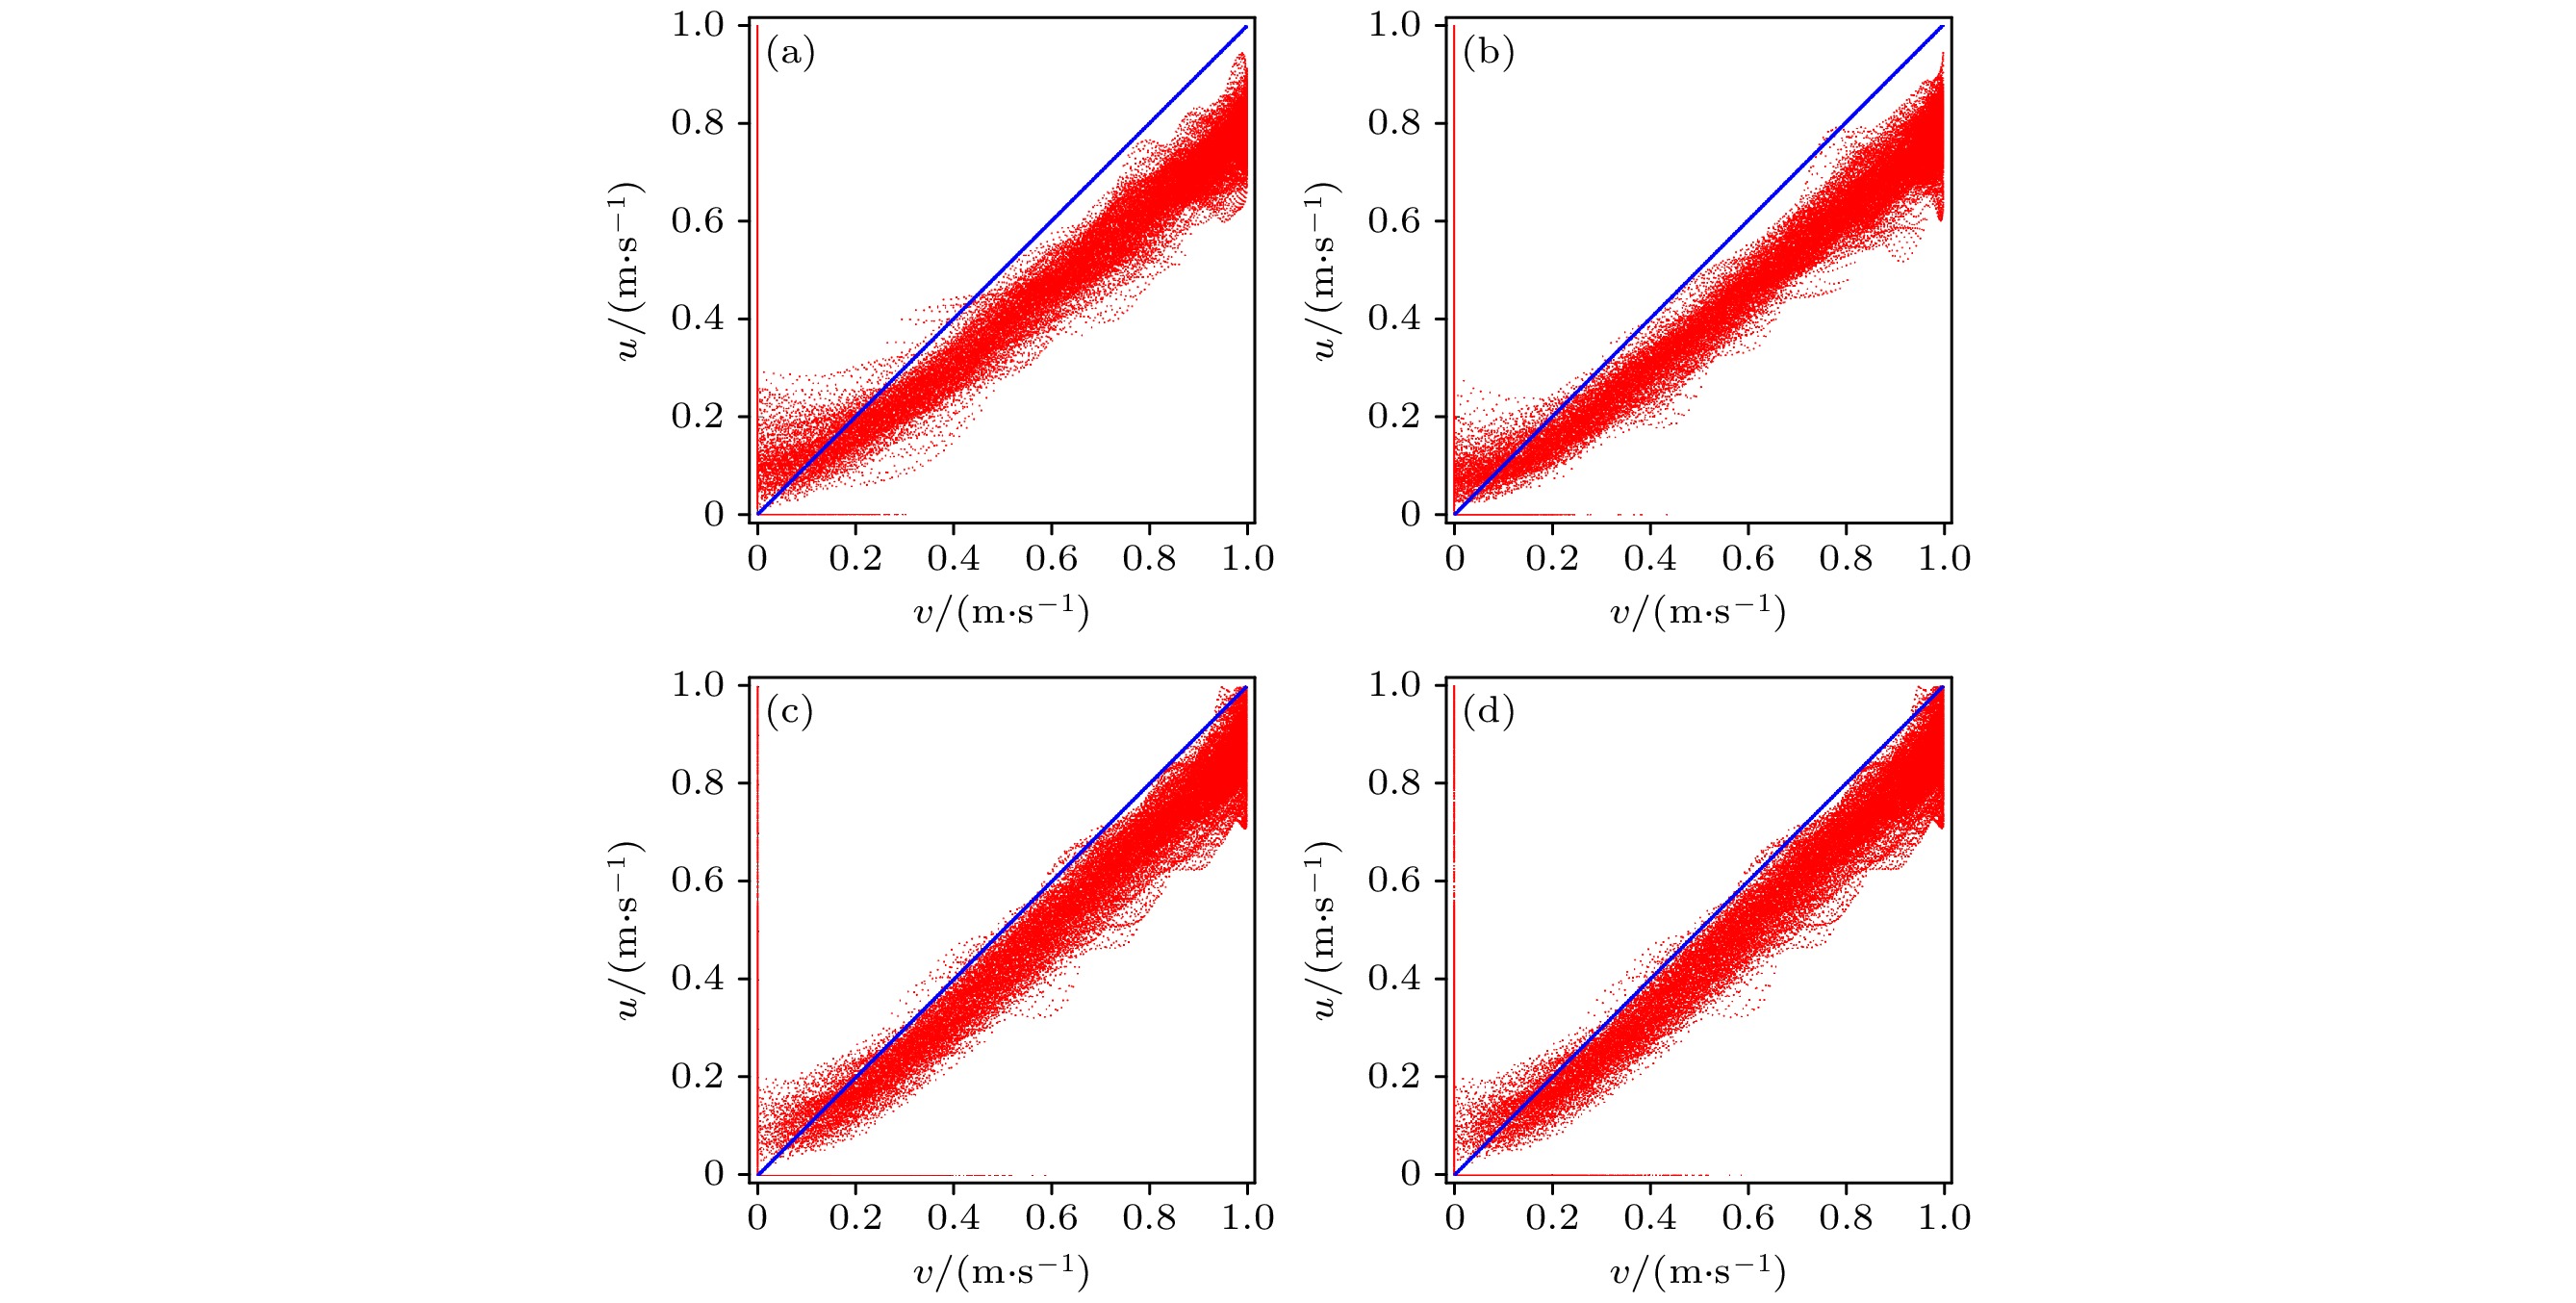
图 7 多角度复合多普勒估算速度与标准参考值的散点分布图 (a)单角度; (b) 3个角度复合; (c) 5个角度复合; (d) 7个角度复合
Figure 7. Scatter plots showing the relation between reference and estimated velocities: (a) Single angle; (b) 3 angles compound; (c) 5 angles compound; (d) 7 angles compound.
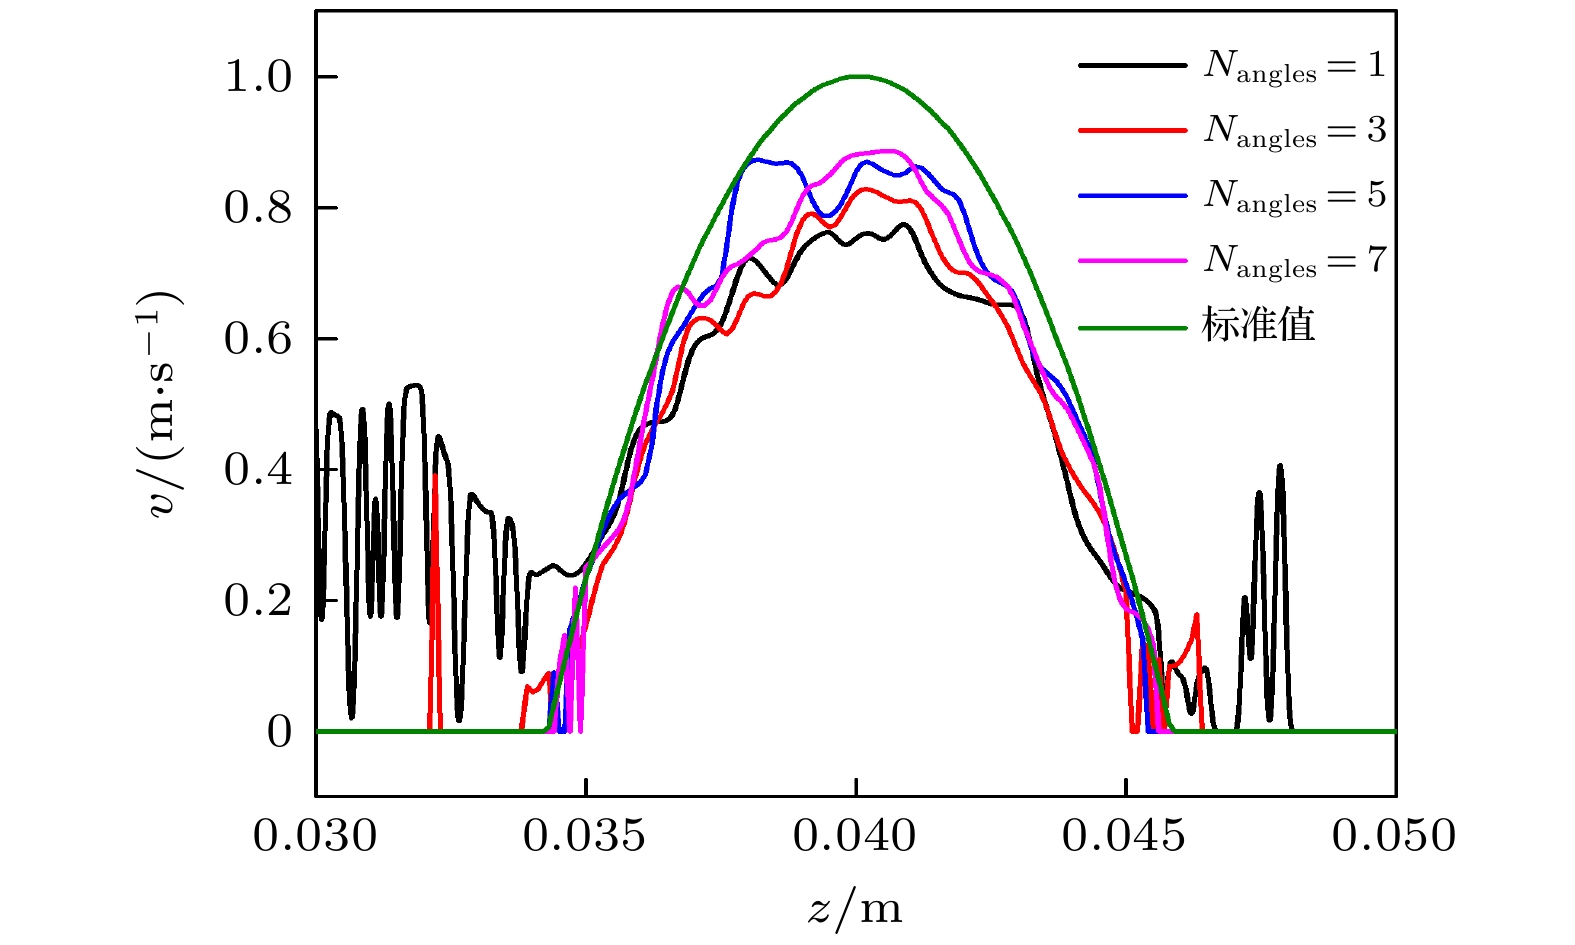
图 8 血管沿深度方向的速度分布曲线.
Figure 8. Velocity distribution along the depth direction of the blood vessel.

图 9 单角度平面波发射的颈动脉分叉血流成像结果 (a)偏转接收角度为12°时三种流量入口条件的彩色多普勒图像; (b)偏转接收角度为–12°的彩色多普勒图像; (c)矢量合成得到的速度矢量图像; (d)分叉处放大图
Figure 9. Blood flow imaging of carotid bifurcation by single angle plane wave composite imaging: (a) Color Doppler imaging of three flow inlet conditions at 12° deflection receiving angle; (b) color Doppler imaging with a deflected reception angle of –12°; (c) the dual-mode imaging of velocity vector and B mode; (d) Enlarged view of partial bifurcation.
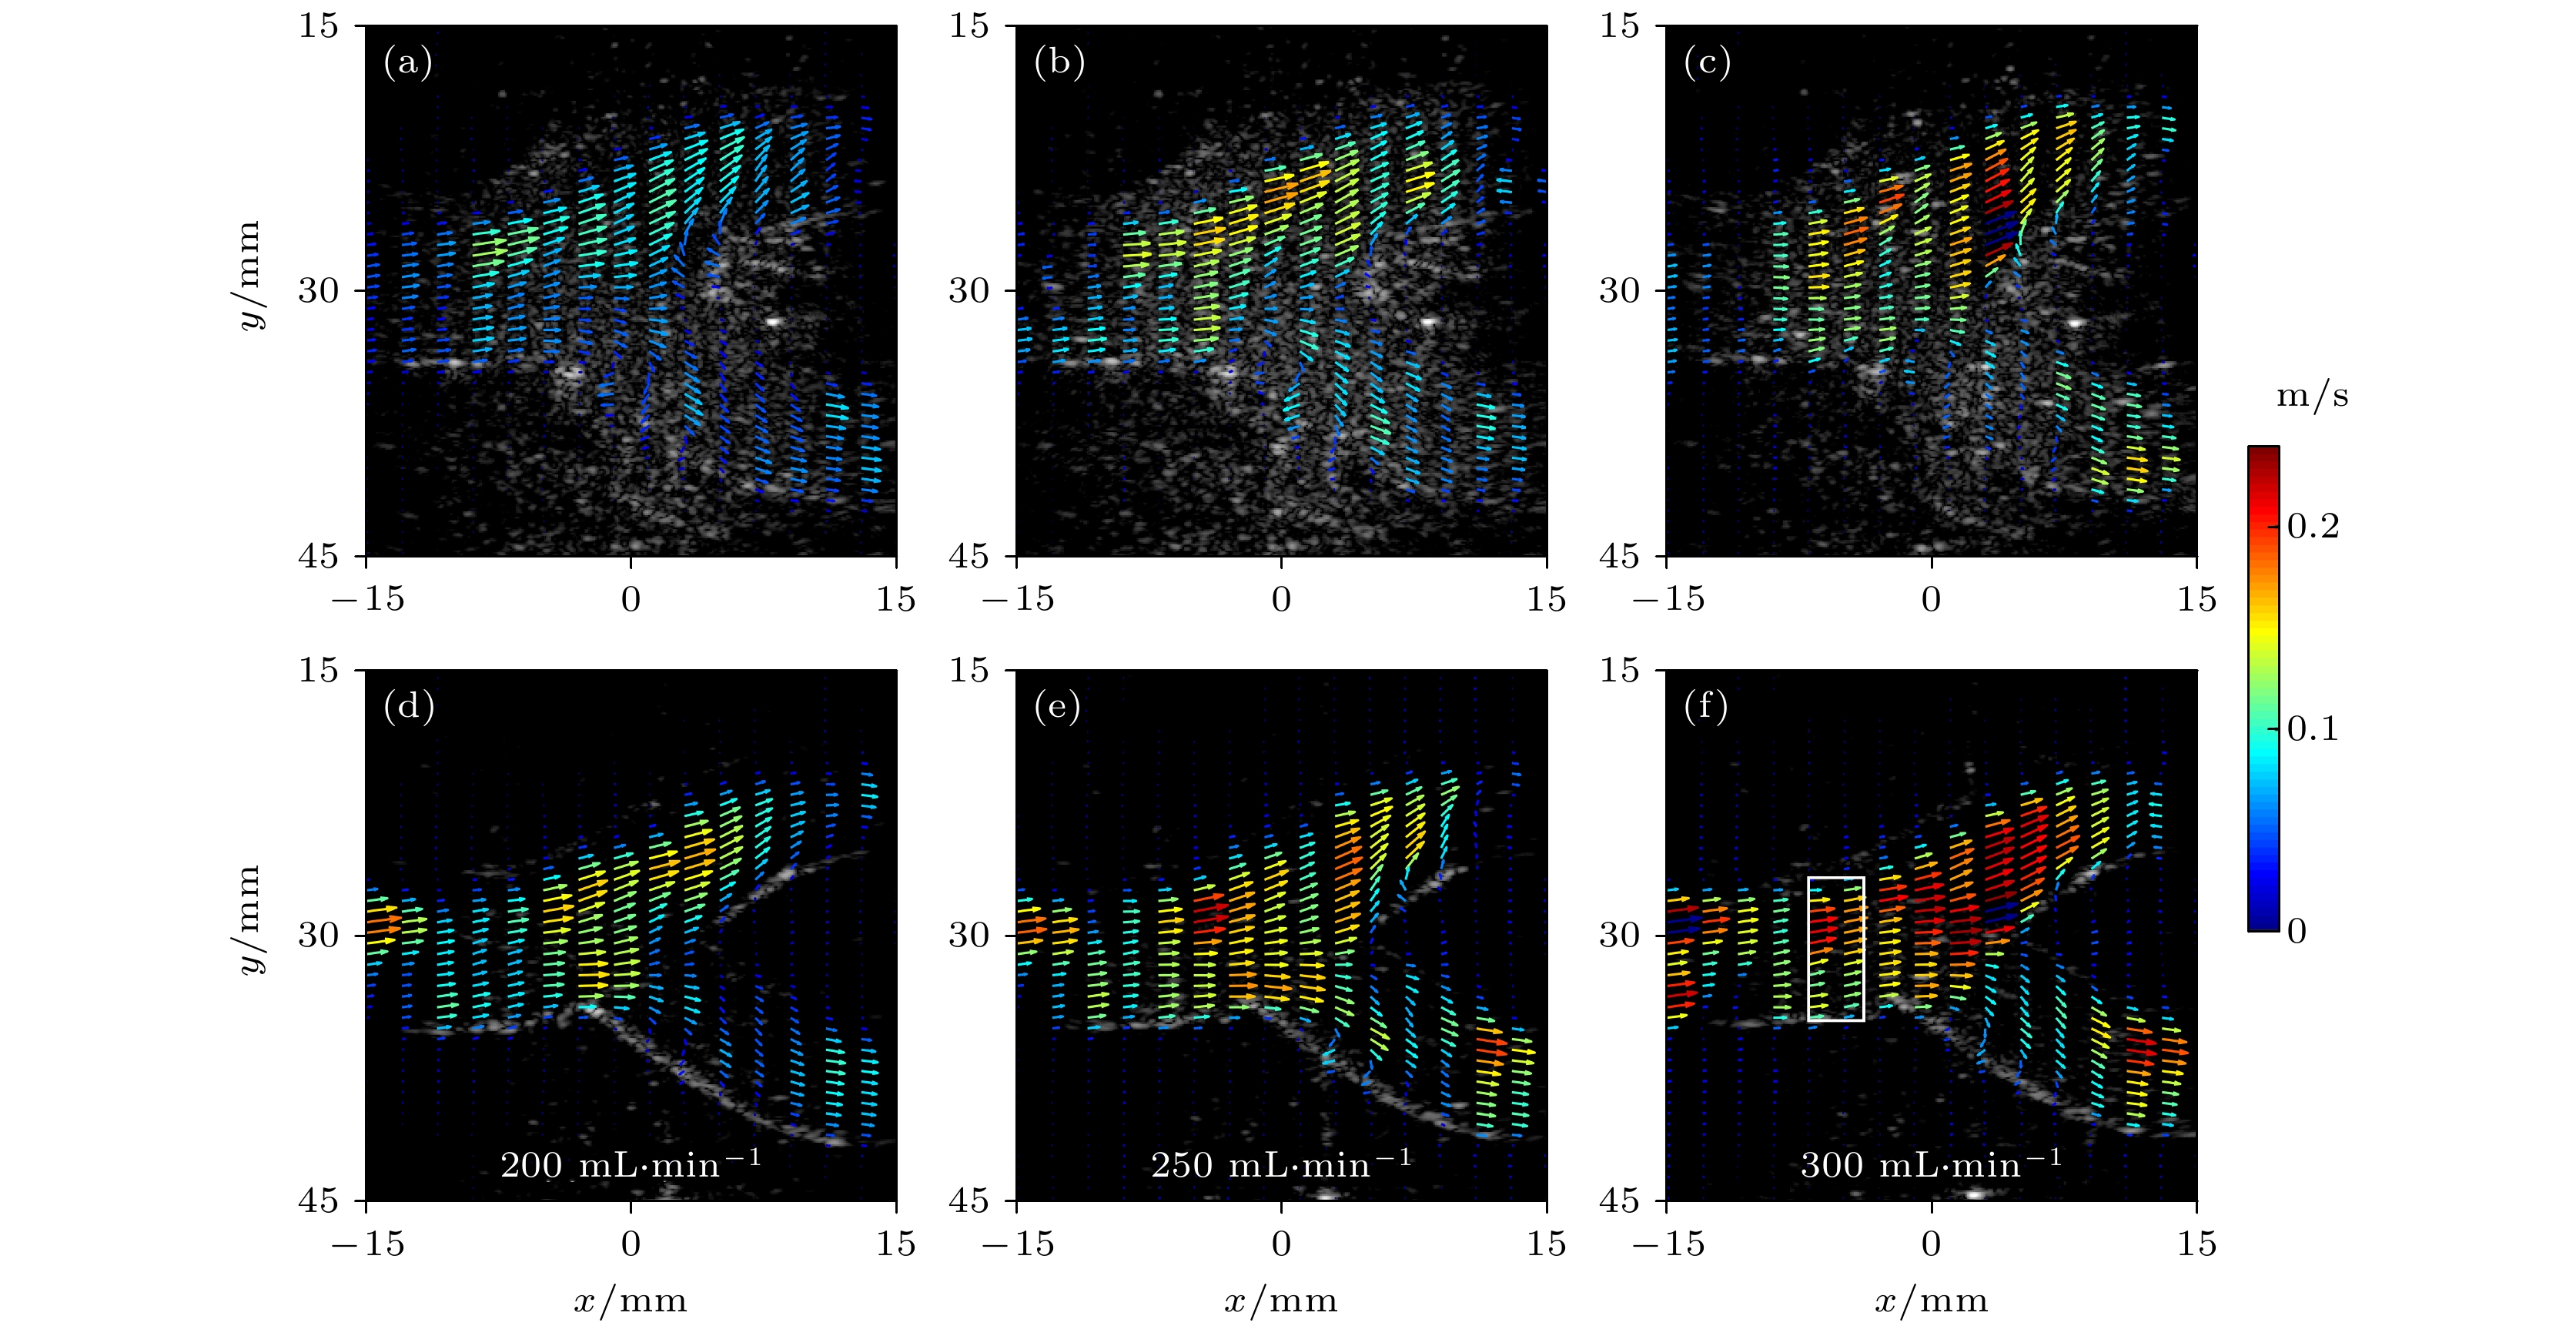
图 10 单角度平面波成像和5个角度复合的颈动脉分叉成像结果对比 (a), (b)和(c)分别为单角度平面波发射情况下流量为200, 250和300 mL/min的血流矢量成像结果; (e), (f)和(d)为5个角度复合的成像结果. 白色线框表示用于估算平均速度的区域
Figure 10. Blood flow imaging of carotid bifurcation by single plane wave and 5-angle plane wave compound: (a), (b), (c) The imaging results of 200, 250 and 300 mL/min under the condition of single plane wave emission; (e), (f), (d) the imaging results of 5-angle composite. The white box represents the area used to estimate the average speed.
表 1 声场仿真的参数设置
Table 1. Simulation parameters setting.
参数 值 发射阵元数 128 接收阵元数 128 中心频率/MHz 5 阵元宽度/mm 0.208 阵元高度/mm 4.5 阵元间距/mm 0.35 声速/(m·s–1) 1540 幅度变迹 Hanning 激励脉冲 4-period sinusoid 最大脉冲重复频率/kHz 15 角度复合数 3, 5, 7 采样频率/MHz 100 直径/mm 10 峰值速度/(m·s–1) 1  DownLoad: CSV
表 2 多普勒速度估算的标准偏差
Table 2. Standard deviation of Doppler velocity estimation.
$ {N}_{\mathrm{a}\mathrm{n}\mathrm{g}\mathrm{l}\mathrm{e}\mathrm{s}} $ 1 3 5 7 归一化标准差 0.164 0.073 0.067 0.0659
DownLoad: CSV
表 3 矢量多普勒方法计算流量与设定值的误差
Table 3. The error between the estimated flow rate and the reference value.
$ {V}_{\mathrm{v}\mathrm{o}\mathrm{l}\mathrm{u}\mathrm{m}\mathrm{e}} $/(mL·min–1) 200 250 300 Error($ {N}_{\mathrm{a}\mathrm{n}\mathrm{g}\mathrm{l}\mathrm{e}\mathrm{s}} $ = 1) 0.125 0.208 0.107 Error($ {N}_{\mathrm{a}\mathrm{n}\mathrm{g}\mathrm{l}\mathrm{e}\mathrm{s}} $ = 5) 0.120 0.080 0.053
DownLoad: CSV
-
[1] Stein J H, Korcarz C E, Hurst R T, Lonn E, Kendall C B, Mohler E R, Najjar S S, Rembold C M and Post W S 2008 J. Am. Soc. Echocardiogr. 21 93
Google Scholar
[2] Kornblum H I, Araujo D M, Annala A J, Tatsukawa K J, Phelps M E, Cherry S R 2000 Nat. Biotechnol. 18 655
Google Scholar
[3] Ogawa S, Lee T M, Kay A R, Tank D W 1990 Proc. Natl. Acad. Sci. U. S. A. 87 9868
Google Scholar
[4] Denarie B, Tangen T A, Ekroll I K, Rolim N, Torp H, Bjastad T, Lovstakken L 2013 IEEE Trans. Med. Imaging 32 1265
Google Scholar
[5] Cloutier G, Zhao Q, Durand L G, Teh B G 1996 IEEE Trans. Biomed. Eng. 43 441
Google Scholar
[6] Tanter M, Bercoff J, Sandrin L, Fink M 2002 IEEE Trans. Ultrason. Ferroelectr. Freq. Control 49 1363
Google Scholar
[7] Mace E, Montaldo G, Cohen I, Baulac M, Fink M, Tanter M 2011 Nat. Methods 8 662
Google Scholar
[8] 臧佳琦, 许凯亮, 韩清见, 陆起涌, 梅永丰, 他得安 2020 物理学报 70 114303
Google Scholar
Zang J Q, Xu K L, Han Q J, Lu Q Y, Mei Y F, Ta D A 2020 Acta. Phys. Sin 70 114303
Google Scholar
[9] Fredriksen T D, Avdal J, Ekroll IK, Dahl T, Løvstakken L, Torp H 2014 IEEE Trans. Ultrason. Ferroelect. Freq. Control 61 1161
Google Scholar
[10] Tortoli P, Dallai A, Boni E, Francalanci L, Ricci S 2010 Ultrasound Med. Biol. 36 488
Google Scholar
[11] Jensen J, Hoyos C A V, Stuart M B, Ewertsen C, Nielsen M B, Jensen J A 2017 IEEE Trans. Ultrason. Ferroelect. Freq. Control 64 1050
Google Scholar
[12] Behar V, Adanm D, Friedman Z 2003 Ultrasonics 41 377
Google Scholar
[13] Lovstakken L, Torp H 2010 IEEE International Ultrasonics Symposium San Diego, CA, USA, Oct 11–14, 2010 p1198
[14] Wan M X, Gong X Z, Qian M 1999 IEEE Trans. Biomed. Eng. 46 1074
Google Scholar
[15] Steel R, Fish P J 2002 IEEE Trans. Ultrason. Ferroelect. Freq. Control 49 1375
Google Scholar
[16] Girault J M, Kouame D, Ouahabi A 2000 Ultrasonics 38 682
Google Scholar
[17] Peronneau P, Bournat J P, Bugnon A, Barbet A, Xhaard M 1974 Cardiovascular Applications of Ultrasound Netherlands, North Holland, 1974 p66
[18] Tortoli P, Bambi G, Ricci S 2006 IEEE Trans. Ultrason. Ferroelect. Freq. Control 53 1425
Google Scholar
[19] Dunmire B, Beach K W, Labs K H, Plett M, Strandness D E 2000 Ultrasound Med. Biol. 26 1213
Google Scholar
[20] Phillips P J, Kadi A P, Von Ramm O T 1995 Ultrasound Med. Biol. 21 217
Google Scholar
[21] Scabia M, Calzolai M, Capineri L, Masotti L, Fort A 2000 Ultrasound Med. Biol. 26 121
Google Scholar
[22] Tsang I K H, Yiu B Y S, Yu A C H 2009 IEEE International Ultrasonics Symposium Rome, Italy, Sept 20–23, 2009 p1387
[23] Ricci S, Ramalli A, Bassi L, Boni E, Tortoli P 2017 IEEE Trans. Ultrason. Ferroelect. Freq. Control 65 201
Google Scholar
[24] Bjaerum S, Torp H, and Kristoffersen K, 2002 IEEE Trans. Ultrason. Ferroelect. Freq. Control 49 204
Google Scholar
[25] Revellin R, Rousset F, Baud D, Bonjour J 2009 Theor. Biol. Med. Modell. 6 1
Google Scholar

 DownLoad:


Catalog
Metrics
- Abstract views: 10850
- PDF Downloads: 244
- Cited By: 0
