


-
材料内部缺陷对复合材料的拉伸断裂性质有着极其重要的影响. 纤维束模型是研究材料拉伸断裂性质常用的理论模型, 已有含缺陷纤维束模型的工作表明, 在纤维束模型中引入单纤维缺陷后, 缺陷对模型拉伸断裂性质产生了显著影响. 为研究实际材料内部存在的不同尺寸及损伤程度的缺陷, 本文引入缺陷的空间尺寸、缺陷程度和缺陷内部纤维损伤程度分布等影响因素, 构建了含团簇状缺陷的扩展纤维束模型. 在最近邻应力再分配下, 通过数值模拟分析了缺陷个数α、缺陷尺寸上限β和缺陷内部纤维缺陷程度的线性、指数和常数函数分布形式对复合材料断裂过程的影响. 分析发现, 由于缺陷空间分布存在的重叠竞争机制, 在缺陷尺寸上限β较大时, 缺陷个数对系统负载能力的影响具有饱和的趋势. 而由于缺陷中心纤维的缺陷程度正比于缺陷尺寸, 因此随着缺陷尺寸上限β的增加, 其对模型负载能力的影响越来越显著. 缺陷内部纤维缺陷程度的空间分布函数对以上规律没有产生实质影响, 仅改变了各断裂性质的具体取值. 本文的模拟分析结果对提高复合材料的力学性能具有一定的理论意义.Defects that exist inside composites have an important effect on the tensile fracture properties of composites. The fiber bundle model is a theoretical model commonly used to study the tensile fracture properties of disorder materials. Existing work on fiber bundle models with single fiber defects shows that after single fiber defects are introduced into the fiber bundle model, the defects have a significant effect on the tensile fracture properties of the model. Since there are more complex microscopic defect structures in actual materials, such as voids, gaps, impurities, dislocations, micro-cracks, etc, it is necessary to build a multi-size defect model. In order to study the defects of different sizes and damage degrees existing in actual materials, the spatial size of the defect, the degree of defect and the distribution of fiber damage levels within the defect and other influencing factors are introduced to construct an extended fiber bundle model with cluster shaped defects. For the model, it is first assumed that the degree of defect of the fiber inside each cluster decays linearly from the center to the outside in two spatial attenuation forms: exponential decay and constant degree of defect. In the fiber bundle model of this cluster-shaped defect, the two most important factors are the number of defects α and the upper limit of defect size β. The numerical simulation method is used to analyze the influence of the number of defects, the upper limit of defect size, and spatial distribution of degree of defective fibers inside defect on the macroscopic mechanical properties and statistical properties of fracture when the model is subjected to quasi-static load borne under the nearest neighbor stress redistribution. Through the simulation analysis, it is found that owing to the overlapping competition mechanism of the defect spatial distribution, when the upper limit β of the defect size is large, the influence of the number of defects on the system load capacity trends to saturation. Since the defect degree of the defect center fiber is proportional to the defect size, with the upper limit β of the defect size increasing, its influence on the load capacity of the model becomes more and more significant. When large size defects exist, even if the number of defects is small, the load bearing performance of the material will be significantly reduced. The spatial distribution function of the damage degree of fiber inside the defect has no substantial influence on the above rules, and only changes the specific value of each fracture property. The simulation analysis results in this paper have certain theoretical significance in improving the mechanical properties of composite materials.
-
Keywords:
- fiber bundle model /
- defect /
- constitutive relation /
- avalanche size
[1] Lee W 1994 Phys. Rev. E 50 3797
 Google Scholar
[2] 李丽丽, Xia Zhen-Hai, 杨延清, 韩明 2015 物理学报 64 117101
Google Scholar
Li L L, Xia Z H, Yang Y Q, Han M 2015 Acta Phys. Sin. 64 117101
Google Scholar
[3] Amitrano D, Girard L 2016 Phys. Rev. E 93 033003
Google Scholar
[4] Kun F, Nagy S 2008 Phys. Rev. E 77 016608
Google Scholar
[5] Costagliola G, Bosia F, Pugno N M 2016 Phys. Rev. E 94 063003
Google Scholar
[6] Pradhan S, Hansen A, Chakrabarti B K 2010 Rev. Mod. Phys. 82 499
Google Scholar
[7] Raischel F, Kun F, Herrmann H J 2006 Phys. Rev. E 74 035104
[8] Raischel F, Kun F, Herrmann H J 2006 Phys. Rev. E 73 066101
[9] Lu C, Danzer R, Fischer F D 2002 Phys. Rev. E 65 067102
Google Scholar
[10] Manca F, Giordano S, Palla P L, Cleri F 2014 Phys. Rev. Lett. 113 255501
Google Scholar
[11] Yoshioka N, Kun F, Ito N 2015 Phys. Rev. E 91 033305
Google Scholar
[12] Korei R, Kun F 2018 Phys. Rev. E 98 023004
Google Scholar
[13] Bai Y L, Yan Z W, Ozbakkaloglu T, Han Q, Dai J G, Zhu D J 2020 Constr. Buil. Mater. 232 117241
Google Scholar
[14] Biswas S, Sen P 2015 Phys. Rev. Lett. 115 155501
Google Scholar
[15] Biswas S, Chakrabarti B K 2013 Phys. Rev. E 88 042112
[16] Zhang Y, Arenas A, Yagan O 2018 Phys. Rev. E 97 022307
[17] Roy S, Biswas S, Ray P 2017 Phys. Rev. E 96 063003
Google Scholar
[18] Gupta A, Mahesh S, Keralavarma S M 2017 Phys. Rev. E 96 043002
Google Scholar
[19] Pradhan S, Bhattacharyya P, Chakrabarti B K 2002 Phys. Rev. E 66 016116
Google Scholar
[20] Roy C, Manna S S 2016 Phys. Rev. E 94 032126
[21] Halasz Z, Kun F 2009 Phys. Rev. E 80 027102
Google Scholar
[22] Hidalgo R C, Kun F, Herrmann H J 2001 Phys. Rev. E 64 066122
Google Scholar
[23] Hidalgo R C, Kun F, Kovacs K, Pagonabarraga I 2009 Phys. Rev. E 80 051108
Google Scholar
[24] Roy S, Hatano T 2018 Phys. Rev. E 97 062149
Google Scholar
[25] Koivisto J, Ovaska M, Miksic A, Laurson L, Alava M J 2016 Phys. Rev. E 94 023002
Google Scholar
[26] Kadar V, Danku Z, Kun F 2017 Phys. Rev E. 96 033001
Google Scholar
[27] Kadar V, Kun F 2019 Phys. Rev. E 100 053001
Google Scholar
[28] Sinha S, Kjellstadli J T, Hansen A 2015 Phys. Rev. E 92 020401
[29] Danku Z, Ódor G, Kun F 2018 Phys. Rev. E 98 042126
[30] Kumar R S 2021 Eng. Fract. Mech. 248 107699
Google Scholar
[31] Zerbst U, Klinger 2019 Int. J. Fatigue 127 312
Google Scholar
[32] 喻寅, 贺红亮, 王文强, 卢铁城 2014 物理学报 63 246102
Google Scholar
Yu Y, Jia H L, Wang W Q, Lu T C 2014 Acta Phys. Sin. 63 246102
Google Scholar
[33] 陈兴, 马刚, 周伟, 赖国伟, 来志强 2018 物理学报 67 146102
Google Scholar
Chen X, Ma G, Zhou W, Lai G W, Lai Z Q 2018 Acta Phys. Sin. 67 146102
Google Scholar
[34] Hao D P, Tang G, Xia H, Xun Z P, Han K 2017 Physica A 472 77
Google Scholar
[35] Hao D P, Tang G, Xun Z P, Xia H, Han K 2018 Physica A 505 1095
Google Scholar
[36] Hassold G N, Srolovitz D J 1989 Phys. Rev. B 39 9273
Google Scholar
[37] Roy C, Manna S S 2019 Phys. Rev. E 100 012107
-

图 1 一维纤维束模型的团簇状缺陷程度示意图
Fig. 1. Schematic diagram of cluster defect degree for one-dimensional fiber bundle model. The Cartesian coordinate system is established with defect center as its coordinate zero.
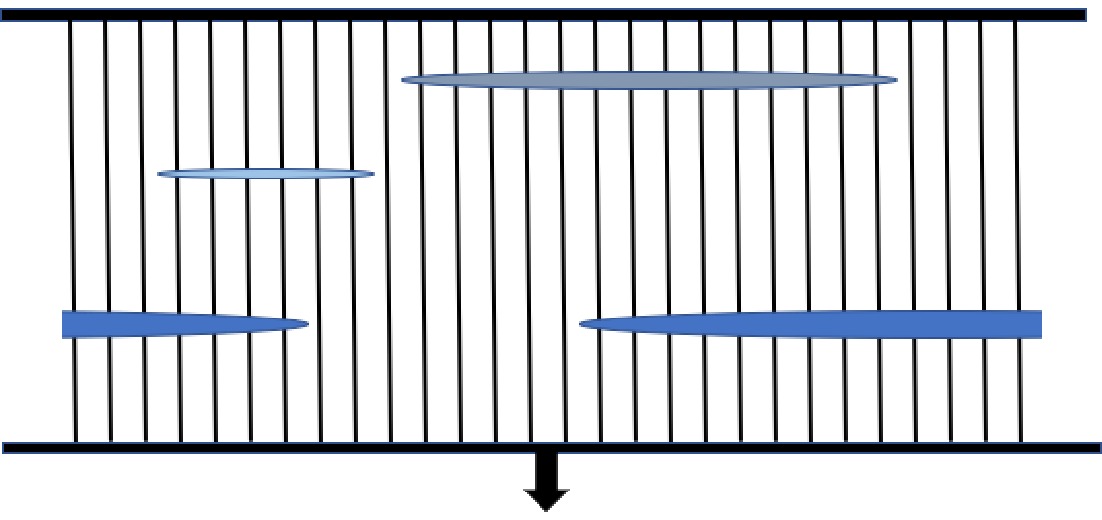
图 2 一维纤维束模型的团簇状缺陷模型示意图, 其中包含3个缺陷, 缺陷和纤维束都采用周期性边界条件
Fig. 2. Schematic diagram of the clustered defect model of the one-dimensional fiber bundle model, which contains 3 defects, both the defect and the fiber bundle adopt periodic boundary conditions.

图 3 不同缺陷个数α下系统的本构关系, α在50—3200的范围内变化, 图中
$\varepsilon $ 表示应变,$\sigma $ 表示应力Fig. 3. Constitutive curves of the system under different number of defects α, α varies from 50 to 3200. In the figure,
$\varepsilon $ represents strain and$\sigma $ represents stress.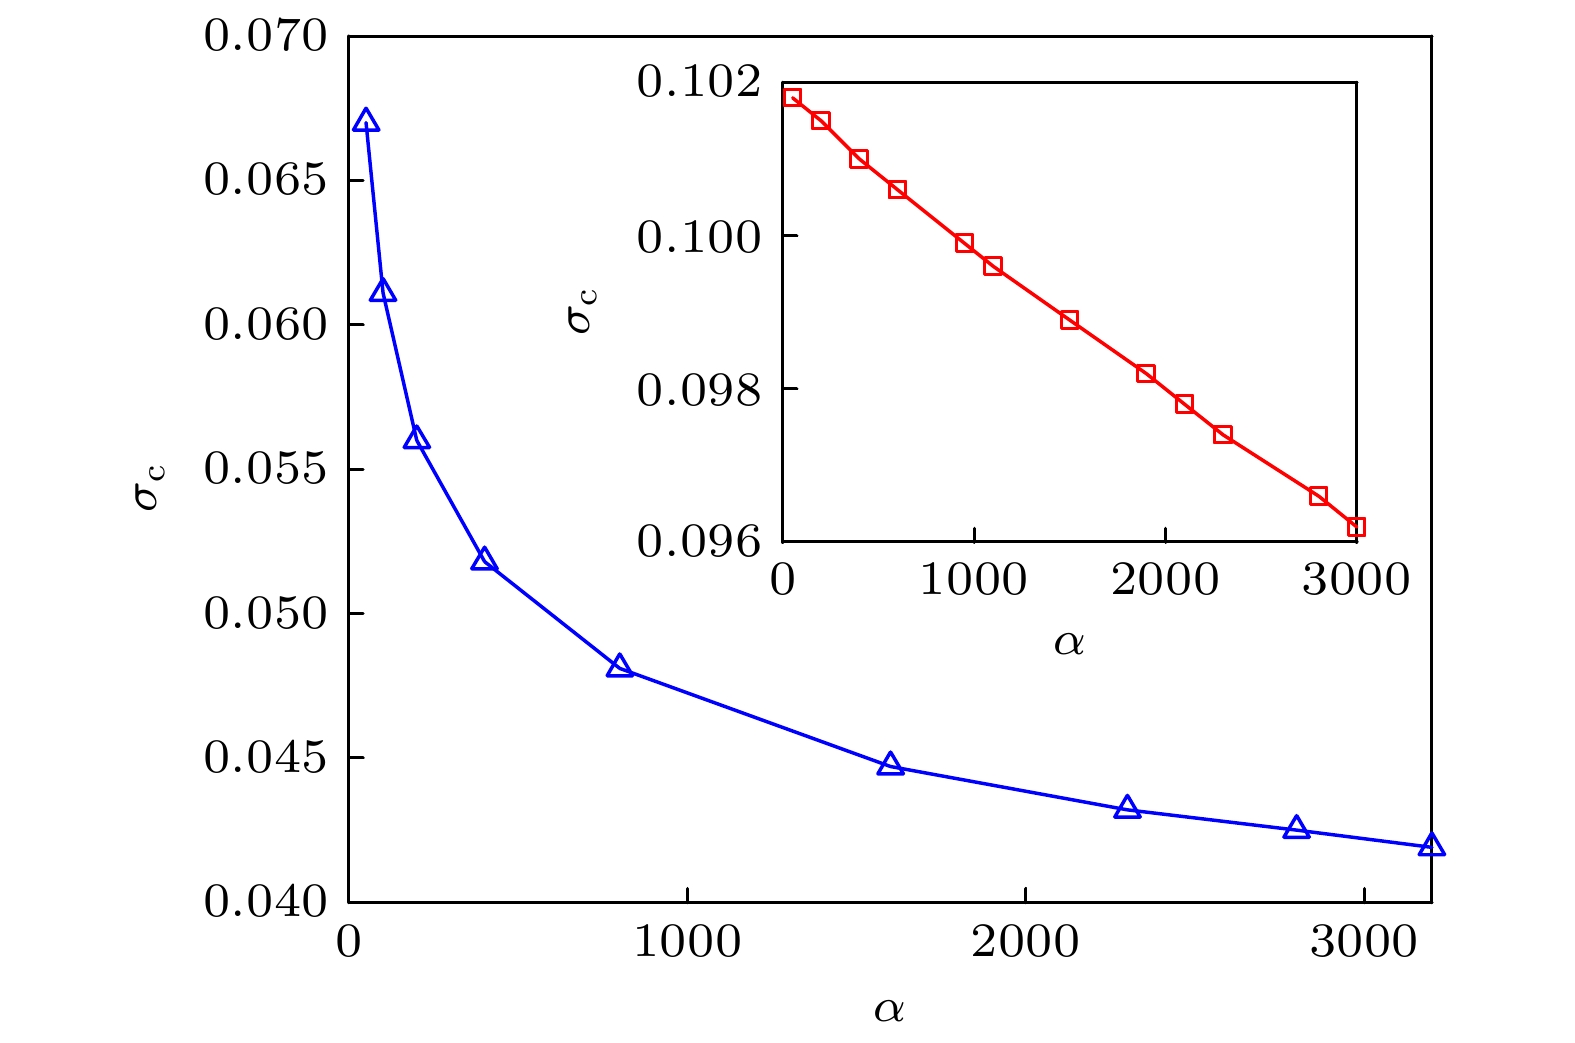
图 4 临界应力随缺陷个数α的变化关系, 插图为β = 40时临界应力随着缺陷个数α的变化关系, 此时临界应力接近于线性变化
Fig. 4. Relationship between critical stress and the number of defects α. In the inset, the relationship between critical stress and the number of defects α with β = 40 is shown, at this time, the critical stress changes linearly with α.

图 5 最大雪崩尺寸
${\varDelta _{\text{m}}}$ 和负载加载步数step随着缺陷个数α的变化, 在α = 400处最大雪崩尺寸和负载加载步数均出现极值Fig. 5. The maximum avalanche size (
${\varDelta _{\text{m}}}$ ) and the step number of load increase (step) vary with the number of defects. The maximum avalanche size and the step number of load increase reach the extreme value at α = 400.
图 6 不同β取值下的最大雪崩尺寸和负载加载步数极值的出现情况 (a) β = 120; (b) β = 90; (c) β = 70; (d) β = 60. 当β取值较大时最大雪崩和加载步数与缺陷个数α存在类似二次函数的关系
Fig. 6. The extreme values of the maximum avalanche size and the step number of load increase with different β: (a) β = 120; (b) β = 90; (c) β = 70; (d) β = 60. When the value of β is large, there is a similar quadratic function between the maximum avalanche, the step number of load increase and the number of defects α.

图 7 缺陷个数α不同取值下的雪崩尺寸分布
Fig. 7. The avalanche size distribution under different values of the number of defects α.

图 8 不同缺陷尺寸上限β下模型的本构关系曲线
Fig. 8. The constitutive curves of the model with different maximum defect sizes.
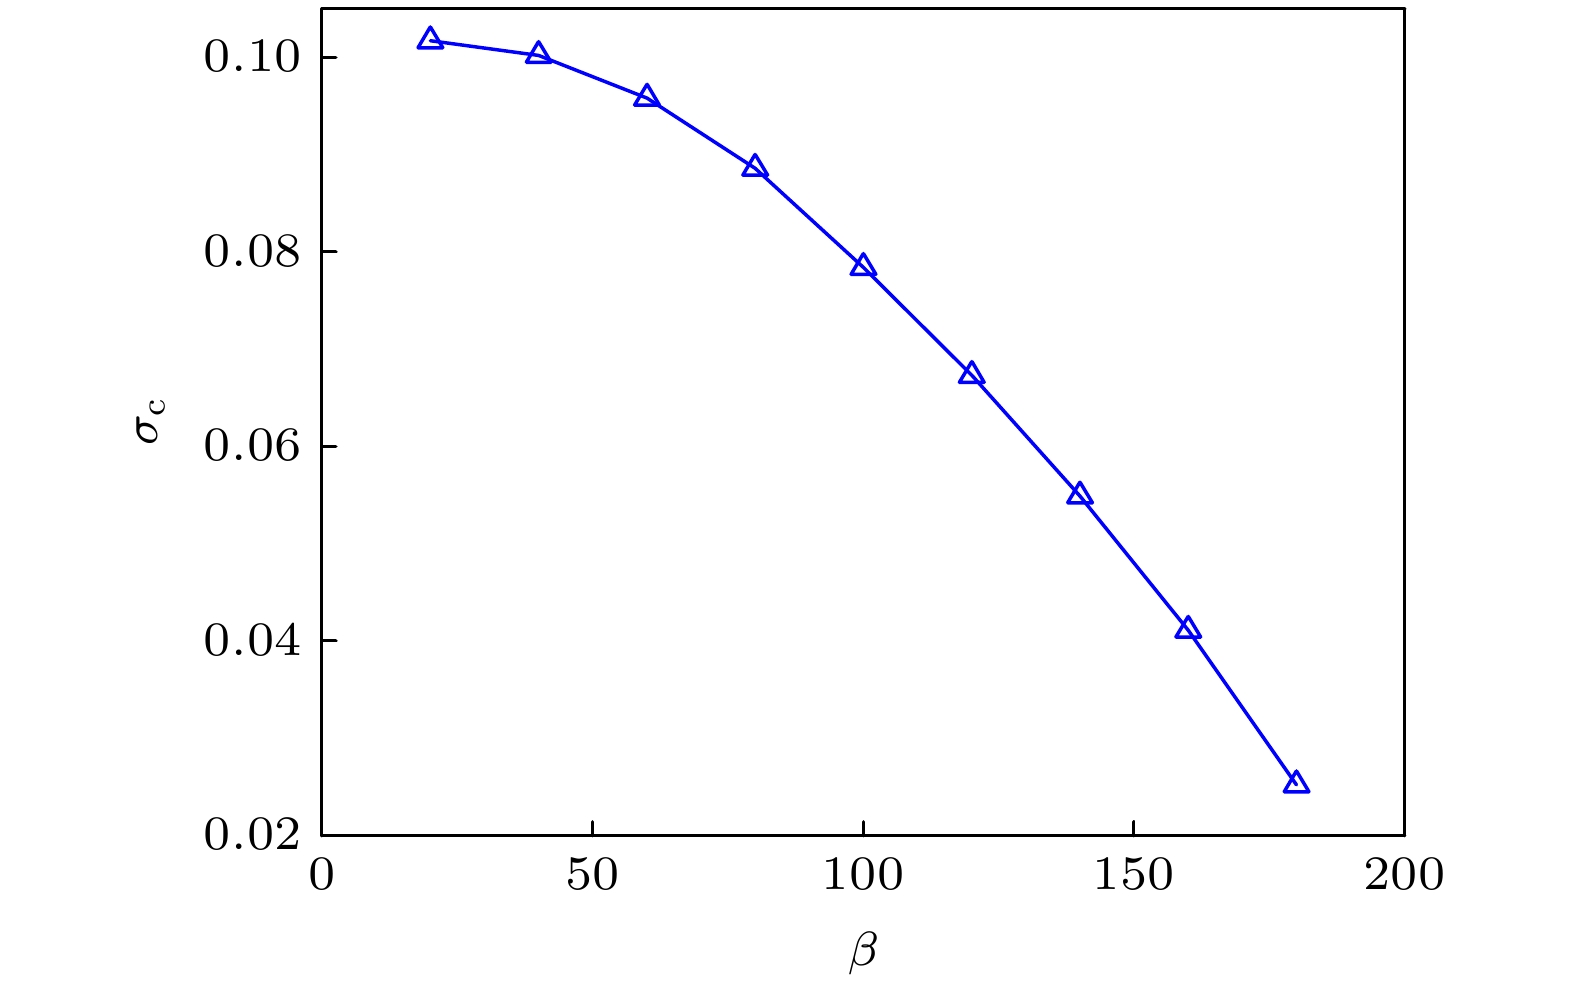
图 9 不同缺陷尺寸上限β下的临界应力, β值在20—560之间变化
Fig. 9. The critical stress at different maximum defect sizes β varying from 20 to 560.

图 10 不同缺陷尺寸上限β下的最大雪崩尺寸和负载加载步数, β值在20—180之间变化
Fig. 10. The maximum avalanche size and the step number of load increase at different maximum defect sizes β varying from 20 to 180.
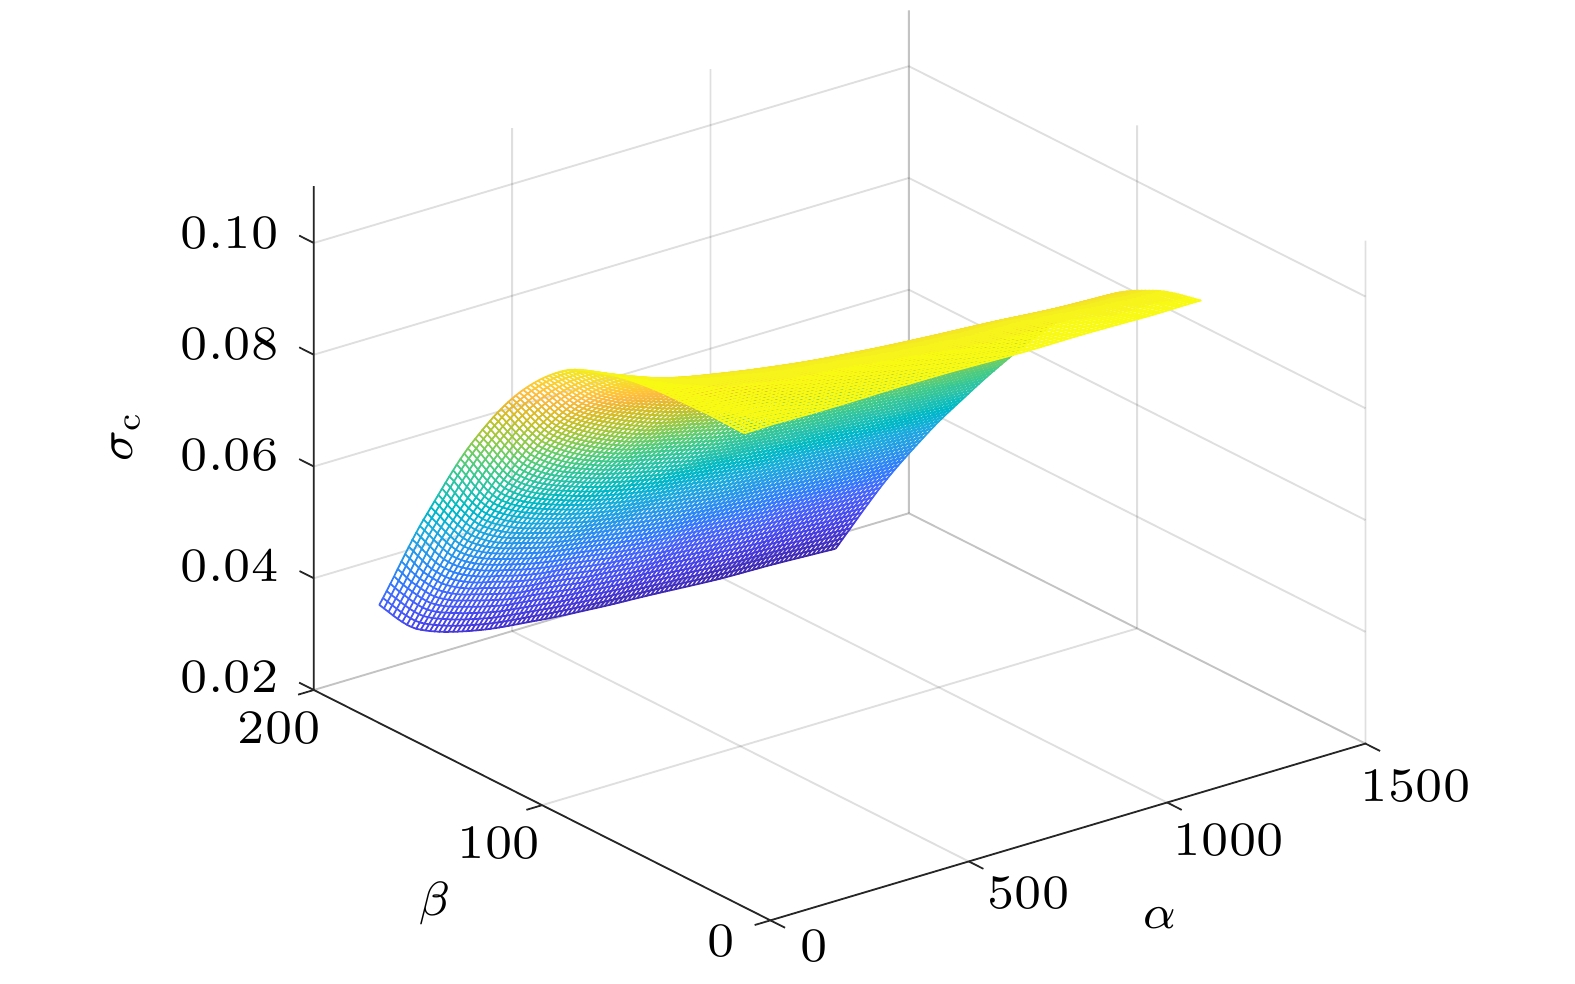
图 11 系统的临界应力随着缺陷数目以及尺寸变化的三维空间相图, 其中缺陷数目在50—1200之间变化, 缺陷尺寸在20—180之间变化
Fig. 11. Phase diagram of critical stress that varies with the number and size of defects, where the number of defects varies from 50 to 1200 and the size of defects varies from 20 to 180.
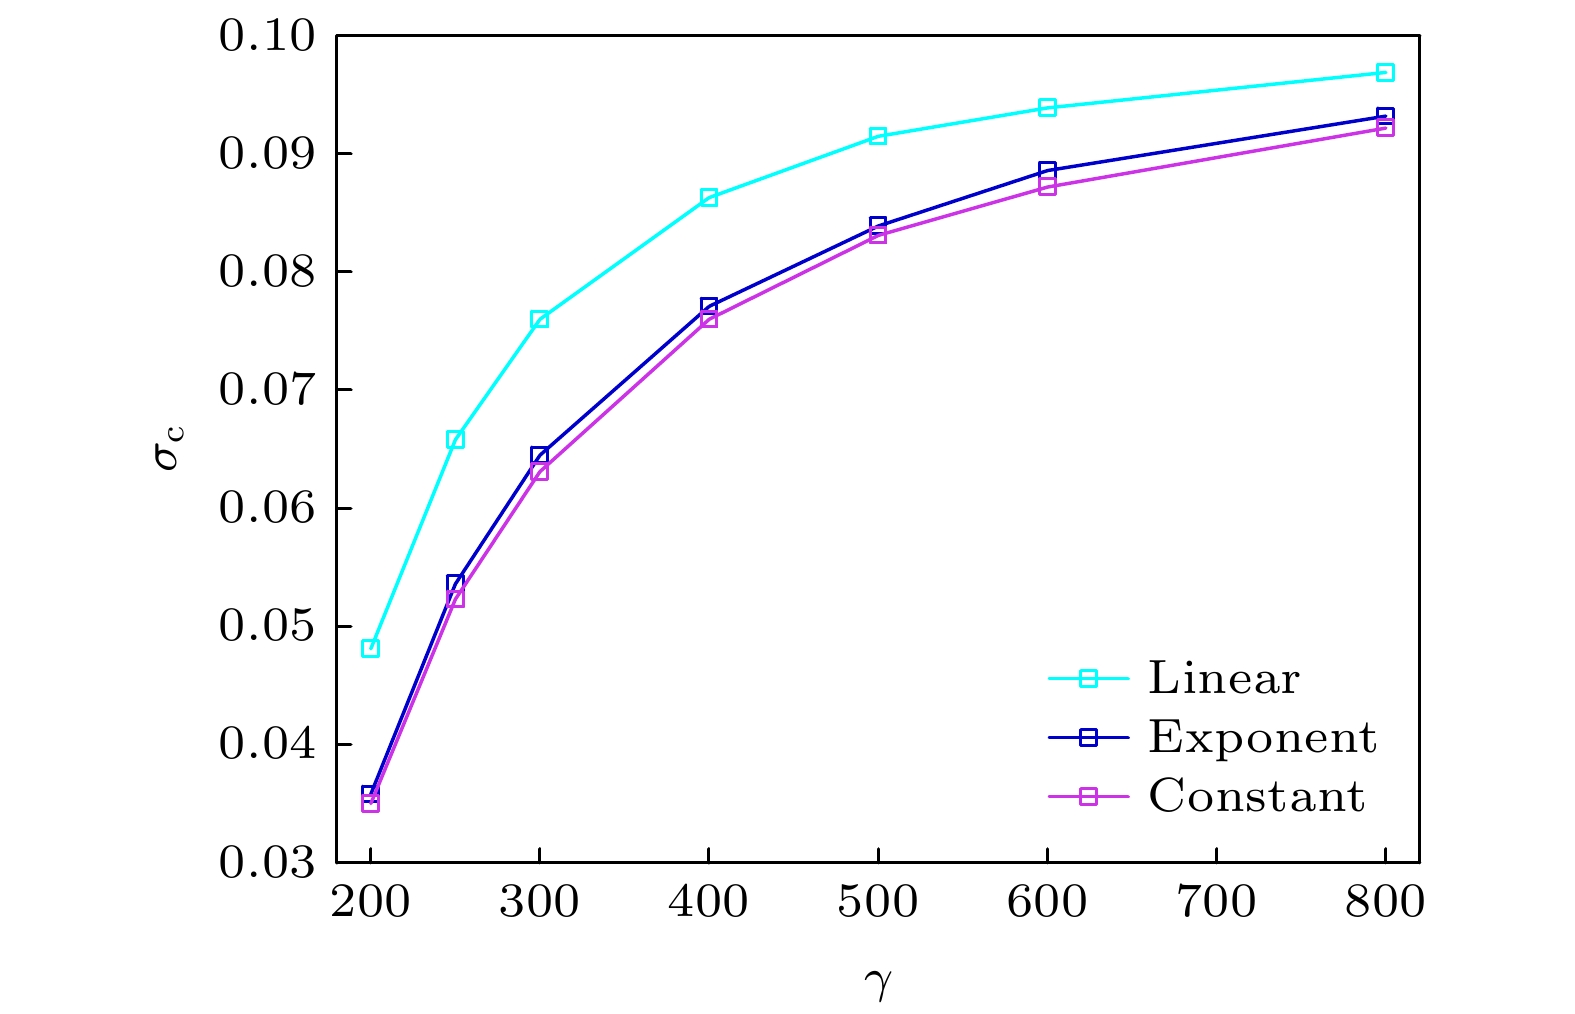
图 12 缺陷程度空间衰减方式分别为线性、指数和常数函数情况下的中心缺陷程度对临界应力的影响, 缺陷个数为800, 缺陷尺寸上限为150
Fig. 12. The influence of the degree of central defect on the critical stress when the spatial attenuation modes of the defect degree are linear, exponential and constant functions. The number of defects is 800, and the maximum defect size is 150.

图 13 缺陷程度空间衰减方式分别为线性、指数和常数函数情况下, 最大雪崩尺寸和负载加载步数随中心缺陷程度的变化. 缺陷个数为800, 缺陷尺寸上限为150
Fig. 13. The maximum avalanche size and the step number of load increase vary with the degree of the central defect when the spatial attenuation modes of the defect degree are linear, exponential and constant functions. The number of defects is 800, and the maximum defect size is 150.
-
[1] Lee W 1994 Phys. Rev. E 50 3797
Google Scholar
[2] 李丽丽, Xia Zhen-Hai, 杨延清, 韩明 2015 物理学报 64 117101
Google Scholar
Li L L, Xia Z H, Yang Y Q, Han M 2015 Acta Phys. Sin. 64 117101
Google Scholar
[3] Amitrano D, Girard L 2016 Phys. Rev. E 93 033003
Google Scholar
[4] Kun F, Nagy S 2008 Phys. Rev. E 77 016608
Google Scholar
[5] Costagliola G, Bosia F, Pugno N M 2016 Phys. Rev. E 94 063003
Google Scholar
[6] Pradhan S, Hansen A, Chakrabarti B K 2010 Rev. Mod. Phys. 82 499
Google Scholar
[7] Raischel F, Kun F, Herrmann H J 2006 Phys. Rev. E 74 035104
[8] Raischel F, Kun F, Herrmann H J 2006 Phys. Rev. E 73 066101
[9] Lu C, Danzer R, Fischer F D 2002 Phys. Rev. E 65 067102
Google Scholar
[10] Manca F, Giordano S, Palla P L, Cleri F 2014 Phys. Rev. Lett. 113 255501
Google Scholar
[11] Yoshioka N, Kun F, Ito N 2015 Phys. Rev. E 91 033305
Google Scholar
[12] Korei R, Kun F 2018 Phys. Rev. E 98 023004
Google Scholar
[13] Bai Y L, Yan Z W, Ozbakkaloglu T, Han Q, Dai J G, Zhu D J 2020 Constr. Buil. Mater. 232 117241
Google Scholar
[14] Biswas S, Sen P 2015 Phys. Rev. Lett. 115 155501
Google Scholar
[15] Biswas S, Chakrabarti B K 2013 Phys. Rev. E 88 042112
[16] Zhang Y, Arenas A, Yagan O 2018 Phys. Rev. E 97 022307
[17] Roy S, Biswas S, Ray P 2017 Phys. Rev. E 96 063003
Google Scholar
[18] Gupta A, Mahesh S, Keralavarma S M 2017 Phys. Rev. E 96 043002
Google Scholar
[19] Pradhan S, Bhattacharyya P, Chakrabarti B K 2002 Phys. Rev. E 66 016116
Google Scholar
[20] Roy C, Manna S S 2016 Phys. Rev. E 94 032126
[21] Halasz Z, Kun F 2009 Phys. Rev. E 80 027102
Google Scholar
[22] Hidalgo R C, Kun F, Herrmann H J 2001 Phys. Rev. E 64 066122
Google Scholar
[23] Hidalgo R C, Kun F, Kovacs K, Pagonabarraga I 2009 Phys. Rev. E 80 051108
Google Scholar
[24] Roy S, Hatano T 2018 Phys. Rev. E 97 062149
Google Scholar
[25] Koivisto J, Ovaska M, Miksic A, Laurson L, Alava M J 2016 Phys. Rev. E 94 023002
Google Scholar
[26] Kadar V, Danku Z, Kun F 2017 Phys. Rev E. 96 033001
Google Scholar
[27] Kadar V, Kun F 2019 Phys. Rev. E 100 053001
Google Scholar
[28] Sinha S, Kjellstadli J T, Hansen A 2015 Phys. Rev. E 92 020401
[29] Danku Z, Ódor G, Kun F 2018 Phys. Rev. E 98 042126
[30] Kumar R S 2021 Eng. Fract. Mech. 248 107699
Google Scholar
[31] Zerbst U, Klinger 2019 Int. J. Fatigue 127 312
Google Scholar
[32] 喻寅, 贺红亮, 王文强, 卢铁城 2014 物理学报 63 246102
Google Scholar
Yu Y, Jia H L, Wang W Q, Lu T C 2014 Acta Phys. Sin. 63 246102
Google Scholar
[33] 陈兴, 马刚, 周伟, 赖国伟, 来志强 2018 物理学报 67 146102
Google Scholar
Chen X, Ma G, Zhou W, Lai G W, Lai Z Q 2018 Acta Phys. Sin. 67 146102
Google Scholar
[34] Hao D P, Tang G, Xia H, Xun Z P, Han K 2017 Physica A 472 77
Google Scholar
[35] Hao D P, Tang G, Xun Z P, Xia H, Han K 2018 Physica A 505 1095
Google Scholar
[36] Hassold G N, Srolovitz D J 1989 Phys. Rev. B 39 9273
Google Scholar
[37] Roy C, Manna S S 2019 Phys. Rev. E 100 012107

 下载:
下载:


计量
- 文章访问数: 6093
- PDF下载量: 61
- 被引次数: 0
