


-
Recently, the short-pulse intense laser has become a common tool for studying the relativistic plasma with tremendous physical parameters. And the laser-driven magnetic reconnection is one of the hot topics and has received much attention. The laser-driven magnetic reconnection experiments are usually conducted by closely focusing two laser beams on a planar coil target. However, it is always hard to distinguish the physical property of magnetic reconnection from the complex background of laser-produced plasma. In this paper, we present the particle-in-cell simulation results of magnetic reconnection driven by two short-pulse lasers as well as a single laser pulse irradiating the solid planar target, and discuss the correlation between the potential distribution behind the target and the magnetic reconnection. When a single laser is used, the potential behind the target shows a double-peak distribution, which is in agreement with recent experimental results. When two lasers irradiate the target, the potential behind the target shows a three-peak distribution. The accumulated spatial distribution of plasma ions with fixed energy (4.5 and 6 MeV) at 3 μm behind the target shows several peaks, which is in agreement with the potential distribution when either a single laser or two lasers are used. In addition, after the laser pulse terminates, in the two-laser case there is extremely strong effect on the topological structure of the electric field compared with in the singlelaser case. When the magnetic reconnection happens (which can be identified through the reconnection electric field and the electron energy spectrum), the amplitude of the x component of the electric field has different evolution characteristics from the single laser case. The line outs of the y component of the electric field in two cases also have completely different shapes. In summary, the simulation results reveal that the potential distribution behind the target can directly affect the spatial distribution of the accelerated ions. This could be possibly used to identify the short pulse laser-driven magnetic reconnection in experiment.
[1] Mei Z, Shen C, Wu N, Lin J, Murphy N A, Roussev I I 2012 Mon. Not. R. Astron. Soc. 425 2824
 Google Scholar
[2] Uzdensky D A, Cerutti B, Bgelman M C 2011 Astrophys. J. Lett. 737 L40
Google Scholar
[3] Meng Y, Lin J, Zhang L, Reeves K K, Zhang Q S, Yuan F 2014 Astrophys. J. 785 62
Google Scholar
[4] Gregory C D, Howe J, Loupias B, Myers S, Notley M M, Sakawa Y, Oya A, Kodama R, Koenig M, Woolsey N C 2008 Astrophys. J. 676 420
[5] Werner G R, Uzdensky D A, Begelman M C, Cerutti B, Nalewajko K 2018 Mon. Not. R. Astron. Soc. 473 4840
Google Scholar
[6] Nilson P M, Willingale L, Kaluza M C, et al. 2006 Phys. Rev. Lett. 97 255001
Google Scholar
[7] Willingale L, Nilson P M, Kaluza M C, et al. 2010 Phys. Plasmas 17 043104
Google Scholar
[8] Ryutov D D, Drake R P, Remington B A 2000 Astrophys. J. Suppl. Ser. 127 465
Google Scholar
[9] Zhong J Y, Li Y T, Wang X G, et al. 2010 Nat. Phys. 6 984
Google Scholar
[10] Masuda S, Kosugi T, Hara H, Tsuneta S, Ogawara Y 1994 Nature 371 495
Google Scholar
[11] Wagner U, Tatarakis M, Gopal A, et al. 2004 Phys. Rev. E 70 026401
Google Scholar
[12] Raymond A E, Dong C F, McKelvey A, et al. 2018 Phys. Rev. E 98 043207
Google Scholar
[13] Ping Y L, Zhong J Y, Sheng Z M, Wang X G, Liu B, Li Y T, Yan X Q, He X T, Zhang J, Zhao G 2014 Phys. Rev. E 89 031101
Google Scholar
[14] Gu Y J, Klimo O, Kumar D, Bulanov S V, Esirkepov T Z, Weber S, Korn G 2015 Phys. Plasmas 22 103113
Google Scholar
[15] Guo F, Li H, Daughton W, Liu Y H, 2014 Phys. Rev. Lett. 113 155005
Google Scholar
[16] Guo F, Li X, Daughton W, Kilian P, Li H, Liu Y H, Yan W C, Ma D 2019 Astrophys. J. Lett. 879 L23
Google Scholar
[17] Kagan D, Sironi L, Cerutti B, Giannios D 2015 Space Sci. Rev. 191 545
Google Scholar
[18] Arber T D, Bennett K, Brady C S, et al. 2015 Plasma Phys. Contr. F. 57 113001
Google Scholar
[19] Chen M, Shenga Z M, Zheng J, Ma Y Y, Bari M A, Li Y T, Zhang J 2006 Opt. Express 14 3093
Google Scholar
[20] Wilks S C, Langdon A B, Cowan T E, et al. 2001 Phys. Plasmas 8 542
Google Scholar
[21] Sentoku Y, d’Humières E, Romagnani L, Audebert P, Fuchs J 2011 Phys. Rev. Lett. 107 135005
Google Scholar
-
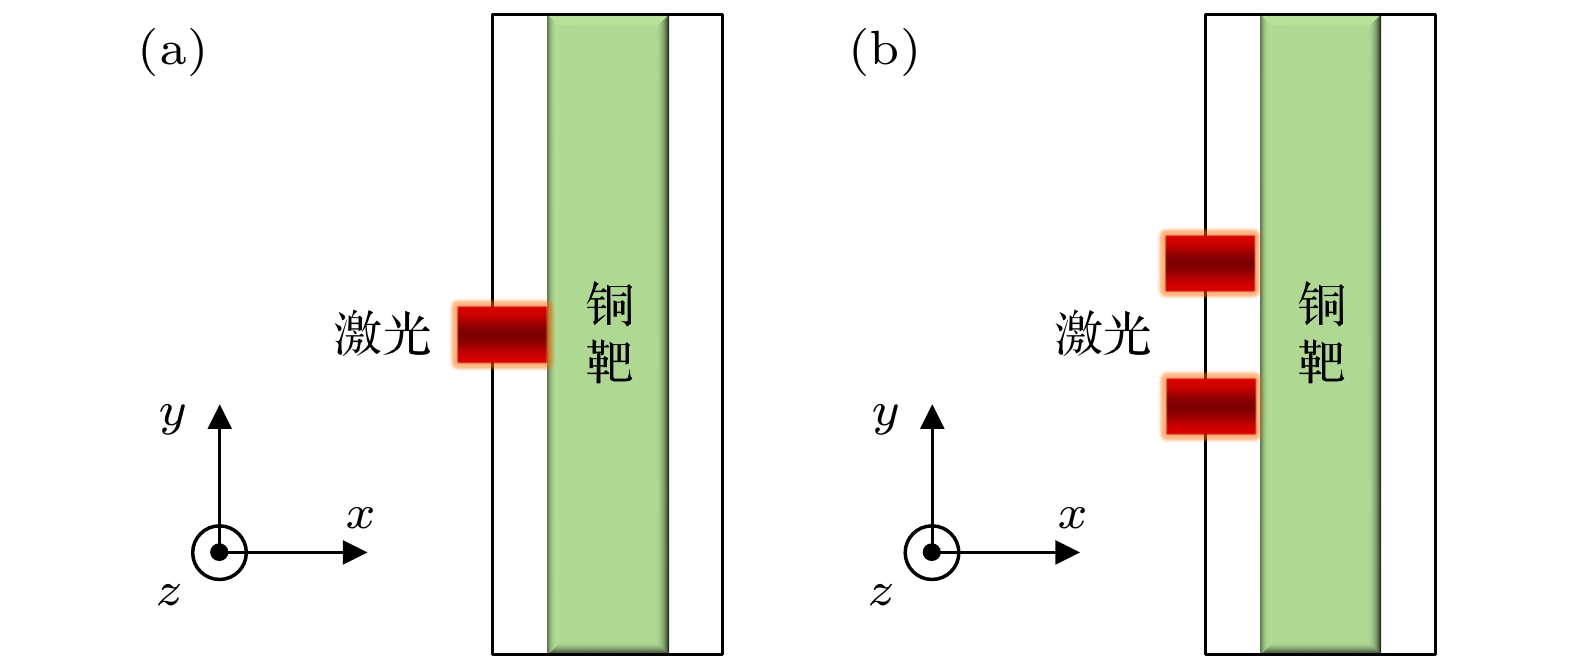
图 1 模拟区域内的激光和固体平面靶(黑色线框为模拟区域) (a) 单束激光; (b) 两束激光
Fig. 1. Lasers and solid planar target in the simulation box (black wireframe serves as the simulation box): (a) Single laser; (b) two lasers.

图 2 (a) 靶前和(b) 靶后的鞘层电场Ex随时间的变化
Fig. 2. Sheath electric field Ex curves over time at (a) the front target and (b) the rear target.
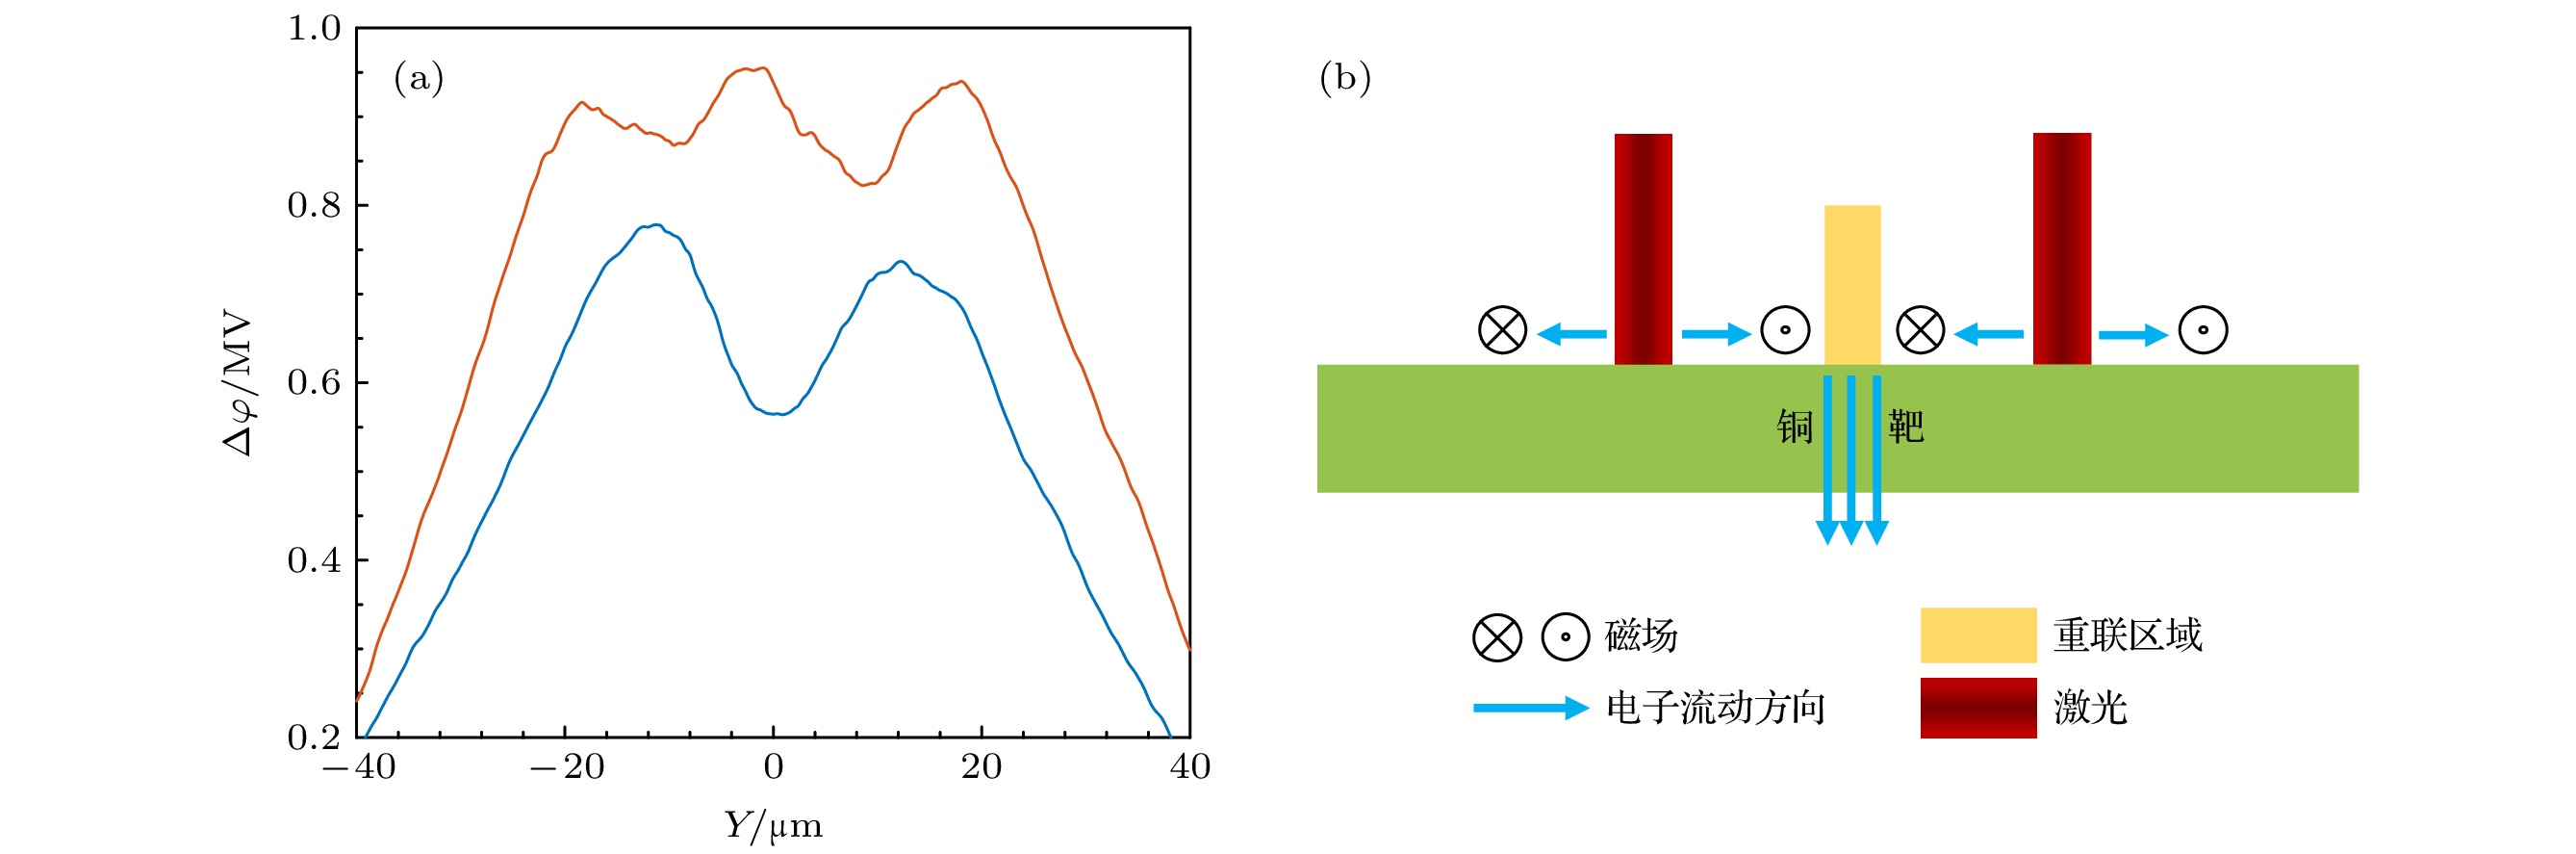
图 3 (a) 单束激光(蓝色)和两束激光(橙色)对时间取平均后得到的靶后电势分布; (b) 磁重联过程的示意图
Fig. 3. (a) Electric potential distribution averaged over certain time at the target back obtained from the data of single laser (blue line) and two lasers (orange line) respectively; (b) the illustration of magnetic reconnection process.
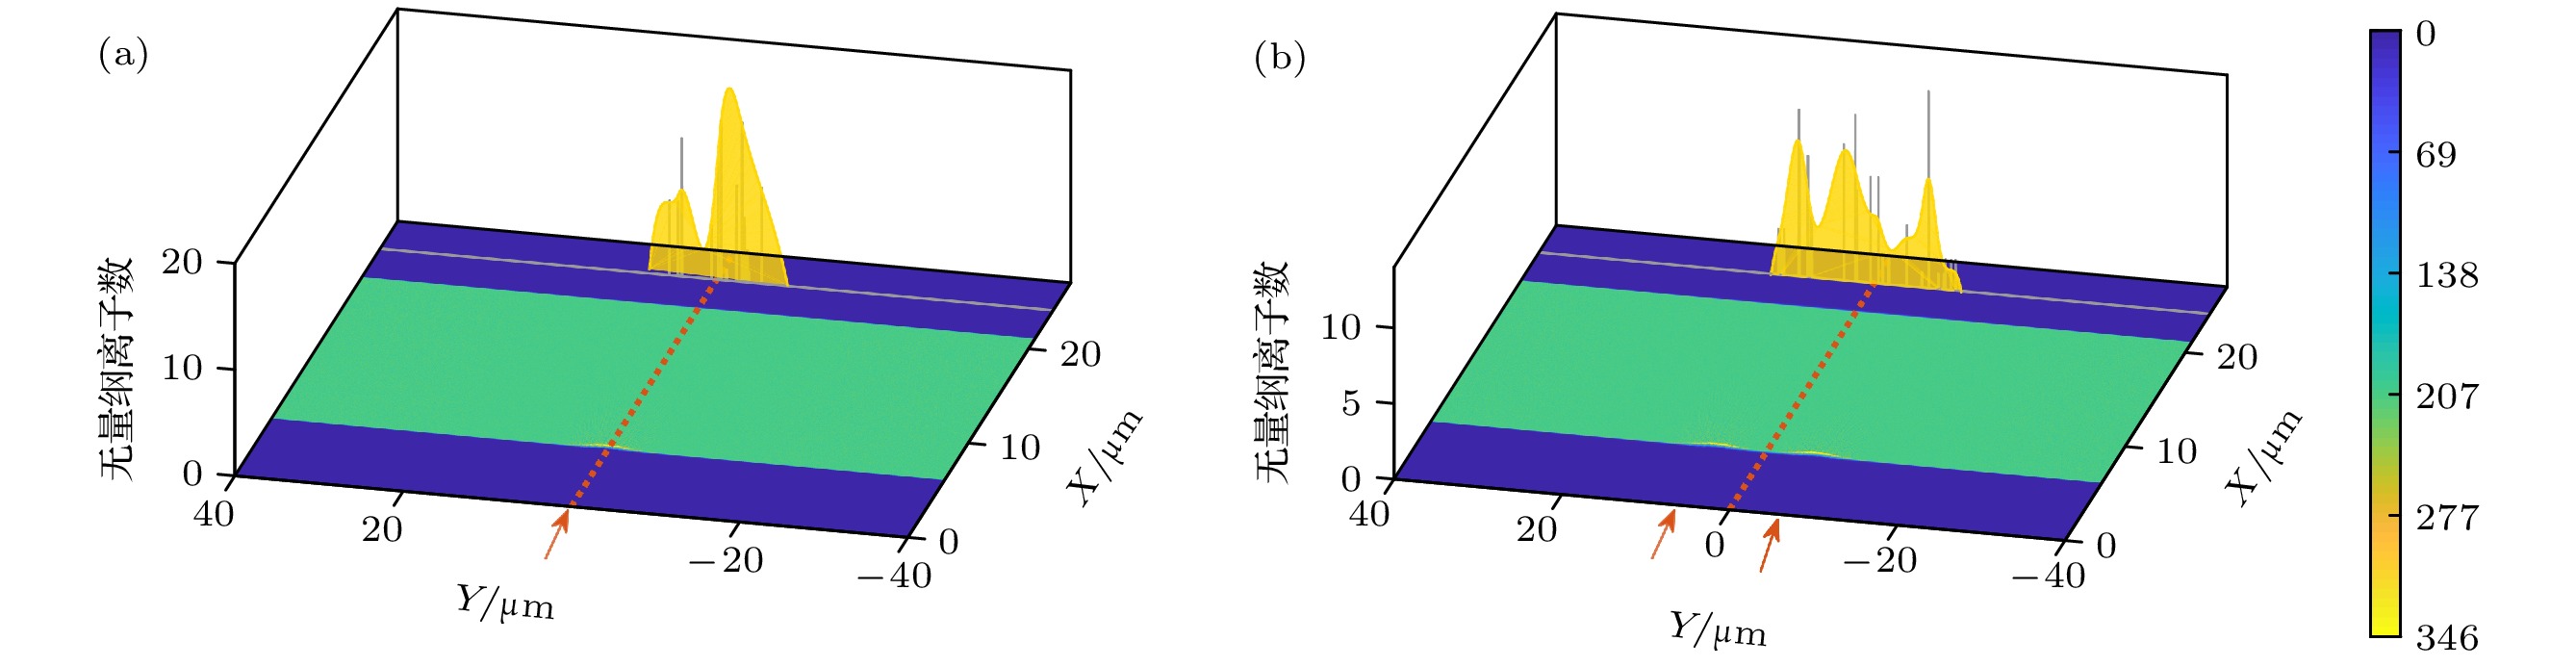
图 4 靶后离子分布的统计结果(灰色针状图)和拟合结果(黄色曲线), 其中X-Y平面的图像是粒子密度(单位经过了临界密度归一化处理); 红色箭头表示激光入射位置 (a) 单束激光模拟中的靶后4.5 MeV离子的分布; (b) 两束激光模拟中的靶后6 MeV离子的分布
Fig. 4. Ion distribution at target back from the statistical results (gray needle figure) and the fitting result (yellow curve): (a) 4.5 MeV ion distribution behind the target from simulation of single laser; (b) 6 MeV ion distribution behind the target from simulation of two lasers. Particle number density figure plots on X-Y plane. Laser incident point is marked by red arrows

图 5 靶后1 μm沿Y轴的电场强度Ex和Ey, 时间分别为(a) 370, (b) 460, (c) 370和(d) 500 fs
Fig. 5. Electric field Ex and Ey over Y-axis at 1 μm behind the target for (a) 370, (b) 460, (c) 370, and (d) 500 fs.
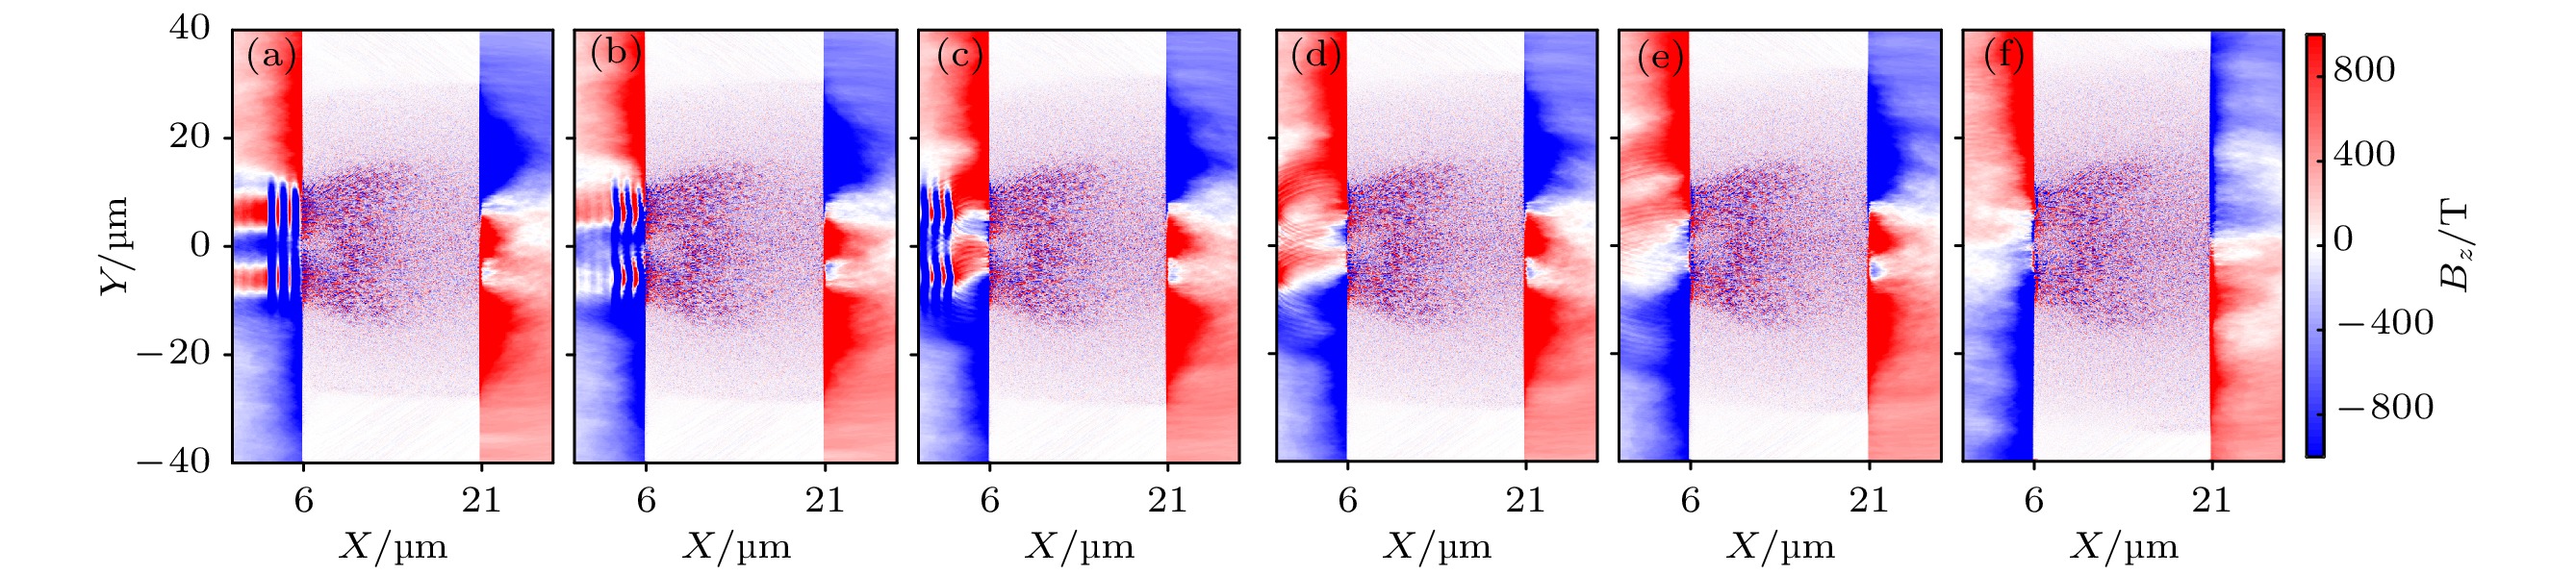
图 6 磁场Bz在(a) t = 370, (b) t = 380, (c) t = 390, (d) t = 400, (e) t = 410和(f) t = 460 fs的图像
Fig. 6. Figure of magnetic field Bz at (a) t = 370, (b) t = 380, (c) t = 390, (d) t = 400, (e) t = 410 and (f) t = 460 fs.
-
[1] Mei Z, Shen C, Wu N, Lin J, Murphy N A, Roussev I I 2012 Mon. Not. R. Astron. Soc. 425 2824
Google Scholar
[2] Uzdensky D A, Cerutti B, Bgelman M C 2011 Astrophys. J. Lett. 737 L40
Google Scholar
[3] Meng Y, Lin J, Zhang L, Reeves K K, Zhang Q S, Yuan F 2014 Astrophys. J. 785 62
Google Scholar
[4] Gregory C D, Howe J, Loupias B, Myers S, Notley M M, Sakawa Y, Oya A, Kodama R, Koenig M, Woolsey N C 2008 Astrophys. J. 676 420
[5] Werner G R, Uzdensky D A, Begelman M C, Cerutti B, Nalewajko K 2018 Mon. Not. R. Astron. Soc. 473 4840
Google Scholar
[6] Nilson P M, Willingale L, Kaluza M C, et al. 2006 Phys. Rev. Lett. 97 255001
Google Scholar
[7] Willingale L, Nilson P M, Kaluza M C, et al. 2010 Phys. Plasmas 17 043104
Google Scholar
[8] Ryutov D D, Drake R P, Remington B A 2000 Astrophys. J. Suppl. Ser. 127 465
Google Scholar
[9] Zhong J Y, Li Y T, Wang X G, et al. 2010 Nat. Phys. 6 984
Google Scholar
[10] Masuda S, Kosugi T, Hara H, Tsuneta S, Ogawara Y 1994 Nature 371 495
Google Scholar
[11] Wagner U, Tatarakis M, Gopal A, et al. 2004 Phys. Rev. E 70 026401
Google Scholar
[12] Raymond A E, Dong C F, McKelvey A, et al. 2018 Phys. Rev. E 98 043207
Google Scholar
[13] Ping Y L, Zhong J Y, Sheng Z M, Wang X G, Liu B, Li Y T, Yan X Q, He X T, Zhang J, Zhao G 2014 Phys. Rev. E 89 031101
Google Scholar
[14] Gu Y J, Klimo O, Kumar D, Bulanov S V, Esirkepov T Z, Weber S, Korn G 2015 Phys. Plasmas 22 103113
Google Scholar
[15] Guo F, Li H, Daughton W, Liu Y H, 2014 Phys. Rev. Lett. 113 155005
Google Scholar
[16] Guo F, Li X, Daughton W, Kilian P, Li H, Liu Y H, Yan W C, Ma D 2019 Astrophys. J. Lett. 879 L23
Google Scholar
[17] Kagan D, Sironi L, Cerutti B, Giannios D 2015 Space Sci. Rev. 191 545
Google Scholar
[18] Arber T D, Bennett K, Brady C S, et al. 2015 Plasma Phys. Contr. F. 57 113001
Google Scholar
[19] Chen M, Shenga Z M, Zheng J, Ma Y Y, Bari M A, Li Y T, Zhang J 2006 Opt. Express 14 3093
Google Scholar
[20] Wilks S C, Langdon A B, Cowan T E, et al. 2001 Phys. Plasmas 8 542
Google Scholar
[21] Sentoku Y, d’Humières E, Romagnani L, Audebert P, Fuchs J 2011 Phys. Rev. Lett. 107 135005
Google Scholar

 下载:
下载:

计量
- 文章访问数: 6927
- PDF下载量: 78
- 被引次数: 0
