


-
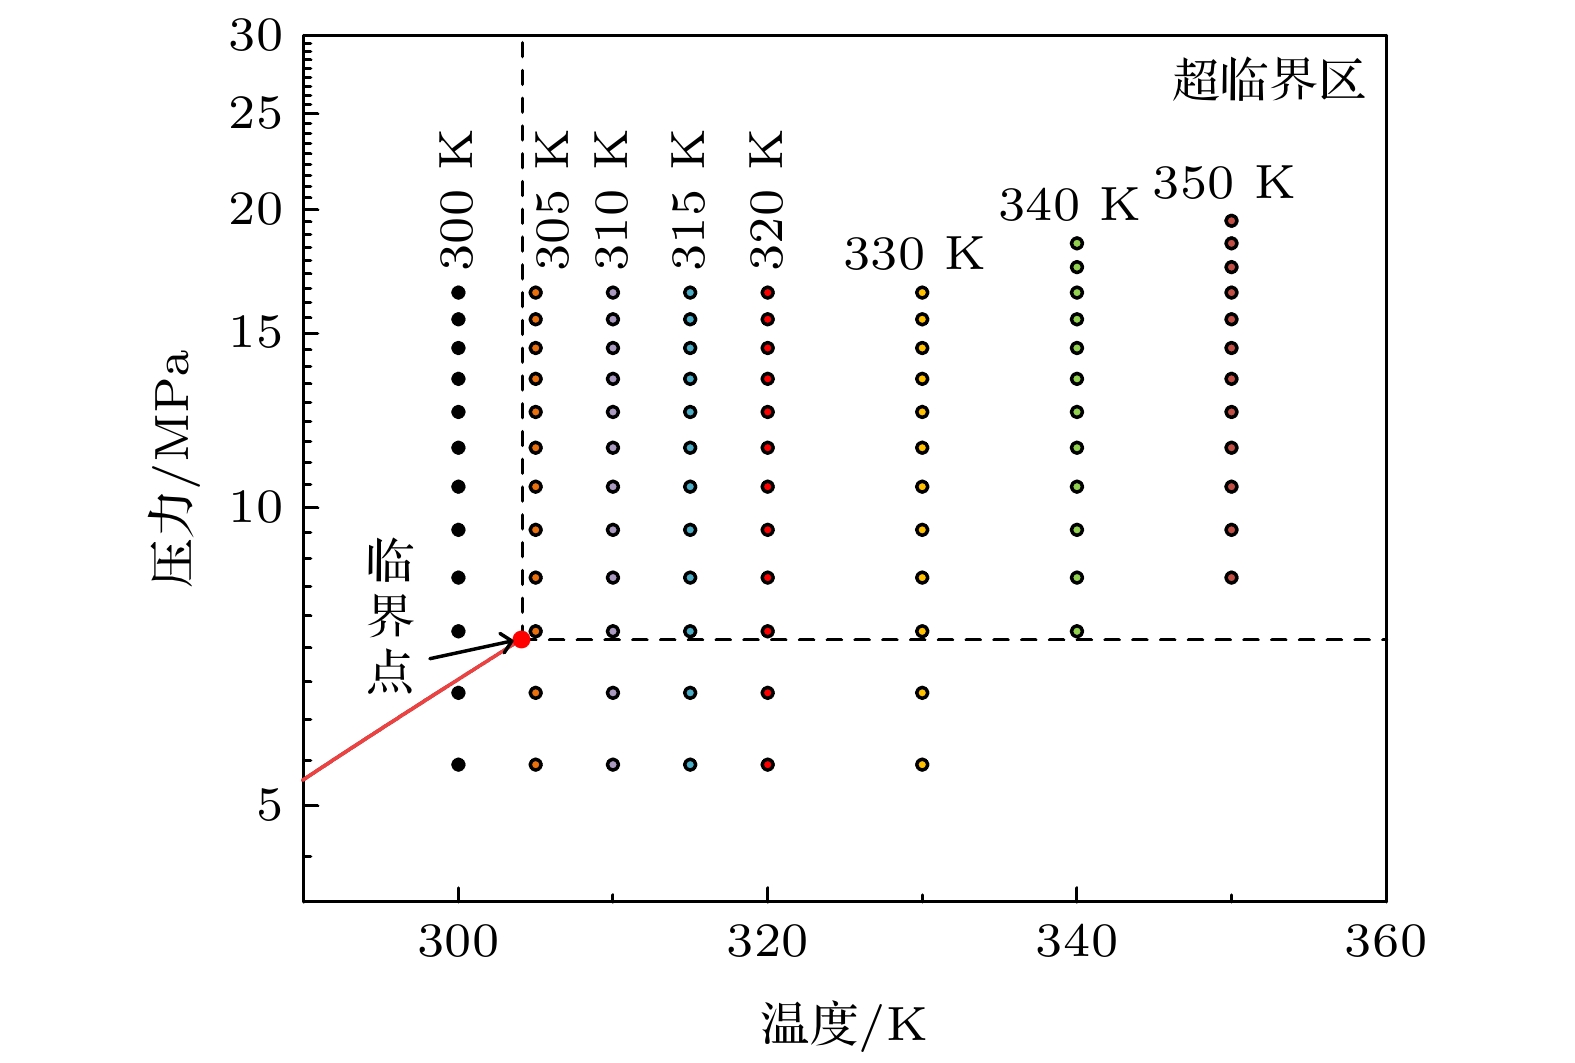
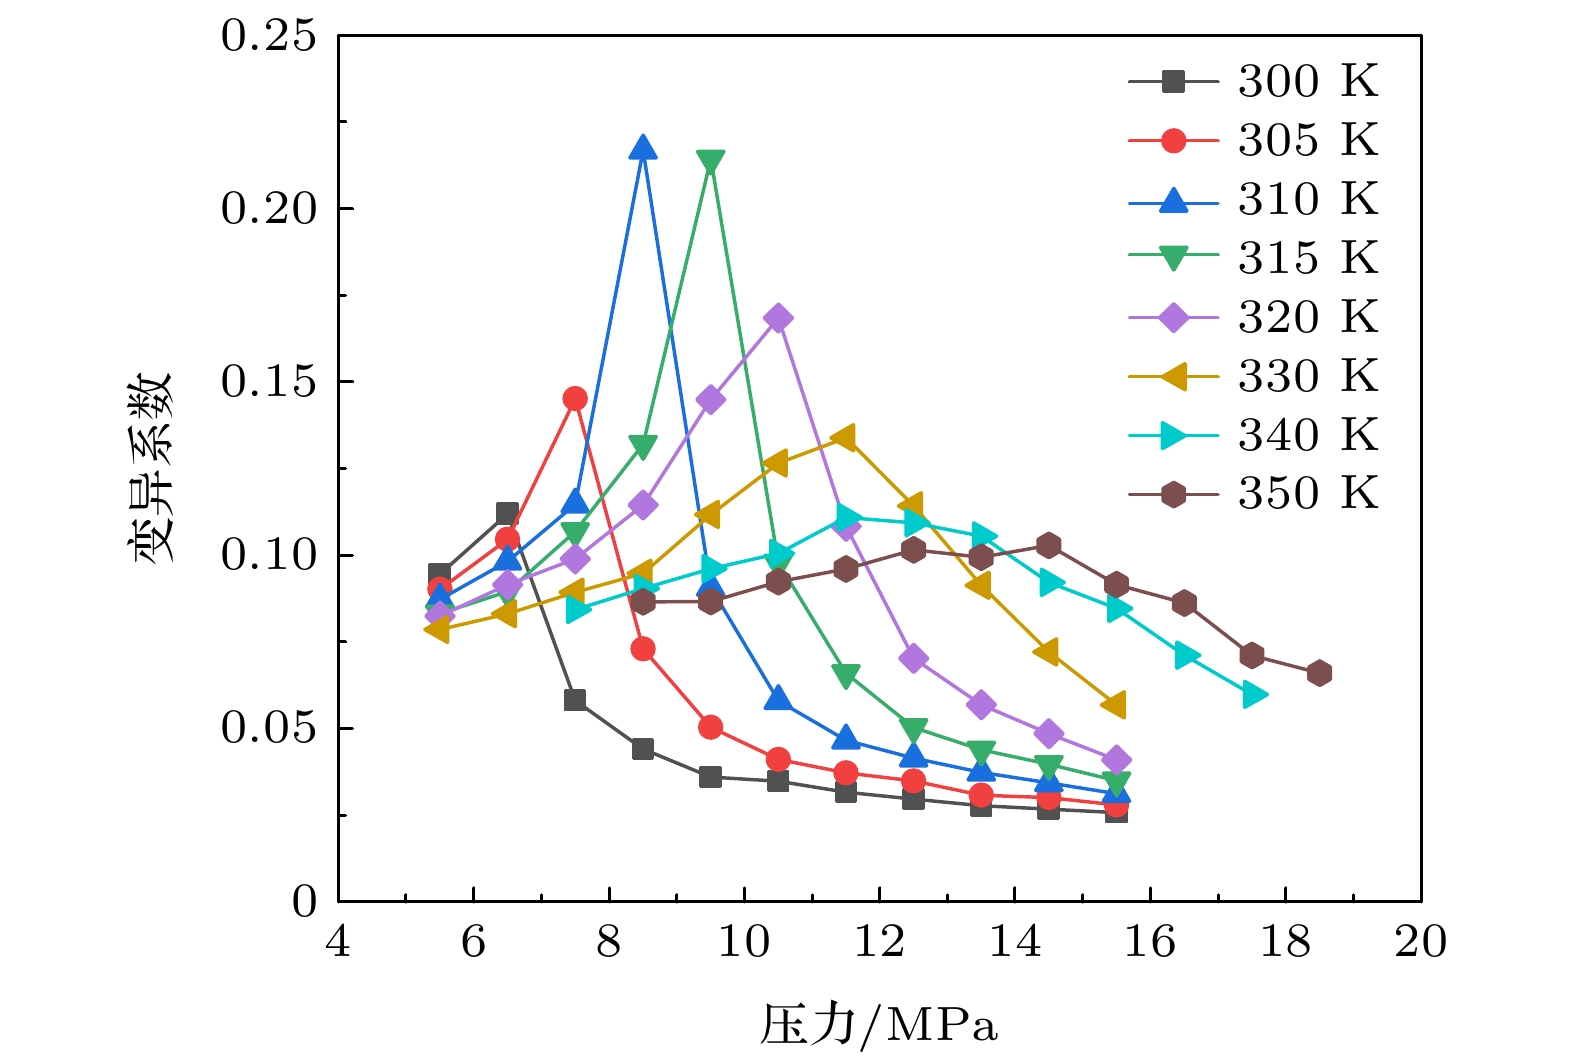
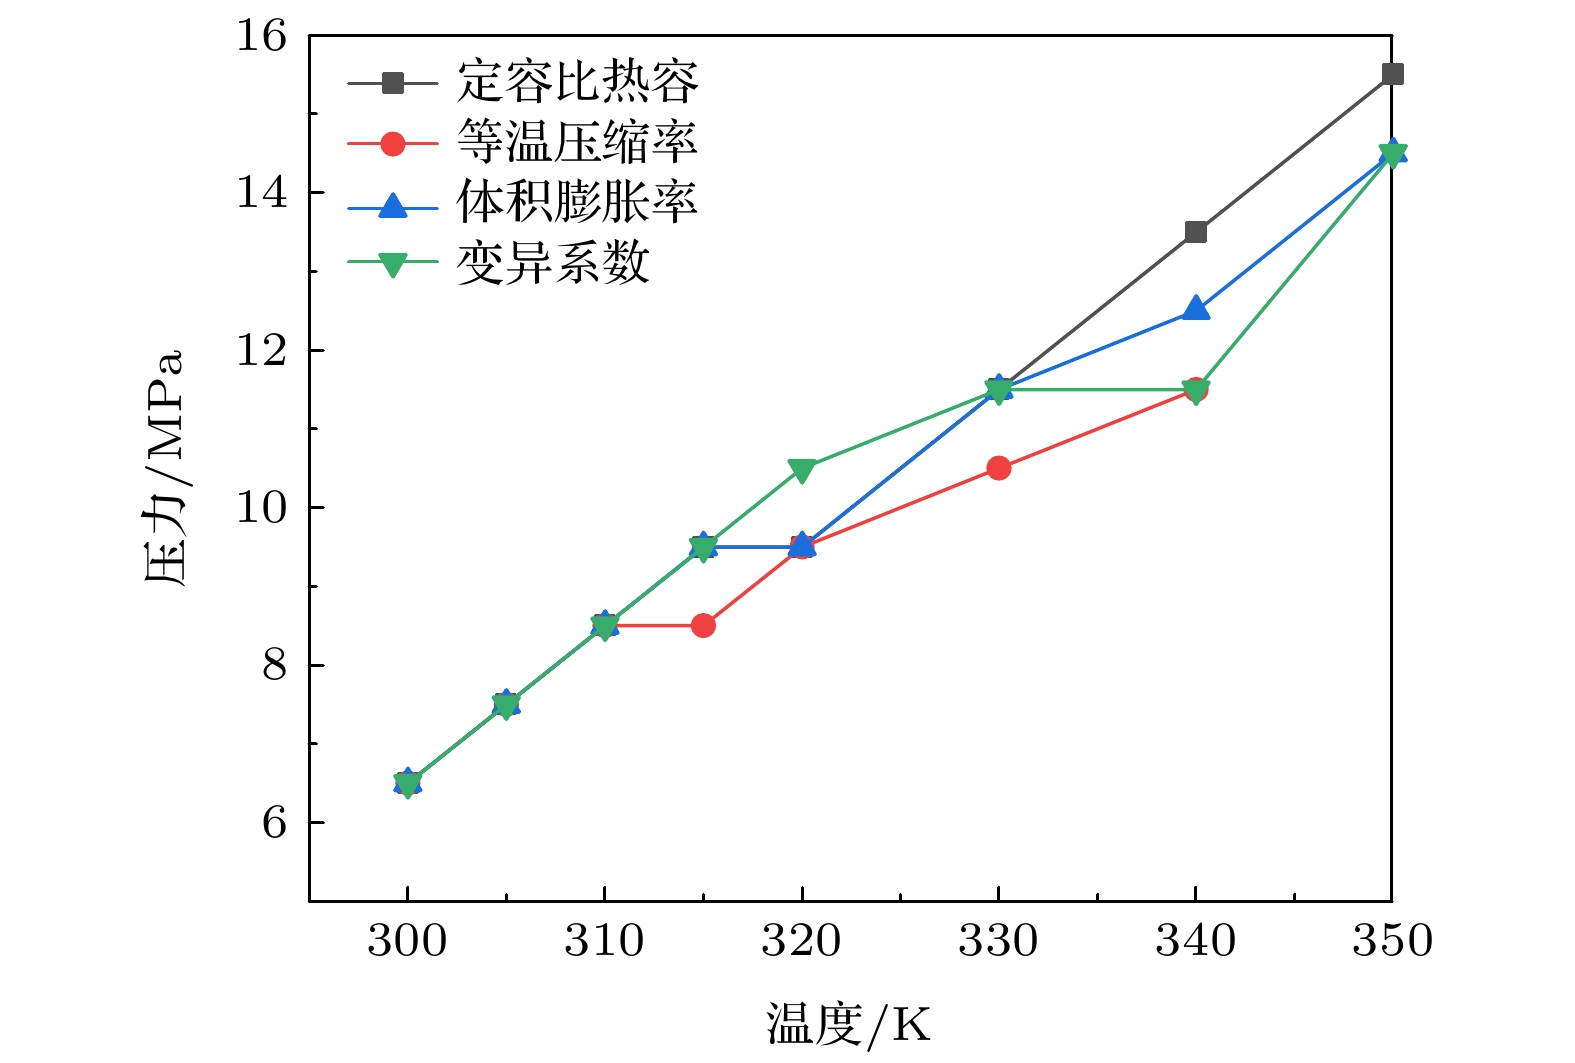
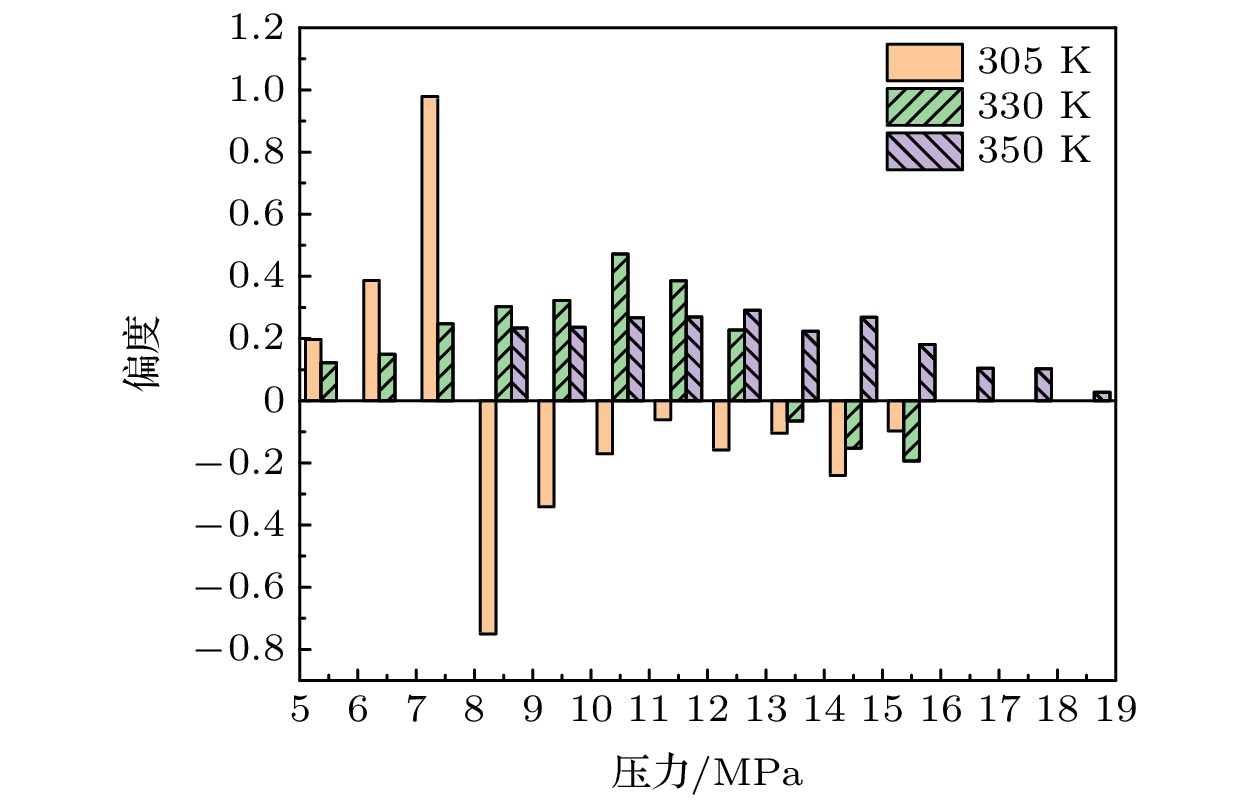
超临界二氧化碳(S-CO2)因在萃取、沉淀、热力循环及化学反应等方面有着十分广阔的应用前景, 逐渐成为学术界的重要研究课题. 由于在近临界区, 可以观察到随温度或压力变化出现大量的物性异变现象, 使得各国学者对流体临界点附近区域的研究产生了浓厚兴趣. 随着分子动力学模拟技术的快速发展, 该技术可辅助传统实验方法用于研究近临界流体的相关物性. 为确定S-CO2在近临界区Widom线范围及类液-类气区的分子结构特征, 本文通过分子动力学模拟技术结合聚类分析, 研究了温度和压力范围分别在300—350 K和5.5—18.5 MPa下, CO2密度时间序列变异系数及偏度同Widom线和类液-类气区间的关系. 结果表明: S-CO2在近临界区Widom线的确定可通过连接密度时间序列曲线变异系数极大值点来确定, Widom线沿着临界点开始延伸直到350 K时停止; S-CO2类液区和类气区的分子分布结构可以用数密度分布的偏度来区分, 偏度在类气态时为正值, 在类液态时为负值, 而在Widom线上达到最大值.Supercritical carbon dioxide has gradually been becoming an important research subject in the academic field due to the fact that it has a promising application prospect in the field of extraction, precipitation, thermodynamic cycle and chemical reaction. In recent years, the interest in studying the region near the critical point was aroused and a large variation of the physical properties could be detected due to the change of temperature and pressure. The rapid development of molecular simulation technology benefits the traditional experimental methods to study the variations of relevant physical properties in the near-critical region. In order to find out the Widom line range of supercritical carbon dioxide in the near-critical region and the molecular structure characteristics of the liquid-like gas region, both the molecular dynamics simulation technology and the cluster analysis are used to investigate the relation between variation coefficient and skewness of CO2 density time series with Widom line and liquid-gas-like interval, under the condition of the temperature and pressure range of 300–350 K and 5.5–18.5 MPa, respectively. The results show that the Widom line of supercritical carbon dioxide in the near-critical region can be determined by connecting the maximum coefficient of variation of the density time series curve. The Widom line begins to extend along with the critical point until it stops at 350 K. The molecular distribution structure of supercritical carbon dioxide liquid-like region and gas-like region can be differentiated by the skewness of the number density distributions. The skewness is positive in the gas-like region, but negative in the liquid-like region, and reaches the maximum at the Widom line.
[1] Bolmatov D, Brazhkin V V, Trachenko K 2013 Nat. Commun. 4 2331
 Google Scholar
[2] Mecheri M, Moullec Y L 2016 Energy 103 758
Google Scholar
[3] Stanley H E, Ahlers G 1973 Phys. Today 26 71
[4] Lee J, Cho S K, Cha J E, Lee J I 2016 ASME Turbo Expo 2016: Turbomachinery Technical Conference and Exposition
[5] Clarke D D, Vasquez V R, Whiting W B, Greiner M 2001 Appl. Therm. Eng. 21 993
Google Scholar
[6] Xu L, Kumar P, Buldyrev S V, Chen S H, Poole P H, Sciortino F, Stanley H E 2005 Proc. Natl. Acad. Sci. U. S. A. 102 46
[7] Nishikawa K, Tanaka I, Amemiya Y 1996 J. Phys. Chem. 100 418
Google Scholar
[8] Nishikawa K, Morita T 1997 J. Chem. Phys. 101 1413
Google Scholar
[9] Nishikawa K, Kusano K, Arai A A, Morita T 2003 J. Chem. Phys. 118 1341
Google Scholar
[10] Simeoni G, Bryk T, Gorelli F, Krisch M, Ruocco G, Santoro M, Scopigno T 2010 Nat. Phys. 6 503
Google Scholar
[11] Brazhkin V V, Fomin Y D, Lyapin A G, Ryzhov V N, Tsiok E N 2011 J. Phys. Chem. B 115 14112
Google Scholar
[12] Sedunov B 2012 Am. J. Anal. Chem. 3 899
Google Scholar
[13] Bolmatov D, Zhernenkov M, Zav’yalov D, Tkachev S N, Cunsolo A, Cai Y Q 2015 Sci. Rep. 5 15850
Google Scholar
[14] Mareev E, Aleshkevich V, Potemkin F, Bagratashvili V, Minaev N, Gordienko V 2018 Opt. Express 26 13229
Google Scholar
[15] Mareev E I, Aleshkevich V A, Potemkin F V, Minaev N V, Gordienko V M 2019 Sverhkriticheskie Flyuidy: Teoriya i Praktika 14 89
Google Scholar
[16] 孙辉, 章立新, 杨其国, 高明, 刘婧楠 2020 热力发电 49 59
Sun H, Zhang L X, Yang Q G, Gao M, Liu J N 2020 Thermal Power Generation 49 59
[17] 孙辉, 章立新, 杨其国, 刘婧楠, 高明 2021 动力工程学报 41 426
Sun H, Zhang L X, Yang Q G, Liu J N, Gao M 2021 J. Power Eng. 41 426
[18] Imre A R, Deiters U K, Kraska T, Tiselj I 2012 Nucl. Eng. Des. 252 179
Google Scholar
[19] Imre A R, Ramboz C, Deiters U K, Kraska T 2015 Environ. Earth Sci. 73 4373
Google Scholar
[20] Shinoda W, Shiga M, Mikami M 2004 Physi. Rev. B 69 134103
Google Scholar
[21] Kamberaj H, Low R J, Neal M P 2005 J. Chem. Phys. 122 1055
[22] Aimoli C G, Maginn E J, Abreu C R A 2014 Fluid Phase Equilibria 368 80
Google Scholar
[23] Xu J, Liu C, Sun E, Xie J, Liu J 2019 Energy 186 115831
Google Scholar
[24] Stubbs J M 2016 J. Supercrit. Fluids 108 104
Google Scholar
[25] Chen L, Wang S Y, Tao W Q 2019 Energy 179 1094
Google Scholar
[26] Kuznetsova T, Kvamme B 2002 Energy Convers. Manage. 43 2601
Google Scholar
[27] Harris J G, Yung K H 1995 J. Phys. Chem. 99 12021
Google Scholar
[28] Linstrom P J, Mallard W G 2001 Nat. Inst. Stand. Technol.
[29] 叶仁道, 刘干, 薛洁 2016 统计学 (西安: 西安电子科技大学出版社) 第83页
Ye R D, Liu G, Xue J 2016 Statistica (Xi’an: Xidian University Press) p83 (in Chinese)
-

图 3 不同温度下CO2的定压比热
Fig. 3. Specific heat of CO2 under constant pressure at different temperatures.
表 1 EPM2力场[27]模型参数
Table 1. Force field model parameter.
参数 化学键 εij/(kJ·mol–1) C—C 0.2335 εij/(kJ·mol–1) O—O 0.6690 σij/Å C—C 2.7570 σij/Å O—O 3.0330 $ {r}_{0} $/Å C—O 1.149 q/e C +0.6512 q/e O –0.3256 θ0/(°) — 180.0  下载: 导出CSV
表 2 密度时间序列标准差
Table 2. Density time series standard deviation.
标准差 压力/MPa 300 K 305 K 310 K 315 K 320 K 330 K 340 K 350 K 5.5 0.013109 0.011901 0.01103 0.010102 0.009666 0.008618 — — 6.5 0.021126 0.018254 0.016068 0.01389 0.013573 0.011374 — 7.5 0.044269* 0.035315 0.024742 0.021213 0.018383 0.015038 0.02127 — 8.5 0.034966 0.052095* 0.069753* 0.034734 0.026997 0.019459 0.026351 0.026077 9.5 0.029418 0.038274 0.060415 0.089464* 0.045076 0.02814 0.034613 0.031747 10.5 0.028961 0.032362 0.041841 0.061074 0.076358* 0.039398 0.040408 0.035494 11.5 0.026782 0.030041 0.035246 0.045652 0.063877 0.052485 0.045546 0.041854 12.5 0.025495 0.028665 0.032302 0.036694 0.046283 0.055389* 0.045615 0.041477 13.5 0.024154 0.025742 0.02983 0.033077 0.039802 0.051153 0.046138* 0.042967* 14.5 0.023595 0.025523 0.0279 0.030757 0.035307 0.044592 0.042004 0.038225 15.5 0.022976 0.024029 0.025872 0.027699 0.030845 0.037294 0.037411 0.037828 *上标表示标准差最大值.
下载: 导出CSV
表 3 密度时间序列曲线偏度
Table 3. Skewness of density time series curve.
偏度 压力/MPa 300 K 305 K 310 K 315 K 320 K 330 K 340 K 350 K 5.5 0.210666 0.19667 0.222613 0.199038 0.177194 0.122592 — — 6.5 0.317677 0.387051 0.331934 0.171015 0.203137 0.149934 — — 7.5 –0.58527 0.978992 0.539219 0.271725 0.196513 0.247196 0.331706 — 8.5 –0.35354 –0.75044 1.678176 0.55835 0.445696 0.302657 0.340462 0.269658 9.5 –0.25597 –0.34136 –0.61173 0.571848 0.76617 0.322709 0.42415 0.291239 10.5 –0.21121 –0.17076 –0.31933 –0.39196 0.31758 0.471969 0.332677 0.223912 11.5 –0.18831 –0.06063 –0.36301 –0.41968 –0.27132 0.386004 0.199494 0.269035 12.5 –0.07006 –0.15883 –0.14411 –0.15565 –0.27415 0.227356 –0.03969 0.180661 13.5 –0.09053 –0.1045 –0.1583 –0.15022 –0.20128 –0.06513 0.000758 0.104961 14.5 –0.11188 –0.24015 –0.18414 –0.20055 –0.16249 –0.153 –0.03519 0.102933 15.5 –0.16482 –0.09686 –0.16086 –0.07727 –0.0917 –0.19393 –0.00103 0.02764
下载: 导出CSV
-
[1] Bolmatov D, Brazhkin V V, Trachenko K 2013 Nat. Commun. 4 2331
Google Scholar
[2] Mecheri M, Moullec Y L 2016 Energy 103 758
Google Scholar
[3] Stanley H E, Ahlers G 1973 Phys. Today 26 71
[4] Lee J, Cho S K, Cha J E, Lee J I 2016 ASME Turbo Expo 2016: Turbomachinery Technical Conference and Exposition
[5] Clarke D D, Vasquez V R, Whiting W B, Greiner M 2001 Appl. Therm. Eng. 21 993
Google Scholar
[6] Xu L, Kumar P, Buldyrev S V, Chen S H, Poole P H, Sciortino F, Stanley H E 2005 Proc. Natl. Acad. Sci. U. S. A. 102 46
[7] Nishikawa K, Tanaka I, Amemiya Y 1996 J. Phys. Chem. 100 418
Google Scholar
[8] Nishikawa K, Morita T 1997 J. Chem. Phys. 101 1413
Google Scholar
[9] Nishikawa K, Kusano K, Arai A A, Morita T 2003 J. Chem. Phys. 118 1341
Google Scholar
[10] Simeoni G, Bryk T, Gorelli F, Krisch M, Ruocco G, Santoro M, Scopigno T 2010 Nat. Phys. 6 503
Google Scholar
[11] Brazhkin V V, Fomin Y D, Lyapin A G, Ryzhov V N, Tsiok E N 2011 J. Phys. Chem. B 115 14112
Google Scholar
[12] Sedunov B 2012 Am. J. Anal. Chem. 3 899
Google Scholar
[13] Bolmatov D, Zhernenkov M, Zav’yalov D, Tkachev S N, Cunsolo A, Cai Y Q 2015 Sci. Rep. 5 15850
Google Scholar
[14] Mareev E, Aleshkevich V, Potemkin F, Bagratashvili V, Minaev N, Gordienko V 2018 Opt. Express 26 13229
Google Scholar
[15] Mareev E I, Aleshkevich V A, Potemkin F V, Minaev N V, Gordienko V M 2019 Sverhkriticheskie Flyuidy: Teoriya i Praktika 14 89
Google Scholar
[16] 孙辉, 章立新, 杨其国, 高明, 刘婧楠 2020 热力发电 49 59
Sun H, Zhang L X, Yang Q G, Gao M, Liu J N 2020 Thermal Power Generation 49 59
[17] 孙辉, 章立新, 杨其国, 刘婧楠, 高明 2021 动力工程学报 41 426
Sun H, Zhang L X, Yang Q G, Liu J N, Gao M 2021 J. Power Eng. 41 426
[18] Imre A R, Deiters U K, Kraska T, Tiselj I 2012 Nucl. Eng. Des. 252 179
Google Scholar
[19] Imre A R, Ramboz C, Deiters U K, Kraska T 2015 Environ. Earth Sci. 73 4373
Google Scholar
[20] Shinoda W, Shiga M, Mikami M 2004 Physi. Rev. B 69 134103
Google Scholar
[21] Kamberaj H, Low R J, Neal M P 2005 J. Chem. Phys. 122 1055
[22] Aimoli C G, Maginn E J, Abreu C R A 2014 Fluid Phase Equilibria 368 80
Google Scholar
[23] Xu J, Liu C, Sun E, Xie J, Liu J 2019 Energy 186 115831
Google Scholar
[24] Stubbs J M 2016 J. Supercrit. Fluids 108 104
Google Scholar
[25] Chen L, Wang S Y, Tao W Q 2019 Energy 179 1094
Google Scholar
[26] Kuznetsova T, Kvamme B 2002 Energy Convers. Manage. 43 2601
Google Scholar
[27] Harris J G, Yung K H 1995 J. Phys. Chem. 99 12021
Google Scholar
[28] Linstrom P J, Mallard W G 2001 Nat. Inst. Stand. Technol.
[29] 叶仁道, 刘干, 薛洁 2016 统计学 (西安: 西安电子科技大学出版社) 第83页
Ye R D, Liu G, Xue J 2016 Statistica (Xi’an: Xidian University Press) p83 (in Chinese)


 下载:
下载:


计量
- 文章访问数: 12717
- PDF下载量: 222
- 被引次数: 0
