


-
精密测量囚禁在光晶格里面中性原子间相互作用导致的密度频移在研究多体相互作用和实现高性能光晶格钟等方面有着重要应用. 本文利用基于原位成像的同步频率比对技术对光晶格钟的密度频移系数进行了准确的测量. 光晶格里面的原子被一束钟激光同时激发, 并通过原位成像技术同时且独立地探测光晶格里11个不相关区域的钟跃迁概率. 由于不相关区域里的原子被同时激发, 即共模抑制了钟激光的噪声, 因此它们间的频率比对稳定度超越了Dick噪声的限制, 并与原子探测噪声极限相符合. 得益于光晶格里非均匀的原子数分布和可以忽略的外场梯度, 不相关区域间的频率比对结果即为密度频移. 通过测量密度频移和格点平均原子数差的关系, 获得密度频移系数为–0.101(3) Hz/(atom·site), 经过103 s的测量时间, 系统平均密度频移的相对测量不确定度达到了1.5 × 10⁻¹⁷.Precision measurement of the density shift caused by the interaction among neutral atoms trapped in an optical lattice has important applications in the study of multi-body interaction and the realization of high-performance optical lattice clocks. The common methods of measuring the density are the self-comparison technique and frequency comparison between two optical lattice clocks. Both methods are based on the identical density shift coefficient and should interrelatedly operate the clock at high- and low-density state, respectively. The precision of self-comparison method is limited by the Dick effect. The synchronous frequency comparison between two optical lattice clocks can realize the precision beyond the Dick limit. However, both methods can only obtain the average density shift and ignore the fact that the magnitude of the density shift is different over the lattice sites as inhomogeneous density distribution in the lattice. In this paper, the synchronous frequency comparison technique based on in situ imaging is used to accurately measure the density shift coefficient of optical lattice clock. Atoms in the optical lattice are simultaneously and independently excited by the same clock laser beam, and the clock transition probability of 11 uncorrelated regions of the optical lattice is simultaneously detected by in situ imaging. Thus, the clock laser noise, which is the root cause of the Dick effect, is common-mode rejected as the frequency difference between uncorrelated regions is measured by the clock transition spectrum. Beyond the Dick-noise-limited stability, the stability of synchronous frequency comparison between uncorrelated regions is consistent with the limit resulting from the atom detection noise. Between the center and margin of the lattice, the differential shifts of the black-body radiation shift, lattice AC Stark shift, probe Stark shift, DC Stark shift, and quadratic Zeeman shift are all below 5 × 10⁻⁶ Hz, which is three orders of magnitude smaller than the density shift and can be ignored in this experiment. Benefitting from the inhomogeneous distribution of atom number and negligible external field gradient in the optical lattice, the compared frequency shift between uncorrelated regions indicates the density shift. By measuring the relationship between the density shift and atom difference, the density shift coefficient is determined as –0.101(3) Hz/atom/site (with a measurement time of 103 s), and the fractional measurement uncertainty of the mean density shift of our system is 1.5 × 10⁻¹⁷.
[1] Schäfer F, Fukuhara T, Sugawa S, Takasu Y, Takahashi Y 2020 Nat. Rev. Phys. 2 411
 Google Scholar
[2] McGrew W F, Zhang X, Fasano R J, Schäffer S A, Beloy K, Nicolodi D, Brown R C, Hinkley N, Milani G, Schioppo M, Yoon T H, Ludlow A D 2018 Nature 564 87
Google Scholar
[3] Bothwell T, Kedar D, Oelker E, Robinson J M, Bromley S L, Tew W L, Ye Jun, Kennedy C J 2019 Metrologia 56 065004
Google Scholar
[4] Ushijima I, Takamoto M, Das M, Ohkubo T, Katori H 2015 Nat. Photon. 9 185
Google Scholar
[5] Takamoto M, Ushijima I, Ohmae N, Yahagi T, Kokado K, Shinkai H, Katori H 2020 Nat. Photon. 14 411
Google Scholar
[6] Lin Y G, Wang Q, Meng F, Cao S Y, Wang Y Z, Li Y, Sun Z, Lu B K, Yang T, Lin B K, Zhang A M, Fang F, Fang Z J 2021 Metrologia 58 035010
Google Scholar
[7] Liu H, Zhang X, Jiang K L, Wang J Q, Zhu Q, Xiong Z X, He L X, Lü B L. 2017 Chin. Phys. Lett. 34 20601
Google Scholar
[8] Luo L M, Qiao H, Ai D, Zhou M, Zhang S, Zhang S, Sun C Y, Qi Q C, Peng C Q, Jin T Y, Fang W, Yang Z Q, Li T C, Liang K, Xu X Y 2020 Metrologia 57 065017
Google Scholar
[9] Takano T, Takamoto M, Ushijima I, Ohmae N, Akatsuka T, Yamaguchi A, Kuroishi Y, Munekane H, Miyahara B, Katori H 2016 Nat. Photon. 10 662
Google Scholar
[10] Lemke N D, Stecher J V, Sherman J A, Rey A M, Oates C W, Ludlow A D 2011 Phys. Rev. Lett. 107 103902
Google Scholar
[11] Rey A M, Gorshkov A V, Kraus C V 2014 Ann. Phys. 340 311
Google Scholar
[12] Sang K L, Chang Y P, Won-Kyu L, Dai-Hyuk Y 2016 New J. Phys. 18 033030
Google Scholar
[13] Zhang X, Bishof M, Bromley S L, Kraus C V, Safronova M S, Zoller P, Rey A M, Ye J 2014 Science 345 1467
Google Scholar
[14] Goban A, Hutson R B, Marti G E, Campbell S L, Perlin M A, Julienne P S, Incao J P D, Rey A M, Ye J 2018 Nature 563 369
Google Scholar
[15] Zhou C H, Lu X T, Lu B Q, Wang Y B, Chang H 2021 Appl. Sci. 11 1206
Google Scholar
[16] Wang Q, Lin Y G, Meng F 2016 Chin. Phys. Lett. 33 103201
Google Scholar
[17] Nicholson T L, Martin M J, Williams J R, Bloom B J, Bishof M M, Swallows D, Campbell S L, Ye J 2012 Phys. Rev. Lett. 109 230801
Google Scholar
[18] Al-Masoudi A, Dörscher S, Häfner S, Sterr U, Lisdat C 2015 Phys. Rev. A 92 063814
Google Scholar
[19] Marti G E, Hutson R B, Goban A, Campbell S L, Poli N, Ye J 2018 Phys. Rev. Lett. 120 103201
Google Scholar
[20] Bothwell T, Kennedy C J, Aeppli A, Kedar D, Robinson J M, Oelker E, Staron A, Ye J 2022 Nature 602 420
Google Scholar
[21] Katori H, Takamoto M 2003 Phys. Rev. Lett. 91 173005
Google Scholar
[22] Xia J J, Lu X T, Chang H 2022 Chin. Phys. B 31 034209
Google Scholar
[23] Nagourney W, Sandberg I, Dehmelt H 1986 Phys. Rev. Lett. 56 2797
Google Scholar
[24] Schioppo M, Brown R C, McGrew W F, Hinkley N, Fasano R J, Beloy K, Yoon T H, Milani G, Nicolodi D, Sherman J A, Phillips N B, Oates C W, Ludlow A D 2017 Nat. Photon. 11 48
Google Scholar
[25] Takamoto M, Takano T, Katori H 2011 Nat. Photon. 5 288
Google Scholar
[26] Blatt S, Thomsen J W, Campbell G K, Ludlow A D, Swallows M D, Martin M J, Boyd M M, Ye J 2009 Phys. Rev. A 80 052703
Google Scholar
[27] Lodewyck J, Zawada M, Lorini L, Gurov M, Lemonde P 2012 IEEE Trans. Ultrason. Ferroelectr. Freq. Control 59 411
Google Scholar
[28] Xu Q F, Lu X T, Xia J J, Wang Y B, Chang H 2021 Appl. Phys. Lett. 119 101105
Google Scholar
-
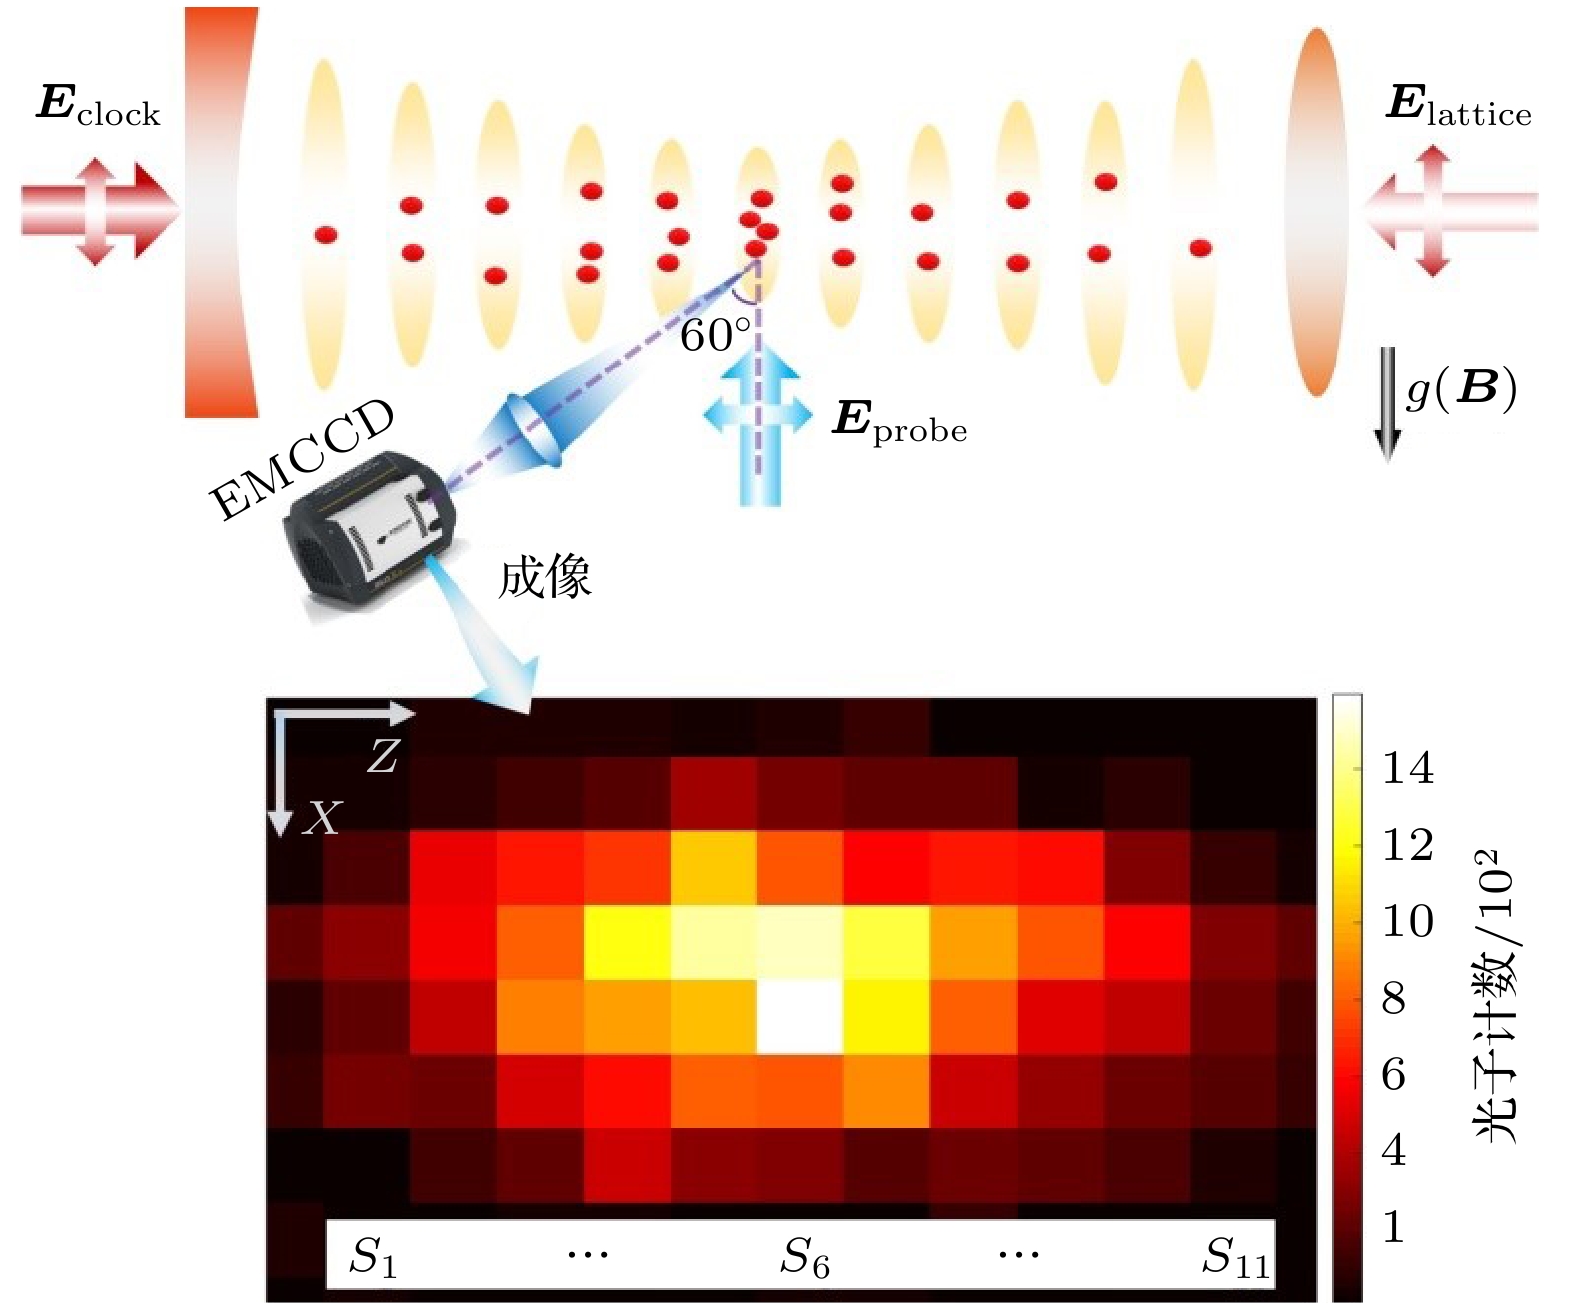
图 1 实验装置. 晶格光(Elattice)沿水平方向入射, 平行于钟激光(Eclock)且垂直于重力和磁场B方向. 电子倍增电荷耦合器件(EMCCD, Andor-897U)用于对光晶格进行原位成像, 其探测方向与探测光(Eprobe)的夹角为60°. 本实验仅使用下图所示的8(行) × 11(列)的像素区域, 这11列从左到右分别被标记为S1—S11. 图片中标注的z轴平行于晶格光和钟激光, x轴平行于重力方向
Fig. 1. Experimental system. The lattice light (Elattice) is incident horizontally, overlapped with the clock laser (Eclock) and perpendicular to the direction of the gravity and magnetic field B. The probe light (Eprobe) is incident horizontally and perpendicular to the lattice light. An electron multiplier charge-coupled device (EMCCD, ANDOR-897U) is used for in situ imaging of the optical lattice, and the angle between the detection direction and the probe light is 60°. This experiment only considers the imaging region of 8 (row) × 11 (column) as shown in the bottom figure. These 11 columns are labeled by S1–S11 from left to right, respectively. The labeled z-axis is parallel to the lattice light and clock laser, and the x-axis is parallel to the gravity direction
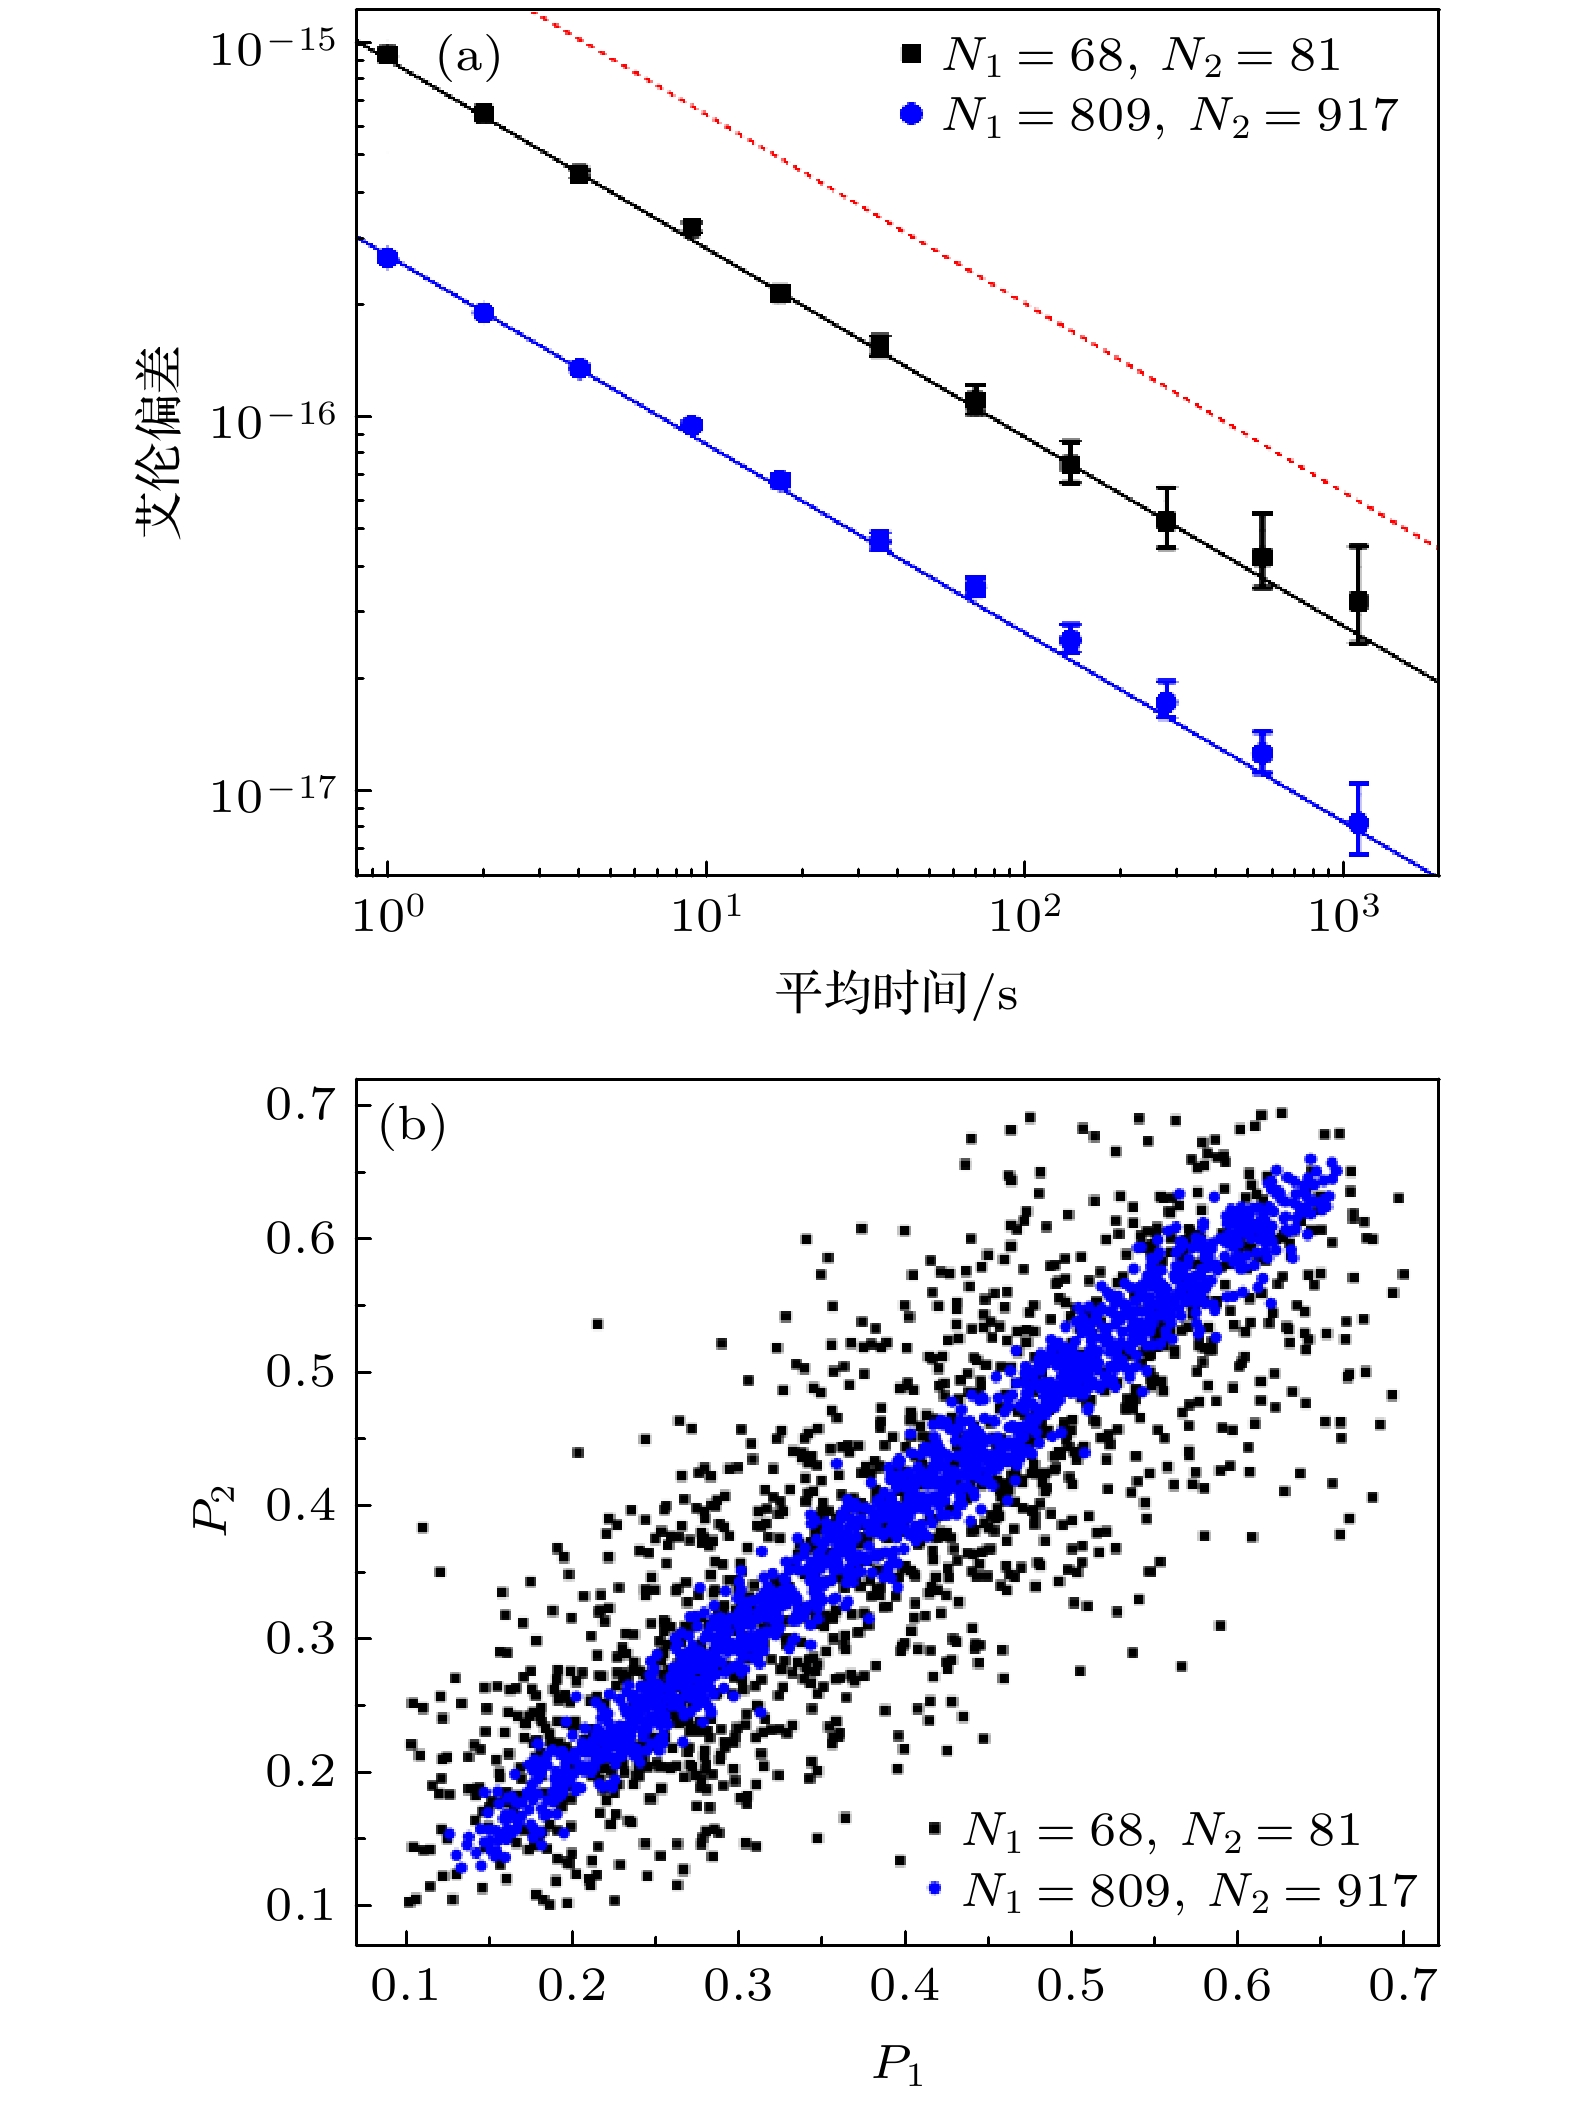
图 2 (a) 基于原位成像的同步频率比对稳定度. 黑色方点表示S1 (原子数N1 = 68)和S11(N2 = 81)间的同步频率比对稳定度(8.9 × 10⁻¹⁶ (τ/s)–0.5), 而蓝色圆点表示S1—S5 (N1 = 809)和S7—S11 (N2 = 917)两个不同区域间的同步频率对比稳定度(2.7 × 10⁻¹⁶ (τ/s)–0.5). 实线表示根据(1)式计算得到的探测噪声限制的稳定度, 红色虚线表示Dick噪声限制的稳定度(2 × 10–15 (τ/s)–0.5). 误差棒表示测量结果的1σ标准差. (b) 对应(a)图中频率比对区域的激发率散点图. P1和P2分别表示两个独立区域S1 (或S1—S5)和S11 (或S7—S11)的激发率
Fig. 2. (a) Stabilities of the in situ synchronous frequency comparison. The black squares indicate the stability of the synchronous frequency comparison between S1 (atom number N1 = 68) and S11 (N2 = 81) (8.9 × 10⁻¹⁶ (τ/s)–0.5), and the blue dots are the stability (2.7 × 10⁻¹⁶ (τ/s)–0.5) of the synchronous frequency comparison between S1–S5 (N1 = 809) and S7–S11 (N2 = 917). The solid lines are the detection-noise-limited stability calculated by Eq. (1), and the red dotted line represents the Dick-noise-limited stability (2 × 10–15 (τ/s)–0.5). Error bars indicate 1 standard deviation. (b) Scatter plots of excitation fractions of the compared regions shown in (a). P1 and P2 represent the excitation fraction of S1 (or S1–S5) and S11 (or S7–S11), respectively.

图 3 密度频移测量 (a) S1, S6和S11区域的边带可分辨的钟跃迁谱线; (b) 原子数分布; (c) 密度频移与格点平均原子数差的关系. 红色实线为线性拟合(固定与y轴的截距为零), 橙色区域为拟合线的68%置信区间. 误差棒表示测量值的1σ标准差
Fig. 3. Measurements of density shift: (a) Sideband-resolved clock transition spectra obtained in S1, S6 and S11, respectively; (b) the distribution of the number of atoms; (c) density shift as a function of atom number difference (∆N). Red solid line shows the linear fitting (the intercept with the y-axis is fixed as zero), and the orange shade corresponds to 68% confidence intervals of the fitting line. Error bars indicate 1 standard deviation.
-
[1] Schäfer F, Fukuhara T, Sugawa S, Takasu Y, Takahashi Y 2020 Nat. Rev. Phys. 2 411
Google Scholar
[2] McGrew W F, Zhang X, Fasano R J, Schäffer S A, Beloy K, Nicolodi D, Brown R C, Hinkley N, Milani G, Schioppo M, Yoon T H, Ludlow A D 2018 Nature 564 87
Google Scholar
[3] Bothwell T, Kedar D, Oelker E, Robinson J M, Bromley S L, Tew W L, Ye Jun, Kennedy C J 2019 Metrologia 56 065004
Google Scholar
[4] Ushijima I, Takamoto M, Das M, Ohkubo T, Katori H 2015 Nat. Photon. 9 185
Google Scholar
[5] Takamoto M, Ushijima I, Ohmae N, Yahagi T, Kokado K, Shinkai H, Katori H 2020 Nat. Photon. 14 411
Google Scholar
[6] Lin Y G, Wang Q, Meng F, Cao S Y, Wang Y Z, Li Y, Sun Z, Lu B K, Yang T, Lin B K, Zhang A M, Fang F, Fang Z J 2021 Metrologia 58 035010
Google Scholar
[7] Liu H, Zhang X, Jiang K L, Wang J Q, Zhu Q, Xiong Z X, He L X, Lü B L. 2017 Chin. Phys. Lett. 34 20601
Google Scholar
[8] Luo L M, Qiao H, Ai D, Zhou M, Zhang S, Zhang S, Sun C Y, Qi Q C, Peng C Q, Jin T Y, Fang W, Yang Z Q, Li T C, Liang K, Xu X Y 2020 Metrologia 57 065017
Google Scholar
[9] Takano T, Takamoto M, Ushijima I, Ohmae N, Akatsuka T, Yamaguchi A, Kuroishi Y, Munekane H, Miyahara B, Katori H 2016 Nat. Photon. 10 662
Google Scholar
[10] Lemke N D, Stecher J V, Sherman J A, Rey A M, Oates C W, Ludlow A D 2011 Phys. Rev. Lett. 107 103902
Google Scholar
[11] Rey A M, Gorshkov A V, Kraus C V 2014 Ann. Phys. 340 311
Google Scholar
[12] Sang K L, Chang Y P, Won-Kyu L, Dai-Hyuk Y 2016 New J. Phys. 18 033030
Google Scholar
[13] Zhang X, Bishof M, Bromley S L, Kraus C V, Safronova M S, Zoller P, Rey A M, Ye J 2014 Science 345 1467
Google Scholar
[14] Goban A, Hutson R B, Marti G E, Campbell S L, Perlin M A, Julienne P S, Incao J P D, Rey A M, Ye J 2018 Nature 563 369
Google Scholar
[15] Zhou C H, Lu X T, Lu B Q, Wang Y B, Chang H 2021 Appl. Sci. 11 1206
Google Scholar
[16] Wang Q, Lin Y G, Meng F 2016 Chin. Phys. Lett. 33 103201
Google Scholar
[17] Nicholson T L, Martin M J, Williams J R, Bloom B J, Bishof M M, Swallows D, Campbell S L, Ye J 2012 Phys. Rev. Lett. 109 230801
Google Scholar
[18] Al-Masoudi A, Dörscher S, Häfner S, Sterr U, Lisdat C 2015 Phys. Rev. A 92 063814
Google Scholar
[19] Marti G E, Hutson R B, Goban A, Campbell S L, Poli N, Ye J 2018 Phys. Rev. Lett. 120 103201
Google Scholar
[20] Bothwell T, Kennedy C J, Aeppli A, Kedar D, Robinson J M, Oelker E, Staron A, Ye J 2022 Nature 602 420
Google Scholar
[21] Katori H, Takamoto M 2003 Phys. Rev. Lett. 91 173005
Google Scholar
[22] Xia J J, Lu X T, Chang H 2022 Chin. Phys. B 31 034209
Google Scholar
[23] Nagourney W, Sandberg I, Dehmelt H 1986 Phys. Rev. Lett. 56 2797
Google Scholar
[24] Schioppo M, Brown R C, McGrew W F, Hinkley N, Fasano R J, Beloy K, Yoon T H, Milani G, Nicolodi D, Sherman J A, Phillips N B, Oates C W, Ludlow A D 2017 Nat. Photon. 11 48
Google Scholar
[25] Takamoto M, Takano T, Katori H 2011 Nat. Photon. 5 288
Google Scholar
[26] Blatt S, Thomsen J W, Campbell G K, Ludlow A D, Swallows M D, Martin M J, Boyd M M, Ye J 2009 Phys. Rev. A 80 052703
Google Scholar
[27] Lodewyck J, Zawada M, Lorini L, Gurov M, Lemonde P 2012 IEEE Trans. Ultrason. Ferroelectr. Freq. Control 59 411
Google Scholar
[28] Xu Q F, Lu X T, Xia J J, Wang Y B, Chang H 2021 Appl. Phys. Lett. 119 101105
Google Scholar

 下载:
下载:
计量
- 文章访问数: 7479
- PDF下载量: 64
- 被引次数: 0
