


-
当两个次临界振荡场在空间上发生交叠时, 可以高效促进真空中正负电子对的产生. 本研究旨在探究两场在交叠方向上的间距变化对电子对产生的影响. 模拟结果显示, 随着间距的增大, 产率逐渐降低. 通过对不同频率组合的比较, 还发现空间分离时产率的变化快慢与频率组合密切相关. 此外, 在间距变化时, 电子能谱结构的变化也表现出不同的特征. 通过结合粒子跃迁能量分布概率对能谱图的结构进行了详细分析, 发现高阶跃迁概率随距离增加的衰减速度大于低阶跃迁. 此外, 随着间距的增大, 两个组合场共同作用的多光子效应逐渐减弱, 而单个场通过多光子效应产生正负电子对的概率则逐渐增强. 上述结果和规律均得到了很好的解释, 它帮助我们更深入地理解空间局域化对电子对产生的影响, 并对实验设计提供一定的指导.This work investigates the combination of two partially overlapping oscillating fields, aiming to analyze the effect of the separation distance between the fields on the production of electron-positron pairs in a vacuum. The process is simulated using computational quantum field theory (CQFT) method and the split-operator technique, which is based on the spacetime-dependent Dirac equation. The main focus is to analyze the influence of separation distance and frequency combination on the pairwise production rate and energy spectrum.The research results show that partially overlapping sub-critical oscillating fields can still effectively generate electron-positron pairs at small separation distances. The variation in separation distance along the overlapping direction significantly affects the pairwise production rate. For two oscillating fields with a fixed sum of frequencies, the separation distance has a notable effect on the pairwise production rate, with different frequency combinations exhibiting varying degrees of dependency.Further analysis of the energy spectrum reveals that the number and positions of spectral peaks are differently affected by the separation distance. Models with smaller frequency differences exhibit more concentrated energy distributions, generally presenting a single-peak structure. In contrast, models with larger frequency differences show more dispersed energy distributions, typically presenting a dual-peak structure. As the separation distance increases, the energy spectrum structure varies with different frequency combinations, especially for larger separation distances. In the case of larger frequency difference, the high-energy peak declines rapidly with separation distance increasing, leading to a lower proportion of high-energy electrons, while in the case of smaller frequency difference the change is relatively small. This phenomenon is further analyzed using energy transition probability distribution diagrams of particles.By analyzing the probability distribution diagrams of particle energy transitions, we obtain a preliminary understanding of the differences in various frequency combinations with respect to separation distance, and explain the changes in energy spectrum structure from the perspective of multiphoton transitions. Additionally, a more detailed analysis of these diagrams based on the law of conservation of energy, enables us to extract particle production trends corresponding to various multiphoton transition effects. It is found that for the same frequency combination, the trends of second- and third-order effects with varying separation distances are different, with higher-order effects decaying more rapidly.By analyzing the variation of probability of multiphoton transitions in a combined field with separation distance, as well as the variation of the probability of multiphoton transitions in a single field, we conclude that when the separation distance is small, the combined fields with larger frequency differences have advantages in the generation of electron-positron pair. However, when the separation distance is large, the combined fields with smaller frequency differences begin to play an important role and exhibit better stability, owing to their inherent multiphoton effects. For different cases under the combined influence of two fields, we conduct a more in-depth analysis of the differences between different orders within the same frequency combination and between the same order transitions under different frequency combinations. By proposing hypotheses and conducting computational verification, it is found that under the same conditions, the trend of normalized overlapping photon numbers changing with separation distances is consistent with the trend of corresponding particle production numbers, providing a more convenient method for testing the trend of particle production under separation distance.This study not only enriches our understanding of the generation of vacuum electron-positron pairs in strong fields, but also provides theoretical guidance and reference for designing experimental devices for generating pairs.
[1] Schwinger J 1951 Phys. Rev. 82 664
 Google Scholar
[2] Kohlfürst C, Ahmadiniaz N, Oertel J, Schützhold R 2022 Phys. Rev. Lett. 129 241801
Google Scholar
[3] Marinov M S, Popov V S 1977 Fortschr. Phys. 25 373
Google Scholar
[4] Brezin E, Itzykson C, 1970 Phys. Rev. D 2 1191
Google Scholar
[5] Popov V S, 1971 Zh. Eksp. Teor. Fiz. 61 1334
[6] 朱兴龙, 王伟民, 余同普, 何峰, 陈民, 翁苏明, 陈黎明, 李玉同, 盛政明, 张杰 2021 物理学报 70 085202
Google Scholar
Zhu X L, Wang W M., Yu T P, He F, Chen M, Weng S M, Chen L M, Li Y T, Sheng Z M, Zhang J 2021 Acta Phys. Sin. 70 085202
Google Scholar
[7] 沈百飞, 吉亮亮, 张晓梅, 步志刚, 徐建彩 2021 物理学报 70 084101
Google Scholar
Shen B F, Ji L L, Zhang X M, Bu Z G, Xu J C 2021 Acta Phys. Sin. 70 084101
Google Scholar
[8] Kluger Y, Eisenberg J M, Svetitsky B, Cooper F, Mottola E 1991 Phys. Rev. Lett. 67 2427
Google Scholar
[9] Alkofer R., Hecht M B, Roberts C D, Schmidt S M, Vinnik D V 2001 Phys. Rev. Lett. 87 193902
Google Scholar
[10] Schmidt S, Blaschke D, Röpke G, Prozorkevich A V, Smolyansky S A, Toneev V D 1999 Phys. Rev. D 59 094005
Google Scholar
[11] Blinne A, Strobel E 2016 Phys. Rev. D 93 025014
Google Scholar
[12] Kohlfürst C, Alkofer R 2018 Phys. Rev. D 97 036026
Google Scholar
[13] Gies H, Klingmüller K 2005 Phys. Rev. D 72 065001
Google Scholar
[14] Ilderton A, Torgrimsson G, Wårdh J 2015 Phys. Rev. D 92 065001
Google Scholar
[15] Dumlu C K, Dunne G V 2011 Phys. Rev. D 83 065028
Google Scholar
[16] Dumlu C K 2010 Phys. Rev. D 82 045007
Google Scholar
[17] Krekora P, Cooley K., Su Q, Grobe R 2005 Phys. Rev. Lett. 95 070403
Google Scholar
[18] Xie B S, Li Z L, Tang S, Liu J 2017 Physics 46 713
[19] Lv Q Z, Liu Y, Li Y J, Grobe R, Su Q 2013 Phys. Rev. Lett. 111 183204
Google Scholar
[20] Bulanov S S, Mur V D, Narozhny N B, Nees J, Popov V S 2010 Phys. Rev. Lett. 104 220404
Google Scholar
[21] Di Piazza A, Müller C, Hatsagortsyan K Z, Keitel C H 2012 Rev. Mod. Phys. 84 1177
Google Scholar
[22] 罗蕙一, 江淼, 徐妙华, 李英骏 2023 72 021201
Google Scholar
Luo H Y, Jiang M, Xu M H, Li Y J 2023 Acta Phys. Sin. 72 021201
Google Scholar
[23] Braun J W, Su Q, Grobe R 1999 Phys. Rev. A 59 604
Google Scholar
[24] Wagner R E, Ware M R, Shields B T, Su Q, Grobe R 2011 Phys. Rev. Lett. 106 023601
Google Scholar
[25] Wang L, Wu B, Xie B S 2019 Phys. Rev. A 100 022127
Google Scholar
[26] Cheng T, Su Q, Grobe R 2010 Contemp. Phys. 51 315
Google Scholar
-
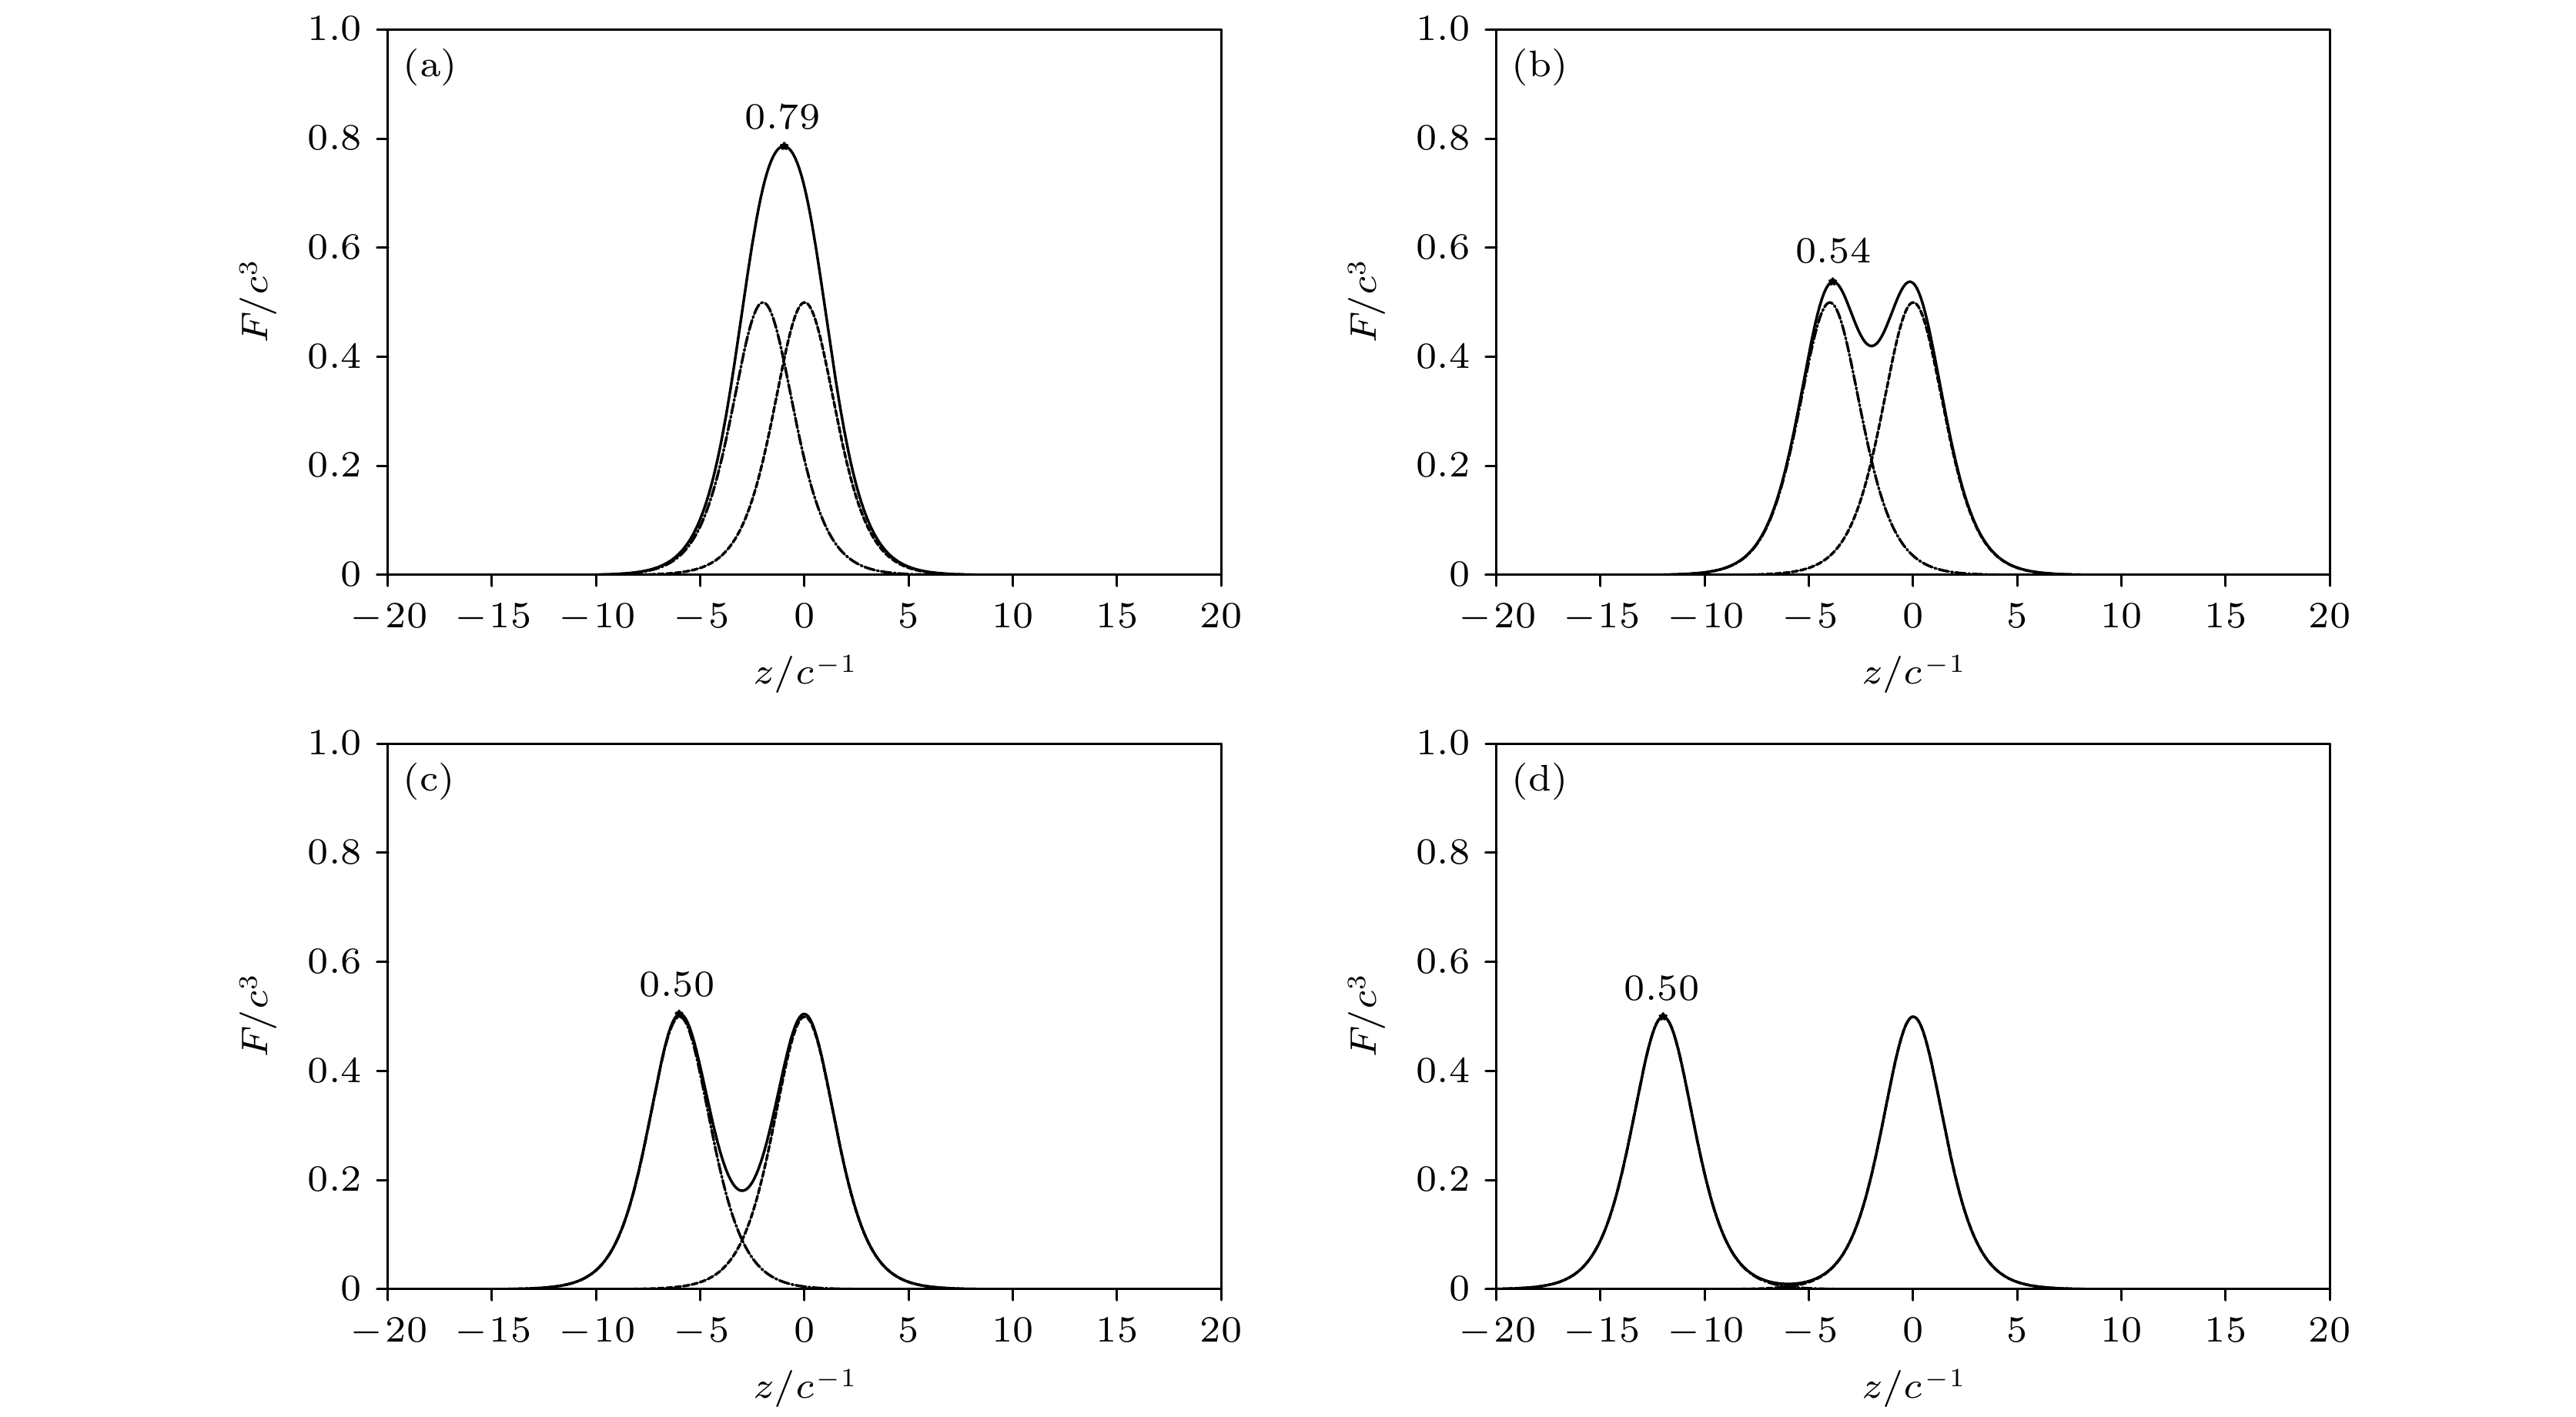
图 1 组合场分开不同间距D时的场强图象 (a)$ D = 2/c $; (b)$ D = 4/c $; (c)$ D = 6/c $; (d)$ D = 12/c $. 两场场宽均为$ W = 2/c $
Fig. 1. The field strength diagrams for combined fields separated by different distances D: (a) $ D = 2/c $; (b) $ D = 4/c $; (c) $ D = 6/c $; (d) $ D = 12/c $. The width of both fields is $ W = 2/c$.
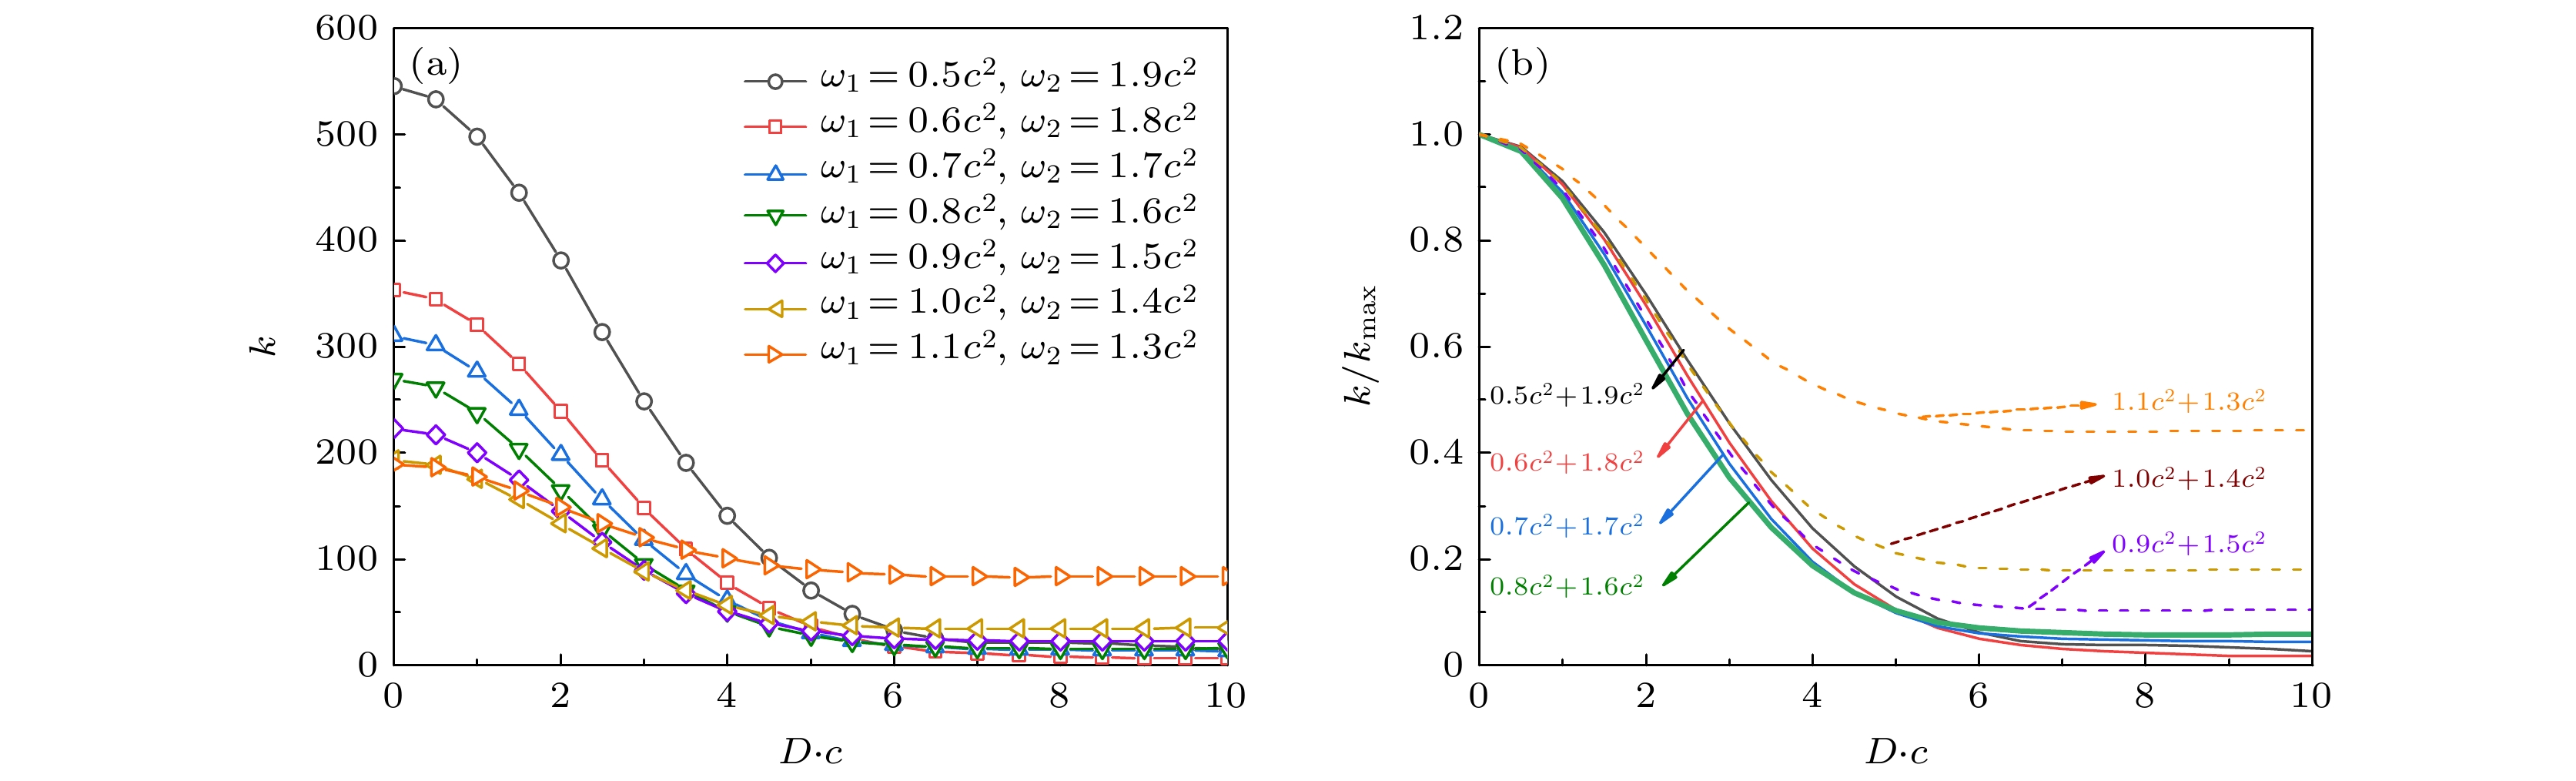
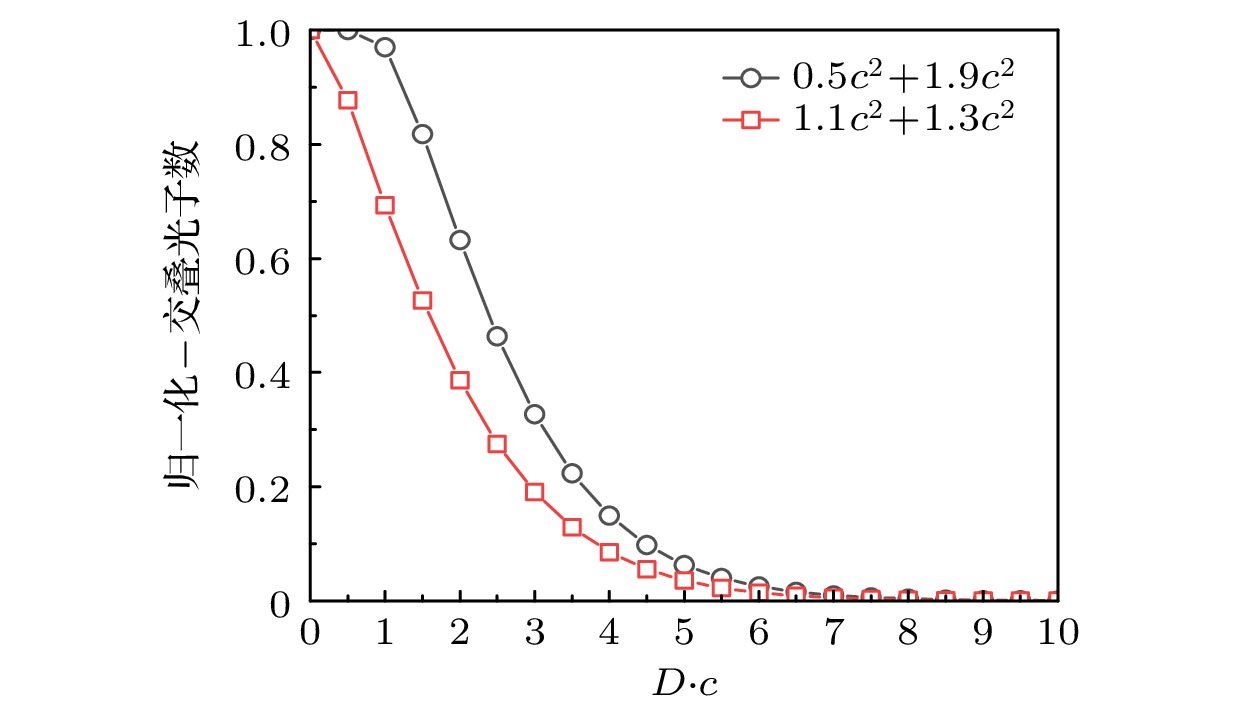
图 2 (a)产率$ {k} $随$ {D} $的变化趋势, 频率差渐变的过程中, $ {D} $从$ 0 $到$ 10/{c} $的下降趋势; (b)归一化产率$ {k/k_{{\mathrm{max}}}} $随间距$ {D} $的变化趋势
Fig. 2. (a) The trend of the electron pair production rate $ {k} $ as the frequency difference gradually changes, showing a decreasing trend of $ {D} $ from $ 0 $ to $ 10/{c} $; (b) the trend of normalized electron pair production rate $ {k/k_{{\mathrm{max}}}} $ with respect to the change in distance $ {D} $.
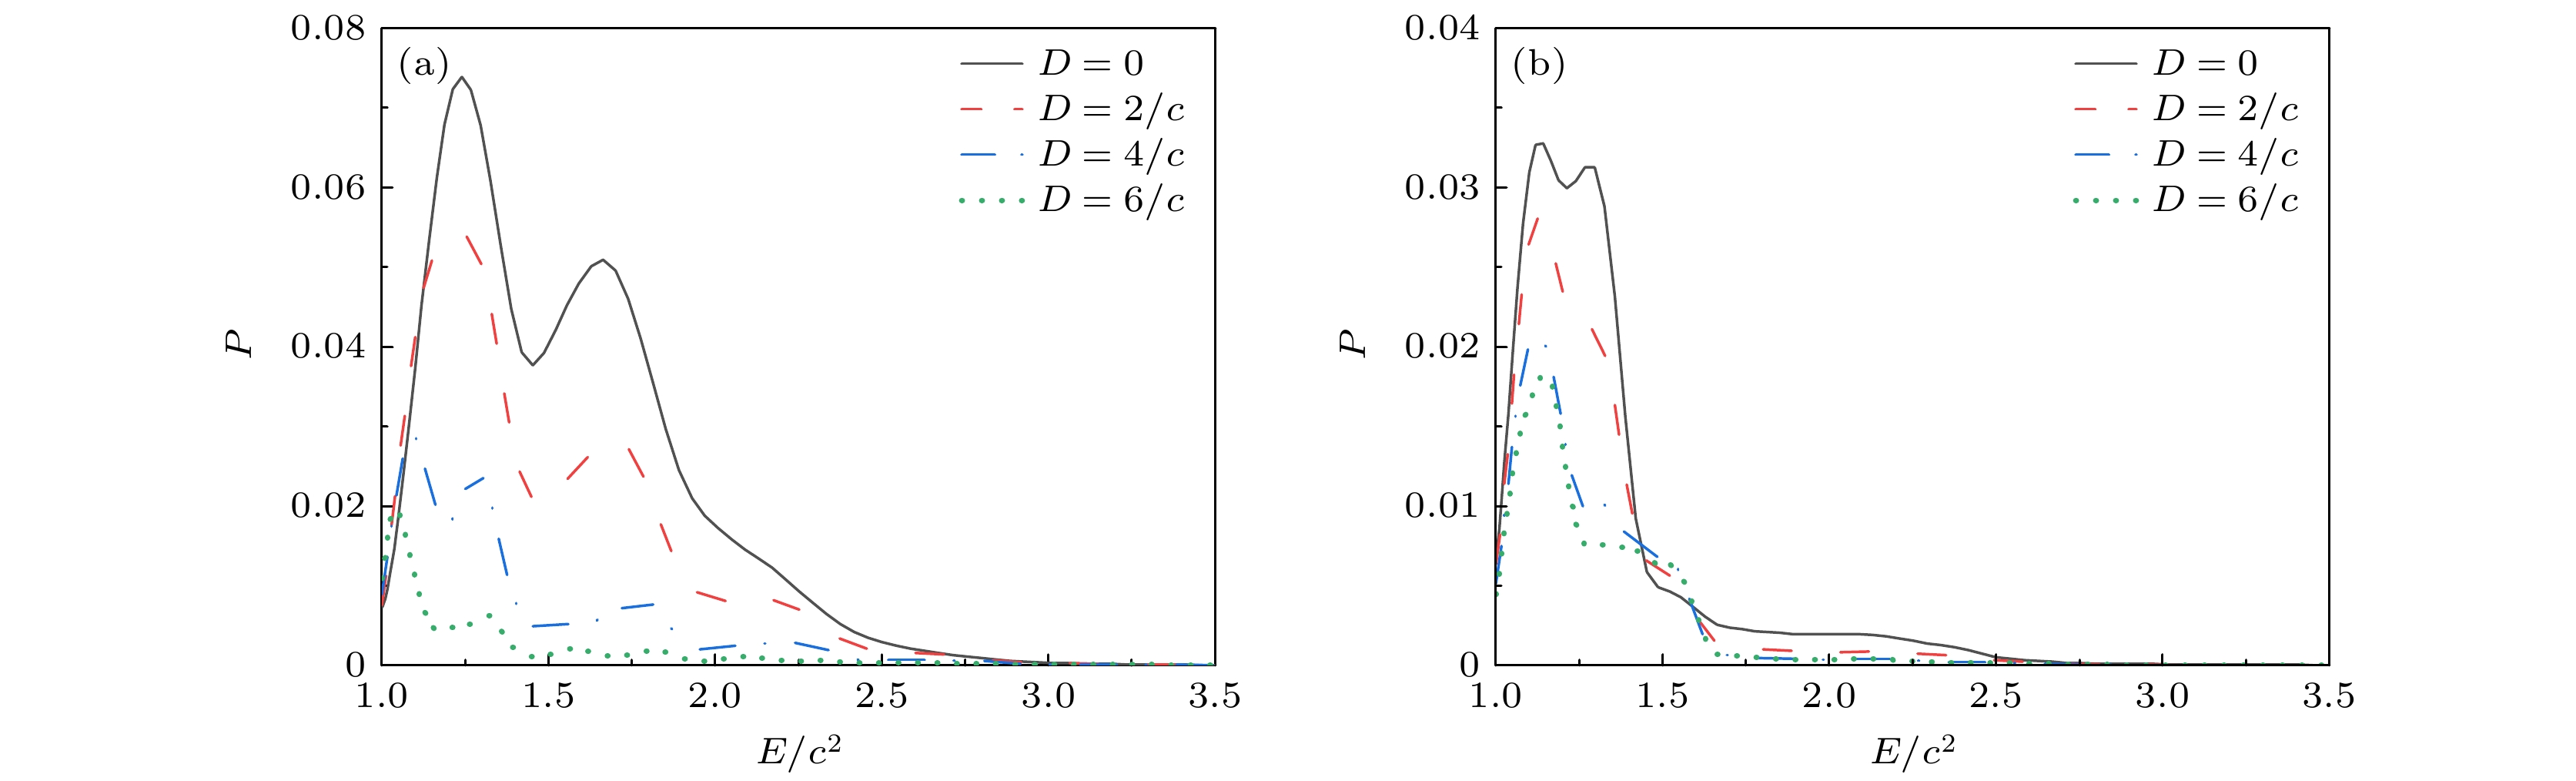
图 3 $ {\rm{(a)}}\;\omega_1 = 0.5{c}^2, \;\omega_2 = 1.9{c}^2 $时不同$ {D} $对应的产生粒子能量分布概率; $ ({\mathrm{b}})\;\omega_1 = 1.1{c}^2,\; \omega_2 = 1.3{c}^2 $时不同$ {D} $对应的产生粒子的能量分布概率. 演化时间均为$ {t} = 0.003 \; {{\mathrm{a.u.}}} $, 势高$ {{\cal{V}}_1={\cal{V}}_2 = 2.0 c^2} $, 场宽$ {W = 2/c} $
Fig. 3. $ {\rm{(a)}} $ Energy spectrum for different $ {D} $ values when $ \omega_1 = 0.5{c}^2,\; \omega_2 = 1.9{c}^2 $; $ {({\mathrm{b}})} $ energy spectrum for different $ {D} $ values when $ \omega_1 = 1.1{c}^2,\; \omega_2 = 1.3{c}^2 $. Evolution time is $ {t} = 0.003 \; {{\mathrm{a.u.}}} $ with potential heights $ {{\cal{V}}_1={\cal{V}}_2 = 2.0 c^2} $ and field width $ {W = 2/c} $

图 4 两种组合场参数下的粒子跃迁能量概率分布 (a) $ \omega_1 = 0.5\, c^2 $和$ \omega_2 = 1.9\, c^2 $; (b) $ \omega_1 = 1.1\, c^2 $和$ \omega_2 = 1.3\, c^2 $. 其中子图$ {\rm{(a1)}}\rightarrow {\rm{(a4)}} $和$ {\rm{(b1)}}\rightarrow {\rm{(b4)}} $分别对应空间参数D从$ 0 $到$ 6/c $的变化. 场宽为$ W_1 = W_2 = 2/c $, 势场高度为$ {\cal{V}}_1 = {\cal{V}}_2 = 2.0\, c^2 $
Fig. 4. Particle transition energy probability distribution for combined fields: (a) $ \omega_1 = 0.5\, c^2 $ and $ \omega_2 = 1.9\, c^2 $; (b) $ \omega_1 = 1.1\, c^2 $ and $ \omega_2 = 1.3\, c^2 $. The subfigures $ {\rm{(a1)}}\rightarrow {\rm{(a4)}} $ and $ {\rm{(b1)}}\rightarrow {\rm{(b4)}} $ correspond to the spatial parameter D varying from $ 0 $ to $ 6/c $, respectively. The field widths are $ W_1 = W_2 = 2/c $, and the potential heights are $ {\cal{V}}_1 = {\cal{V}}_2 = 2.0\, c^2 $.
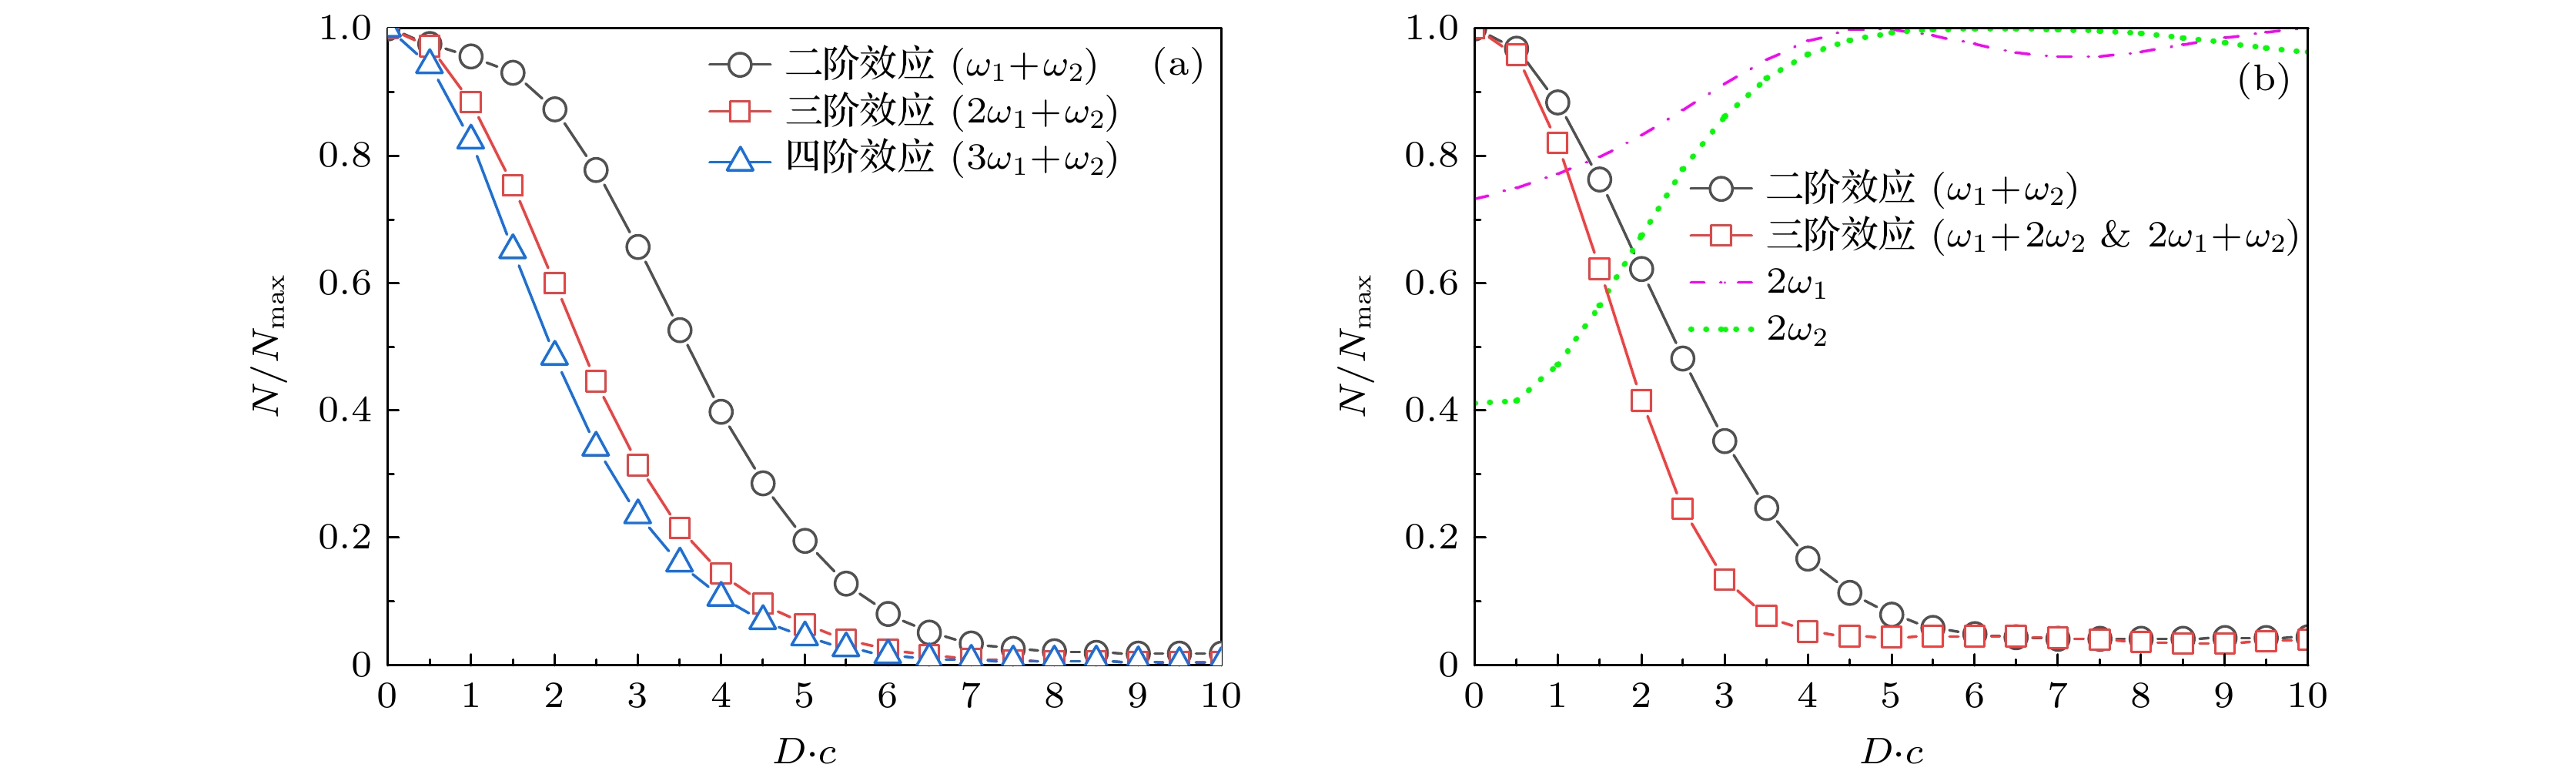
图 5 (a) $ \omega_1 = 0.5{c}^2, \;\omega_2 = 1.9{c}^2 $, (b) $ \omega_1 = 1.1{c}^2,\; \omega_2 = 1.3{c}^2 $条件下各阶多光子跃迁效应对应的归一化粒子数对比, 纵轴为归一化粒子数, 演化时长$ {(t = 0.003 \; {\mathrm{a.u.}} )} $, 不同的线条样式代表不同的跃迁阶级
Fig. 5. (a) $ \omega_1 = 0.5{c}^2,\; \omega_2 = 1.9{c}^2 $, (b) $ \omega_1 = 1.1{c}^2, \;\omega_2 = 1.3{c}^2 $, under these conditions, the normalized particle numbers corresponding to various order multiphoton transition effects are compared. The vertical axis represents the normalized particle numbers, and different line styles represent different transition orders, with an evolution time of $ {(t = 0.003 \; {\mathrm{a.u.}} )} $.
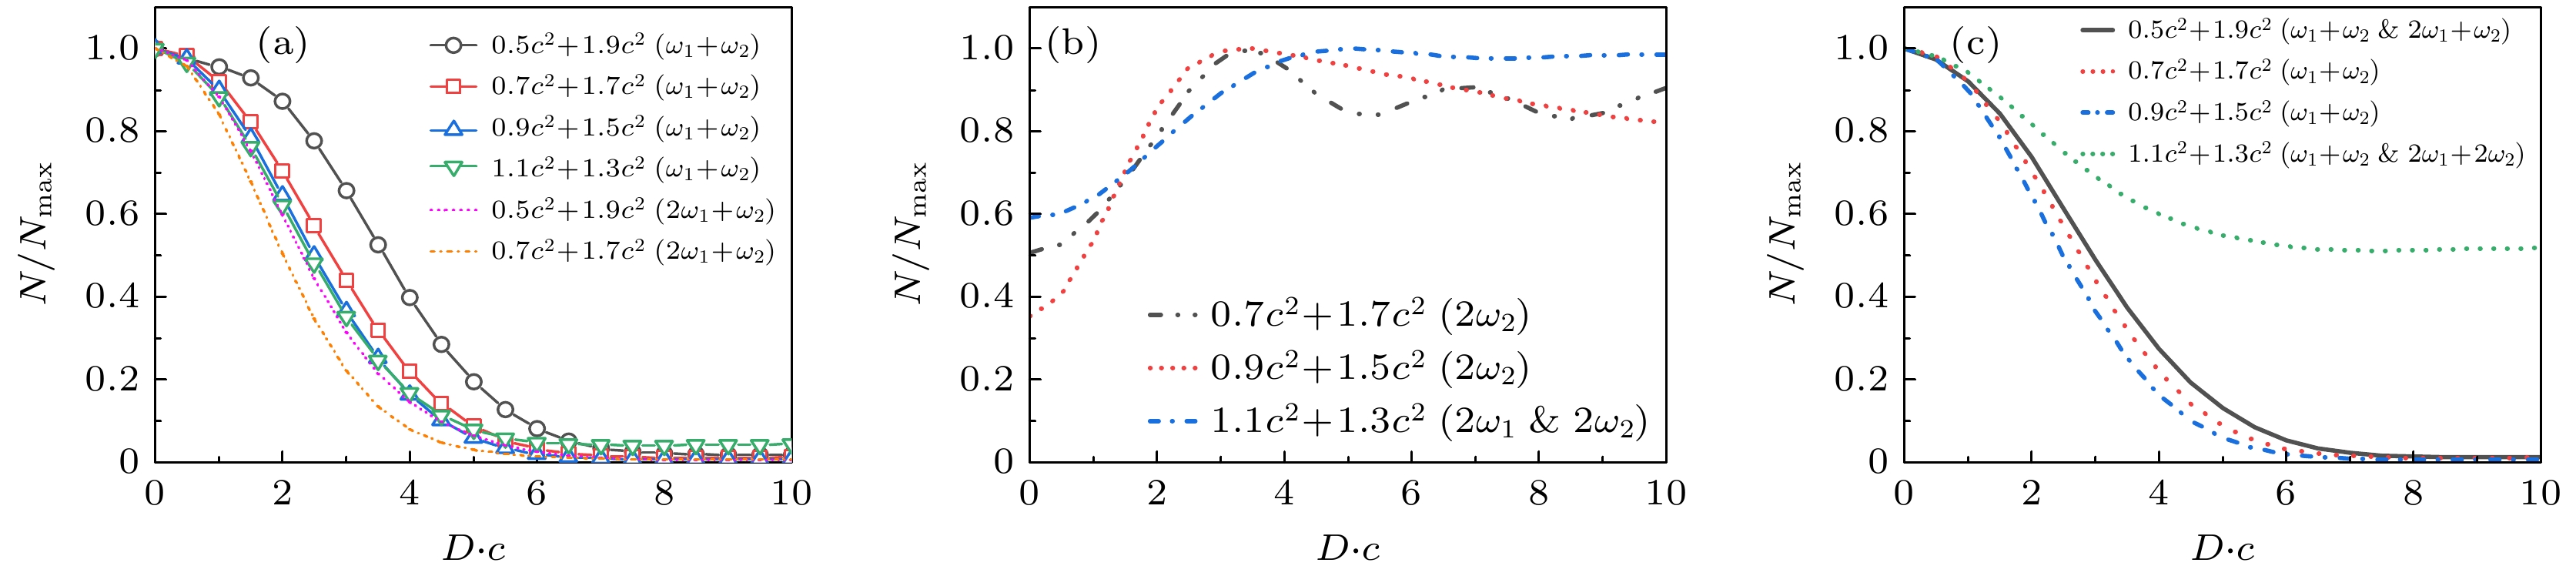
图 6 不同频率组合的低阶跃迁效应随间距变化趋势对比 (a)组合场二阶以及部分三阶跃迁效应粒子数; (b)独立场的二阶以及部分三阶跃迁效应粒子数; (c)各阶主要成分相加的粒子数比较, 且进行了归一化处理
Fig. 6. Comparison of trends in low-order transition effects with varying separation distances for different frequency combinations: (a) Particle numbers for second-order and partial third-order transition effects of combined fields; (b) particle numbers for second-order and partial third-order transition effects of independent fields; (c) comparison of particle numbers for the main components of each order, with normalization applied.
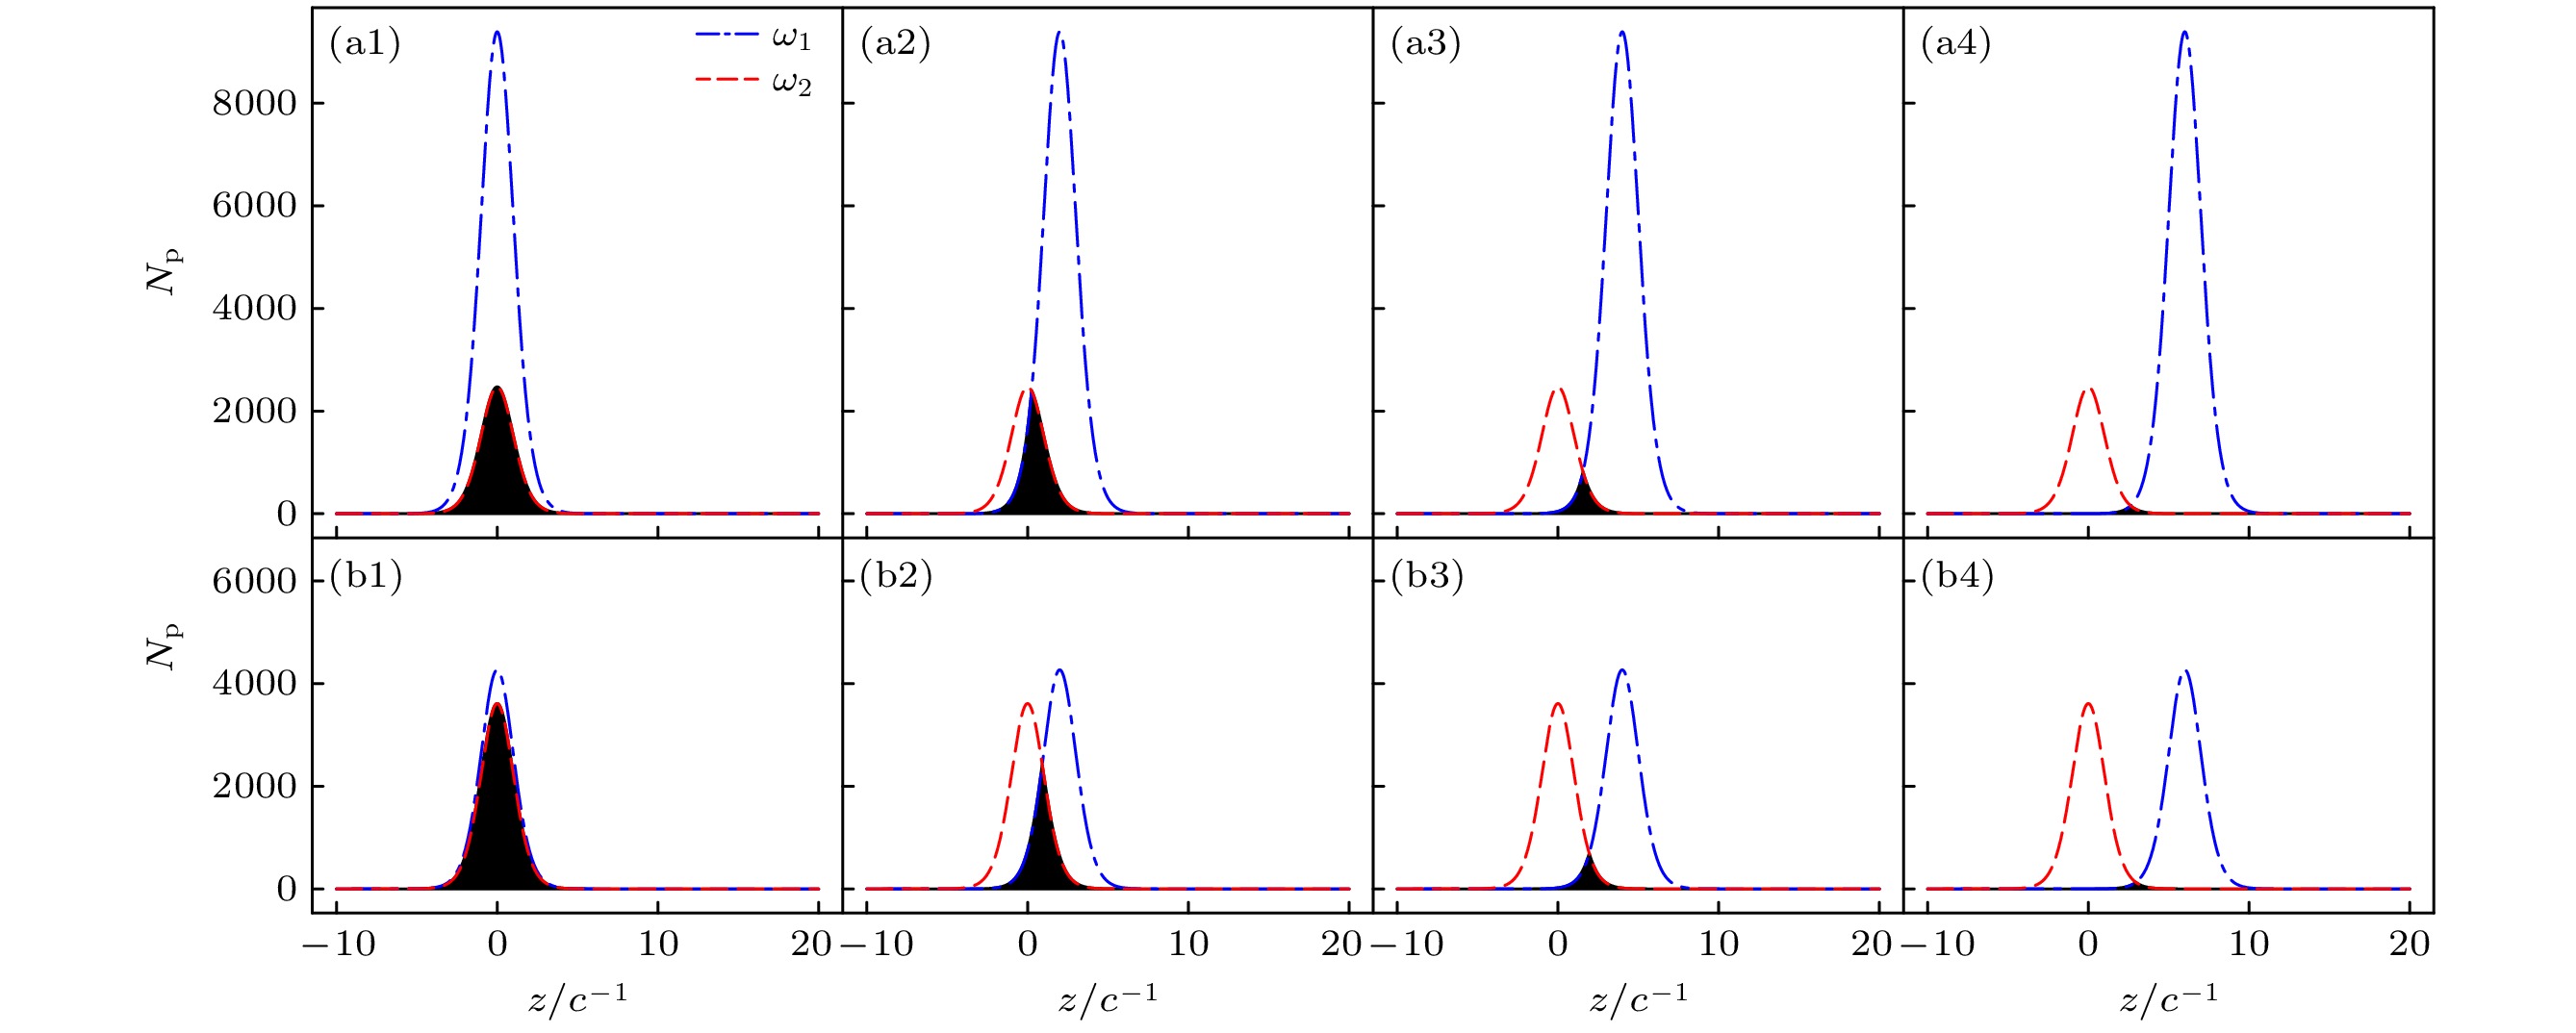
图 7 频率组合$ {\rm{(a1)}}\text{—}{\mathrm{(a4)}} $ $ 0.5{c}^2+1.9{c}^2 $和$ {\rm{(b1)}}\text{—}{\mathrm{(b4)}} $ $ 1.1{c}^2+1.3{c}^2 $下的交叠光子数随间距$ {D} $的变化. 子图的角标(1, 2, 3, 4)分别对应间距$ {D} $的值为$ {0} $, $ {2/c} $, $ {4/c} $, $ {6/c} $. 场宽$ W = 2/c $, 势高$ {\cal{V}} = 2 c^2 $
Fig. 7. Variation of overlapping photon numbers with distance $ {D} $ under frequency combinations of (a1)–(a4) $ 0.5{c}^2+1.9{c}^2 $ and (b1)–(b4) $ 1.1{c}^2+1.3{c}^2 $. The subscripts of the subplots (1, 2, 3, 4) correspond to distance $ {D} $ values of $ {0} $, $ {2/c} $, $ {4/c} $, and $ {6/c} $ respectively. Field width $ W = 2/c $, potential height $ {\cal{V}} = 2 c^2 $.
-
[1] Schwinger J 1951 Phys. Rev. 82 664
Google Scholar
[2] Kohlfürst C, Ahmadiniaz N, Oertel J, Schützhold R 2022 Phys. Rev. Lett. 129 241801
Google Scholar
[3] Marinov M S, Popov V S 1977 Fortschr. Phys. 25 373
Google Scholar
[4] Brezin E, Itzykson C, 1970 Phys. Rev. D 2 1191
Google Scholar
[5] Popov V S, 1971 Zh. Eksp. Teor. Fiz. 61 1334
[6] 朱兴龙, 王伟民, 余同普, 何峰, 陈民, 翁苏明, 陈黎明, 李玉同, 盛政明, 张杰 2021 物理学报 70 085202
Google Scholar
Zhu X L, Wang W M., Yu T P, He F, Chen M, Weng S M, Chen L M, Li Y T, Sheng Z M, Zhang J 2021 Acta Phys. Sin. 70 085202
Google Scholar
[7] 沈百飞, 吉亮亮, 张晓梅, 步志刚, 徐建彩 2021 物理学报 70 084101
Google Scholar
Shen B F, Ji L L, Zhang X M, Bu Z G, Xu J C 2021 Acta Phys. Sin. 70 084101
Google Scholar
[8] Kluger Y, Eisenberg J M, Svetitsky B, Cooper F, Mottola E 1991 Phys. Rev. Lett. 67 2427
Google Scholar
[9] Alkofer R., Hecht M B, Roberts C D, Schmidt S M, Vinnik D V 2001 Phys. Rev. Lett. 87 193902
Google Scholar
[10] Schmidt S, Blaschke D, Röpke G, Prozorkevich A V, Smolyansky S A, Toneev V D 1999 Phys. Rev. D 59 094005
Google Scholar
[11] Blinne A, Strobel E 2016 Phys. Rev. D 93 025014
Google Scholar
[12] Kohlfürst C, Alkofer R 2018 Phys. Rev. D 97 036026
Google Scholar
[13] Gies H, Klingmüller K 2005 Phys. Rev. D 72 065001
Google Scholar
[14] Ilderton A, Torgrimsson G, Wårdh J 2015 Phys. Rev. D 92 065001
Google Scholar
[15] Dumlu C K, Dunne G V 2011 Phys. Rev. D 83 065028
Google Scholar
[16] Dumlu C K 2010 Phys. Rev. D 82 045007
Google Scholar
[17] Krekora P, Cooley K., Su Q, Grobe R 2005 Phys. Rev. Lett. 95 070403
Google Scholar
[18] Xie B S, Li Z L, Tang S, Liu J 2017 Physics 46 713
[19] Lv Q Z, Liu Y, Li Y J, Grobe R, Su Q 2013 Phys. Rev. Lett. 111 183204
Google Scholar
[20] Bulanov S S, Mur V D, Narozhny N B, Nees J, Popov V S 2010 Phys. Rev. Lett. 104 220404
Google Scholar
[21] Di Piazza A, Müller C, Hatsagortsyan K Z, Keitel C H 2012 Rev. Mod. Phys. 84 1177
Google Scholar
[22] 罗蕙一, 江淼, 徐妙华, 李英骏 2023 72 021201
Google Scholar
Luo H Y, Jiang M, Xu M H, Li Y J 2023 Acta Phys. Sin. 72 021201
Google Scholar
[23] Braun J W, Su Q, Grobe R 1999 Phys. Rev. A 59 604
Google Scholar
[24] Wagner R E, Ware M R, Shields B T, Su Q, Grobe R 2011 Phys. Rev. Lett. 106 023601
Google Scholar
[25] Wang L, Wu B, Xie B S 2019 Phys. Rev. A 100 022127
Google Scholar
[26] Cheng T, Su Q, Grobe R 2010 Contemp. Phys. 51 315
Google Scholar

 下载:
下载:
计量
- 文章访问数: 2483
- PDF下载量: 48
- 被引次数: 0
