Loading [MathJax]/jax/output/HTML-CSS/jax.js

Search

Article

x

留言板

尊敬的读者、作者、审稿人, 关于本刊的投稿、审稿、编辑和出版的任何问题, 您可以本页添加留言。我们将尽快给您答复。谢谢您的支持!

姓名
邮箱
手机号码
标题
留言内容
验证码

In-situ high pressure polarized Raman spectroscopy of rhenium disulfide

Zhang Mao-Di Jiao Chen-Yin Wen Ting Li Jing Pei Sheng-Hai Wang Zeng-Hui Xia Juan

Zhang Mao-Di, Jiao Chen-Yin, Wen Ting, Li Jing, Pei Sheng-Hai, Wang Zeng-Hui, Xia Juan. In-situ high pressure polarized Raman spectroscopy of rhenium disulfide. Acta Phys. Sin., 2022, 71(14): 140702. doi: 10.7498/aps.71.20220053
Citation: Zhang Mao-Di, Jiao Chen-Yin, Wen Ting, Li Jing, Pei Sheng-Hai, Wang Zeng-Hui, Xia Juan. In-situ high pressure polarized Raman spectroscopy of rhenium disulfide. Acta Phys. Sin., 2022, 71(14): 140702. doi: 10.7498/aps.71.20220053

In-situ high pressure polarized Raman spectroscopy of rhenium disulfide

Zhang Mao-Di, Jiao Chen-Yin, Wen Ting, Li Jing, Pei Sheng-Hai, Wang Zeng-Hui, Xia Juan
Article Text (iFLYTEK Translation)
PDF
HTML
Get Citation
  • Pressure engineering is known as an efficient, continuous and reversible technique capable of tuning material structure, as well as its electrical, optical, and other physical properties. Raman spectroscopy is used to perform efficient and non-destructive analysis of material structure, and is compatible with the application of external tuning fields. In this work, we combine in-situ pressure engineering and polarized Raman spectroscopy to study the pressure-induced evolution of 18 Raman-active modes in ReS2 crystal. We find that the ReS2 undergoes a structural transformation from 1T' to a distorted-1T' phase at 3.04 GPa, followed by an intralayer deformation of Re4 clusters occurring at 14.24 GPa. Interlayer transitions from disordered to ordered stacking in different in-plane directions are observed at 22.08 GPa and 25.76 GPa when the laser is polarized in different directions, which reflects the pressure-enhanced in-plane anisotropy, i.e. the anisotropy of ReS2 crystal becomes more prominent under high pressure. Our findings demonstrate the effectiveness of pressure in tuning material properties, and shed light on potential applications of ReS2 crystals in anisotropic optical and optoelectronic devices.
      PACS:
      07.35.+k(High-pressure apparatus; shock tubes; diamond anvil cells)
      74.25.nd(Raman and optical spectroscopy)
      42.25.Ja(Polarization)
      87.15.Zg(Phase transitions)
      Corresponding author: Wang Zeng-Hui, zenghui.wang@uestc.edu.cn ; Xia Juan, juanxia@uestc.edu.cn
    • Funds: Project supported by the National Natural Science Foundation of China (Grant Nos. 62150052, 62004026), the National Key R&D Program of China (Grant No. 2019YFE0120300), and the Science and Technology Department of Sichuan Province, China (Grant Nos. 2021YJ0517, 21CXTD0088).

    Two-dimensional (2D) transition metal dichalcogenides (TMDs) with layered structures have attracted much attention in recent years due to their rich structural, electrical, and optical properties [1-6].In TMDs crystals, transition metal atoms ( M = Mo, W, Re) located in two layers X atom ( X = S, Se, Te), forming a stoichiometric ratio of MX Layered structure of 2.TMDs have rich crystal structures due to different atomic bonding modes, and the three common structures are hexagonal (2 H) phase, triclinic (1 T) phase and rhombus (3 R) phase.In recent years, the new member of TMDs, Re X 2( X = Se, S), due to W X 2, Mo X Other materials such as 2 have attracted much attention because of their different crystal structures and electronic properties. [7-12], a representative material system is rhenium diselenide (ReSe 2) [13] and rhenium disulfide (ReS 2) [7].This kind of Re X There is a special twist in the 2 material1 T structure, referred to as 1 Phase T' , which is similar to the highly symmetric 1 common in TMDs T or 2 H The structure is different, these 1 Crystal structures of T' symmetry often have additional in-plane metallic bonds or charge density wave States.

    The two-dimensional material system studied in this paper is ReS 2 crystal, this system has unique structural characteristics and excellent optoelectronic properties, which makes it very promising for the application of next-generation electronic and optoelectronic materials. [14,15].In particular, unlike most TMDs, the band structure changes with thickness. [16,17], ReS The 2 crystal exhibits electrical, optical and vibrational properties that are insensitive to the number of layers, such as ReS 2 is a direct band gap semiconductor from bulk to monolayer, and its photoluminescence (PL) intensity increases while its Raman intensity remains unchanged with the increase of the number of layers. [7].In addition, ReS 2 1 of low symmetry The T' triclinic crystal structure brings significant electrical, optical, and thermal in-plane anisotropy [18,19], which makes it show significant advantages in the design of atomic-thickness modulators, polarizers and thermoelectric devices.

    In ReS Raman spectroscopy is a widely used characterization method in the study of crystal anisotropy. [8-10].For example, polarized Raman spectroscopy has been successfully used to detect ReS. Anisotropic characteristics of 2 and its crystal orientation [8], the related ultra-low wavenumber Raman spectroscopy results also confirm the ReS The significant anisotropy of 2 makes its in-plane shear vibration mode split. [9].Previous studies have shown that ReS The layer number insensitivity of 2 crystal is due to its weak interlayer coupling. [7], which also makes it difficult for us to use the number of layers to regulate its physical properties.Therefore, explore other means to effectively regulate ReS The interlayer coupling and related physical properties of 2 materials are very important.

    Among many external control methods, high voltage technology is an efficient, clean, continuous and reversible means to control the structural, electrical, optical and other physical properties of materials.In particular, the diamond anvil cell (DAC) high pressure technology can efficiently compress the interlayer distance of the unique laminated structure of two-dimensional materials, and greatly regulate the van der Waals interaction between the layers, thus realizing the sensitive modulation of the properties of two-dimensional materials.At present, high pressure technology has successfully induced WTe 2 from T d phase to Phase transition of T' phase [20], TiSe 2 CHANGE OF CHARGE DENSITY WAVE [21], MoSe 2 Band transition from semiconductor to metal [22], WSe 2-MoSe Large compression of the interlayer distance of the 2 heterojunction [23], and T'-MoTe Superconducting properties of 2 [24].In addition, ReS The high pressure response of 2 crystal has also been studied, such as the high pressure X-ray diffraction experiment found that ReS The triclinic phase of the 2 crystal is at 11.Phase transition occurs at 3 GPa [25]; It is found by calculation that ReS 2 under high pressure experiences from a twisted 3 R phase transition to twisted 1 T' phase, and finally the process of transformation into metallic phase [26].

    Up to now, there is no study of ReS by combining in situ polarized Raman spectroscopy with diamond anvil cell high pressure technique. High pressure response behavior of 2 crystal anisotropy.In this paper, the effect of high pressure (0 — 30 GPa) on ReS Effective control of the crystal structure and optical properties of 2, and by changing the polarization direction of the incident laser, the ReS Structure and anisotropy of 2 crystal under high pressure. Specifically, at a pressure of 3.ReS was found at about 0.4 GPa. 2 crystal from 1 T' symmetry to twisted 1 Structural phase transition of T' symmetry; as the pressure continues to increase to 14.At around 24 GPa, the ReS Re of 2 crystal Intra-layer deformation occurs in element 4; as the pressure increases to 22.08 and 25.Around 76 GPa, ReS 2 crystal undergoes a transition from interlayer disordered superposition to ordered superposition in different directions under in-plane anisotropic selection; when the pressure is above 30 GPa, the ReS. 2 begins to transform into an amorphous state.

    The sample studied in this paper is ReS. In situ high-pressure polarized Raman spectroscopy measurements were performed on the 2 crystal by mechanically exfoliating the resulting flake and then transferring it to the anvil face of the DAC using a tungsten needle ( Fig. 1(a) and Fig. 1(b)).

    Figure 1.  (a) Schematic illustration of the in-situ high pressure polarized Raman measurement system; (b) optical image of the ReS2 flake being measured (The green arrows indicate the polarization directions of the incident laser); (c) illustration of a diamond anvil cell (DAC) loaded with the ReS2 sample; (d) top view of the ReS2 crystal structure (The black rectangle indicates the Re-Re chain. θ is defined as the angle between the polarization of the incident laser and the b-axis of ReS2. represents the incident direction of the laser (into the page)); (e) side view of the ReS2 crystal structure.

    Specifically, a T-301steel gasket was placed between the two diamond anvil surfaces, and then the anvil was closed and the four pressure screws of the DAC were slightly tightened to pre-press a depression with a thickness of about 50 μm in the center of the gasket; then a screw drill with a diameter of 150 μm was used to drill a circular hole (diameter of 150 μm) in the center of the pre-pressed gasket to form a sample microcavity with the diamond anvil surface; further, the stripped ReS 2 thin layer sample and ruby particles (3 — 5 μm, for pressure calibration) were transferred into the sample cavity ( Fig. 1(b)), and finally the microcavity filled with the sample and ruby is filled with silicone oil (pressure transmitting medium) to provide a quasi-hydrostatic environment for the sample. The packaged DAC is as follows: Shown in Fig. 1(c).

    After the sample was encapsulated in a DAC, the DAC was further assembled on a confocal Raman spectroscopy system (WITec-alpha300R) to perform in situ high-pressure polarized Raman spectroscopy measurements on the sample.The experimental setup used in this paper is backscattering collection mode (such as As shown in Fig. 1(a)), the excitation light is incident along the normal direction of the atomic plane, and the backscattering signal is collected after the interaction between the light and the substance. The wavelength of the excitation light is 532 nm, and the appropriate incident laser power is selected to avoid heating the sample. The single spectrum data acquisition time is 60 s.The polarization direction of the incident laser selected in this experiment is respectively connected with the coordinate axis of the experimental platform x parallel and perpendicular, such as The green double arrow in Fig. 1(b).

    ReS The top and side views of the 2 crystal structure are shown in Fig. 1(d) and As shown in Fig. 1(e), layered ReS 2 crystal is 1 T' rhombic chain structure with triclinic symmetry and space group Pˉ1 [18].The rhenium (Re) atom in the 7th subgroup has abundant valence electrons, which makes it form a metal-sulfur covalent bond with the sulfur (S) atom and a Re-Re metallic bond.ReS 2 monolayer, each Re atom forms a strong covalent bond with six neighboring S atoms, and compared with the ideal octahedral coordination, the ReS Re atoms in 2 from the surrounding S The center of the 6 octahedron is transferred, and four adjacent Re atoms are combined into a rhombic Re in the form of metallic bonds due to Peierls distortion. Unit 4 [27,28].Periodic Re The 4 units are joined together to form zigzag (Zigzag) Re chains, usually along the crystal. Direction of the b axis (see Fig. 1(d)).Multilayer ReS 2 Stacking at a special angle (usually with the lowest energy) to form bulk ReS under the action of interlayer van der Waals force 2 crystal.

    ReS 2( Ci,Pˉ1) The unique low symmetry of the crystal structure makes it have a unique Raman response.Specifically, a two-dimensional ReS with a triclinic There are 18 Raman-active vibrational modes in the 2 crystal, and all of them are A. g mode.According to 1 T' symmetry, A The Raman tensor matrix for the g mode is R=(uvvw) [14], the tensor elements of this Raman matrix are determined by three parameters.It is known from the classical Raman model that the A The intensity of the g vibration mode is I s ∝ | ˆei R· ˆes| 2, where ˆei and ˆes are the unit polarization vectors of the incident and scattered light, respectively.Defined here θ is ReS 2 crystal Angle between the b axis and the polarization direction of the incident laser (see Fig. 1(d)).

    In a configuration where the incident laser polarization is relatively parallel to the scattered laser polarization, ˆei = ˆes = (cos θ, sin θ), when ReS A in 2 Raman intensity and angle of g vibration mode The dependence of θ can be written as

    I//(θ)(ucos2θ+2vcosθsinθ + wsin2θ)2. (1)

    Under the configuration that the incident laser polarization is relatively perpendicular to the scattered laser polarization, the unit polarization vectors of the incident and scattered light are respectively ˆei = (cos θ, sin θ), ˆes = (–sin θ, cos θ), then A Raman intensity and angle of g vibration mode The dependence of θ is

    I(θ){(wu)[12sin(2θ)vcos(2θ)]}2. (2)

    In order to obtain the optimal Raman signal in the DAC, the "parallel + perpendicular" full collection mode is used in this experiment. Raman total intensity of g vibrational mode I T( θ) is the sum of the Raman intensities for the parallel and perpendicular configurations of the scattered light polarization to the incident light polarization, respectively, i.e.

    IT(θ)u2cos2θ+w2sin2θ+v2+v(u+w)sin(2θ). (3)

    From this, it can be seen that in the case of full collection, I T( θ) always carries two (with respect to the two-dimensional Raman tensor θ = 0 °) or three ( θ ≠ 0 °) information for parameters that are not equivalent and usually not zero [29] and I T( θ) always has an expression with θ Irrelevant v 2 (which is not zero in general), so in θ is equal to any value, I T( θ) is always non-zero.A The Raman intensity of the g vibrational mode varies with θ is changed, and the tensor elements of different vibration modes ( u, v, w) have different values, thus in different Maximum and minimum at θ.

    Nonzero tensor elements in the Raman tensor matrix ( u, v, w) is determined by the symmetry of the scattering system, so the value of Re 2 performed polarized Raman scattering measurements at ambient pressure ( Fig. 2), further explore the ReS 2 Symmetry and Anisotropy of Lattice.Define at this time α is the coordinate axis of the incident laser polarization direction relative to the test bench Angle of x, The two spectra in Fig. 2 correspond to the polarization direction of the incident laser and the coordinate axis of the experimental table, respectively. Configurations of x parallel and perpendicular (i.e. α equal to 0 ° and 90 °, respectively), while aligning the longest straight edge (generally corresponding to the direction of the crystal axis) formed during the cleavage of the sample with the coordinate axis of the test bench.The experimental results show that in the 130-440 cm range of the two Raman spectra Eighteen Raman-active vibrational modes were observed in the frequency range of –1, and then these vibrational modes were analyzed in the order of frequency from high to low. Fig. 2, and the properties and frequencies of these 18 peaks are listed in 表1.From Fig. 2 It can be seen that the Raman spectra of the two configurations show 18 Raman vibration modes, and the intensity of all vibration modes changes with the polarization direction of the excitation light, among which the low-frequency 1,3,5 Raman vibration modes show significant polarization dependence, which is different from the previous pair A. Raman intensity of g vibrational mode ( ( The derivation results of 3) are completely consistent.The above experimental and theoretical studies have confirmed that ReS The low symmetry and strong in-plane anisotropy of the 2 crystal.

    Table 1.  Assignment of 18 Raman active modes in ReS2 crystal.
    Serial numberSymmetryRaman frequency/cm–1
    1Ag-like137.5
    2Ag-like142.6
    3Eg-like150.2
    4Eg-like160.4
    5Eg-like211.0
    6Eg-like233.8
    7Cp274.6
    8Cp280.9
    9Eg-like305.0
    10Eg-like307.8
    11Cp317.4
    12Cp321.7
    13Cp345.6
    14Cp365.9
    15Cp375.4
    16Cp404.5
    17Ag-like426.4
    18Ag-like436.1
     | Show Table
    DownLoad: CSV
    Figure 2.  Raman spectra of an ReS2 flake with the incident laser polarized parallel (top, α = 0°) and perpendicular (bottom, α = 90°) to the x-axis of the experimental system. The wavelength of excitation laser is 532 nm. α is defined as the angle of the incident laser polarization direction (white arrow) with respect to the x-axis (white dotted line).

    According to the symmetry analysis of group theory, Res The 18 Raman vibrational modes observed by 2 at ambient pressure all belong to A g vibration mode [30], where the Raman mode with the larger out-of-plane vibrational weight is assigned to A g-like, the Raman mode with larger in-plane vibrational weight is assigned to E g-like, the vibrational mode with equivalent in-plane and out-of-plane vibrational weights is assigned to C p coupling mode [7], such as 表1.Specifically, the ReS A total of four A in the 2 crystal g-like vibrational modes, where the two lower frequency A g-like Raman modes (137.5 and 142.6 cm –1) mainly involves the out-of-plane vibration of Re atoms, and the other two high-frequency A g-like Raman modes (426.4 and 436.1 cm –1) is mainly related to the out-of-plane vibration of the S atom. The frequencies are located at 150.2, 160.4,211.0 and 233.8 cm E of –1 The g-like vibrational mode is dominated by in-plane vibrations of Re atoms, while the other two E g-like Raman modes with frequencies of 305.0 and 307.8 cm –1, mainly the in-plane vibration of S atom. Located at 274.6 and 280.9 cm C of –1 The p vibration is mainly the in-plane and out-of-plane vibration of Re and S atoms, while the 300 cm C above –1 The p vibration is mainly composed of the in-plane and out-of-plane vibrations of the S atom. [30].

    Furthermore, two orthogonal incident laser polarization directions are selected, In situ high pressure polarized Raman study of 2 crystal to characterize ReS Evolution of crystal and electronic structure of 2 crystal under pressure.Fig. 3(a) and Fig. 3(b) are the polarization direction of the incident laser and the coordinate axis of the test bench, respectively. x parallel ( α = 0 °) and vertical ( α = 90 °), ReS In situ high pressure Raman spectra of 2 crystal at 150 and 500 cm The peak around –1 is the Raman signal of the pressure transmitting medium silicone oil ( * area in Fig. 3).For the convenience of description, A in the 18 vibration modes is g-like and E g-like is abbreviated as A g and E g, and use the numbers 1-18 to represent the serial numbers of the 18 vibration modes.The Lorentz nonlinear equation is then used to The Raman peaks in the spectrum of Fig. 3 are fitted to obtain the evolution law and variation curve of the frequencies of all vibration modes with pressure, such as Fig. 4.

    Figure 3.  In-situ high pressure Raman measurements of ReS2 crystal (0–30 GPa): (a) α = 0°; (b) α = 90°. The bump labeled with * is the Raman signal from silicone oil. The dark blue, green, and orange dotted lines represent the evolution of the key Raman modes revealing the first, second, and third phase transitions, respectively.
    Figure 4.  Pressure dependence of Raman mode frequencies for the ReS2 sample (0–30 GPa): (a) α = 0°; (b) α = 90. The dark blue, green, and orange data lines represent the variation trend of featured Raman modes at the first, second, and third phase transitions, respectively. The gray data lines represent Raman modes that can be observed throughout the entire pressure range.

    Fig. 4 gives the ReS The frequencies of 21 Raman vibration modes of 2 crystal (including 18 Raman vibration modes under normal pressure and Raman vibration modes under high pressure) change with pressure. It can be clearly seen that most of the vibration modes have significant changes under pressure, and only a few vibration modes are insensitive to the applied pressure, so that their frequencies change little with pressure. These vibration modes have obvious in-plane vibration properties (E g mode).By analyzing the evolution trend of the frequency of the vibration mode with pressure in the figure, ReS can be obtained Complete phase transition information of 2 crystal under high pressure from 0 to 29.76 GPa.

    First, in the relatively low pressure range (0-3.04 GPa), at α = 0 ° and α = 90 ° in two experimental configurations, A g-2, C p-7, C p-8, C p-11 and C The Raman intensities of the five vibrational modes, such as p-14, decrease with the increase of pressure, and this process is accompanied by the increase of frequency.Vanishes near 0 4 GPa; meanwhile, near this pressure, one frequency is 135.2 cm New A for –1 g Vibration mode appears.The disappearance of these 5 Raman peaks and the appearance of a new Raman peak (corresponding to The dark blue dashed line in Fig. 3 and Dark blue data line in Fig. 4), which gives the ReS The first phase transition process of 2 crystal: in 3.04 GPa or so, ReS 2 crystal completed from 1 T' phase transition to twist 1 Crystal structure transition of T' phase (high pressure phase), this phenomenon is consistent with the reported ReS The results of high pressure diffraction of 2 crystal are consistent. [31-34].The distance between the layers is shortened under high pressure, which leads to the increase of the repulsive force between the layers S and S. In order to make the whole system reach the lowest energy state, the high pressure-induced distortion 1 Angle ratio between layers of T' phase 1 T'-ReS The interlayer angle of 2 is more distorted.

    When the pressure continues to increase to about 14.2 GPa, C The p-15 vibration mode begins to split, and a frequency of 290.9 cm New C for –1 The p vibrational mode appears, which gives the ReS The second phase transition process of the 2 crystal (corresponding to The green dashed line in Fig. 3 and Green data line in Fig. 4).Specifically, due to C The p vibration mode is the coupling mode of the in-plane vibration and the out-of-plane vibration of the Re atom and the S atom, and the phase transition here may be related to the rotation of the S atom around the Re atomic chain under higher pressure and the Re Unit 4 is related to intrastory distortion. [33,35].

    As the pressure rises further to 22.Around 08 GPa, which can be found in C under the experimental configuration of α = 0 ° p-12 and A g-17 Raman peak disappears (based on the criterion that the error coefficient obtained by fitting increases sharply at this pressure), which gives the ReS The third phase transition process of 2 crystal.C p-12 and A The g-17 vibration modes are all related to the out-of-plane vibration of the S atom. Previous studies have shown that due to the ReS The interlayer coupling of 2 is weak, and the two monolayers ReS 2 stacking together does not cause a significant change in the total energy of the structure, so the ReS at atmospheric pressure 2 is randomly superimposed, while the ReS at high pressure 2 The interlayer coupling is stronger, which makes its stacking structure more orderly. Therefore, in 22.ReS at 0 8 GPa The transition from interlayer disordered superposition to ordered superposition occurs in the 2 crystal, which causes the interlayer force constant of S atoms to change, and the out-of-plane vibration of S atoms is more strongly bound. [33,35], which eventually leads to C p-12 and A g-17 Disappearance of vibrational modes.Indeed, Liu et al. [36] also confirms that the change of interlayer stacking structure does affect the out-of-plane vibration of S atoms.

    And The experimental configuration of α = 0 ° is different. Under the experimental configuration of α = 90 °, ReS The third phase transition process of 2 crystal is at 25.Only about 76 GPa passes through C p-12 and A The disappearance of peak g-17 was observed (see The orange dashed line in Fig. 3(b) and Orange data line in Fig. 4).In addition to C p-12 and A In addition to the disappearance of the g-17 Raman peak, C was also found Abnormal disappearance behavior of peak p-16.By analyzing C p-12, A g-17 and C The properties of the p-16 vibrational mode and the polarized Raman spectrum at ambient pressure ( Fig. 2), found that C p-12 and A The intensity of the g-17 vibrational mode is hardly affected by the polarization direction of the incident laser, however, C The intensity of the p-16 vibration mode is greatly affected by the polarization direction of the incident laser. α = 90 °, this mode varies with a g-17 together at 25.Disappears around 76 GPa, but at α = 0 °, C p-16 can be observed all the way up to 30 GPa (see The orange dashed line in Fig. 3(a) and Orange data line in Fig. 4).From this we guess that C The out-of-plane vibration components and weights of the S atom in the p-12 vibration mode are large, which are similar to those of A. g vibration mode close to.However C The in-plane vibration components and weights of S atoms in the p-16 vibration mode are large, which are similar to those of E. The g vibration mode is close to each other, which reflects the polarization selectivity of the Raman peak intensity, which is determined by its in-plane anisotropy.

    In addition, an interesting phenomenon was observed for the first time in the experiment: under different configurations of the polarization direction of the incident laser, the RES was reflected Raman peak of 2 crystal phase transition (C p-12 and A g-17) disappear at different pressure points.This may be related to ReS at very high pressures. The intralayer anisotropy of the 2 crystal becomes more pronounced.Previous studies have shown that in a certain pressure range (16 — 25 GPa), the ReS The volume of 2 crystal expands to a certain extent with the increase of external pressure. In this case, the effect of external pressure is no longer to compress ReS. 2 The interlayer spacing and covalent bonding of the crystal, but mainly drive the ReS The interlayer slip of 2 crystal occurs in different directions in the plane, resulting in the transformation from disordered superposition to ordered superposition.Since ReS The elastic modulus of 2 crystal in the direction of Re chain is different from that in the direction perpendicular to Re chain, which leads to different slip displacement under the same external pressure. [37,38].Therefore, the transformation process from interlayer disordered superposition to ordered superposition is different in each direction in the plane, which leads to the different pressure required to complete the ordered superposition, so it can be considered that ReS The third phase transition of 2 crystal under high pressure occurs from 22.08 to 25.00.76 GPa. This experiment proves that ReS The anisotropy of 2 crystal under high pressure becomes more significant, and the evolution of crystal structure in different directions in the plane under high pressure can be analyzed more clearly by in situ high pressure polarized Raman.

    From Fig. 4 It is not difficult to find that the low-frequency in-plane vibration mode (E) caused by Re atomic vibration g-3, E g-4, E g-5 and E g-6) is more sensitive to applied pressure than A. g and C The p mode is low, which is consistent with previous studies on the evolution of Raman vibrations of two-dimensional materials under high pressure. [20,23].In addition, the pressure dependence of these low-frequency in-plane vibration modes is basically linear in the whole pressure range, indicating that the vibration behavior of Re atoms is basically the same during the whole high-pressure phase transition process.When the applied pressure exceeds 30 GPa, the ReS The 2 crystal begins to amorphize, and most of the Raman peaks in the Raman spectrum become broader and weaker with the increase of pressure, which is consistent with the amorphization phenomenon of two-dimensional materials under high pressure. [39,40].

    In this paper, the two-dimensional ReS is systematically studied by experimental and theoretical There are 18 Raman-active vibration modes of 2 crystal. The properties of these 18 vibration modes are classified and the atomic vibration behavior is analyzed through theoretical derivation, and the ReS. Dependence of the different vibrational modes of the 2 crystal on the polarization direction of the incident laser, thus confirming the ReS Low symmetry and strong in-plane anisotropy of the 2 crystal structure.In situ high pressure polarized Raman spectroscopy was used to characterize ReS under high pressure (0 — 30 GPa). The evolution of the crystal structure and optical properties of 2, and found three phase transition pressure points: 3.04 GPa, corresponding to 1 Phase T' to Twist 1 Crystal structure transition of T' phase; 14.24 GPa, corresponding to Re Intra-layer deformation of unit 4; 22.08 and 25.76 GPa, corresponding to the transition from disordered stacking to ordered stacking between layers in different directions under in-plane anisotropy selection.In particular, it is found that under different incident laser polarization directions, the RES is reflected The Raman peak of 2 crystal phase transition disappears at different pressure points, and the evolution law of crystal structure in different directions in the plane under high pressure is obtained, which further proves that ReS under high pressure 2 The anisotropy of the crystal becomes more pronounced.This paper will provide new ideas for the control and optimization of the properties of this kind of two-dimensional semiconductor materials, as well as the subsequent research and application of anisotropy.

    Based on the experimental results of this paper, we propose the following questions for further study.First, with low symmetry 1 ReS of phase T' In the Raman vibration mode of the 2 crystal, the composition C The weights of the atomic in-plane and out-of-plane vibrations of the p coupling mode need to be further analyzed and determined by experiment and theory, from which different C can be accurately analyzed. p The coupling mode has different incident laser polarization dependence.In addition, ReS at high pressure The enhancement of in-plane anisotropy of 2 crystal needs to be verified by further experiments and theories, so as to extract the dependence of in-plane Re — Re and Re — S bond force constants on pressure.Moreover, ReS induced by extremely high pressure The phenomenon of phase transition pressure point shift in 2 crystal also needs more detailed high-pressure polarization experiments and theoretical analysis, so as to obtain the sequence of interlayer disorder superposition to order superposition in different directions of the crystal, as well as a clearer physical process and physical image.

    [1]

    Xia J, Wang J, Chao D L, Chen Z, Liu Z, Kuo J L, Yan J X, Shen Z X 2017 Nanoscale 9 7533Google Scholar

    [2]

    Wang Q H, Kalantar-Zadeh K, Kis A, Coleman J N, Strano M S 2012 Nat. Nanotechnol. 7 699Google Scholar

    [3]

    刘雨亭, 贺文宇, 刘军伟, 邵启明 2021 物理学报 70 127303Google Scholar

    Liu Y T, He W Y, Liu J W, Sao Q M 2021 Acta Phys. Sin. 70 127303Google Scholar

    [4]

    Radisavljevic B, Radenovic A, Brivio J, Giacometti V, Kis A 2011 Nat. Nanotechnol. 6 147Google Scholar

    [5]

    Zeng H L, Cui X D 2015 Chem. Soc. Rev. 44 2629Google Scholar

    [6]

    Li Y F, Zhou Z, Zhang S B, Chen Z F 2008 J. Am. Chem. Soc. 130 16739Google Scholar

    [7]

    Tongay S, Sahin H, Ko C, Luce A, Fan W, Liu K, Zhou J, Huang Y S, Ho C H, Yan J Y, Ogletree D F, Aloni S, Ji J, Li S S, Li J B, Peeters F M, Wu J Q 2014 Nat. Commun. 5 3252Google Scholar

    [8]

    Chenet D A, Aslan O B, Huang P Y, Fan C, van der Zande A M, Heinz T F, Hone J C 2015 Nano Lett. 15 5667Google Scholar

    [9]

    Lorchat E, Froehlicher G, Berciaud S 2016 ACS Nano 10 2752Google Scholar

    [10]

    Liu E F, Fu Y J, Wang Y J, Feng Y Q, Liu H M, Wan X G, Zhou W, Wang B G, Shao L B, Ho C H, Huang Y S, Cao Z Y, Wang L G, Li A D, Zeng J W, Song F Q, Wang X R, Shi Y, Yuan H T, Hwang H Y, Cui Y, Miao F, Xing D Y 2015 Nat. Commun. 6 6991Google Scholar

    [11]

    Zhong H X, Gao S Y, Shi J J, Yang L 2015 Phys. Rev. B 92 115438Google Scholar

    [12]

    徐翔, 张莹, 闫庆, 刘晶晶, 王骏, 徐新龙, 华灯鑫 2021 物理学报 70 098203Google Scholar

    Xu X, Zhang Y, Yan Q, Liu J J, Wang J, Xu X L, Hua D X 2021 Acta Phys. Sin. 70 098203Google Scholar

    [13]

    He J Q, Zhang L, He D W, Wang Y S, He Z Y, Zhao H 2018 Opt. Express 26 21501Google Scholar

    [14]

    Hart L, Dale S, Hoye S, Webb J L, Wolverson D 2016 Nano Lett. 16 1381Google Scholar

    [15]

    Shim J, Oh A, Kang D H, Oh S, Jang S K, Jeon J, Jeon M H, Kim M, Choi C, Lee J, Lee S, Yeom G Y, Song Y J, Park J H 2016 Adv. Mater. 28 6985Google Scholar

    [16]

    Tongay S, Zhou J, Ataca C, Lo K, Matthews T S, Li J B, Grossman J C, Wu J Q 2012 Nano Lett. 12 5576Google Scholar

    [17]

    Jin W C, Yeh P C, Zaki N, Zhang D T, Sadowski J T, Al-Mahboob A, van der Zande A M, Chenet D A, Dadap J I, Herman I P, Sutter P, Hone J, Osgood Jr R M 2013 Phys. Rev. Lett. 111 106801Google Scholar

    [18]

    Rahman M, Davey K, Qiao S Z 2017 Adv. Funct. Mater. 27 1606129Google Scholar

    [19]

    Ho C H, Huang Y S, Tiong K K 2001 J. Alloy. Compd. 317 222

    [20]

    Xia J, Li D F, Zhou J D, Yu P, Lin J H, Kuo J L, Li H B, Liu Z, Yan J X, Shen Z X 2017 Small 13 1701887Google Scholar

    [21]

    Calandra M, Mauri F 2011 Phys. Rev. Lett. 106 196406Google Scholar

    [22]

    Zhao Z, Zhang H J, Yuan H T, Wang S B, Lin Y, Zeng Q S, Xu G, Liu Z X, Solanki G K, Patel K D, Cui Y, Hwang H Y, Mao W L 2015 Nat. Commun. 6 7312Google Scholar

    [23]

    Xia J, Yan J X, Wang Z H, He Y M, Gong Y J, Chen W Q, Sum T C, Liu Z, Ajayan P M, Shen Z X 2021 Nat. Phys. 17 92Google Scholar

    [24]

    Alidoust M, Halterman K, Zyuzin A A 2017 Phys. Rev. B 95 155124Google Scholar

    [25]

    Hou D B, Ma Y Z, Du J G, Yan J Y, Ji C, Zhu H Y 2010 J. Phys. Chem. Solids 71 1571Google Scholar

    [26]

    Zhou D W, Zhou Y H, Pu C Y, Chen X L, Lu P C, Wang X F, An C, Zhou Y, Miao F, Ho C H, Sun J, Yang Z R, Xing D Y 2017 npj Quantum Mater. 2 19Google Scholar

    [27]

    Kertesz M, Hoffmann R 1984 J. Am. Chem. Soc. 106 3453Google Scholar

    [28]

    Murray H H, Kelty S P, Chianelli R R, Day C S 1994 Inorg. Chem. 33 4418Google Scholar

    [29]

    Wolverson D, Crampin S, Kazemi A S, Ilie A, Bending S J 2014 ACS Nano 8 11154Google Scholar

    [30]

    Feng Y Q, Zhou W, Wang Y J, Zhou J, Liu E F, Fu Y J, Ni Z H, Wu X L, Yuan H T, Miao F, Wang B G, Wan X G, Xing D Y 2015 Phys. Rev. B 92 054110Google Scholar

    [31]

    Wang P, Wang Y G, Qu J Y, Zhu Q, Yang W G, Zhu J L, Wang L P, Zhang W W, He D W, Zhao Y S 2018 Phys. Rev. B 97 235202Google Scholar

    [32]

    Sheremetyeva N, Tristant D, Yoshimura A, Gray J, Liang L B, Meunier V 2019 Phys. Rev. B 100 214101Google Scholar

    [33]

    Saha P, Ghosh B, Mazumder A, Glazyrin K, Mukherjee G D 2020 J. Appl. Phys. 128 085904Google Scholar

    [34]

    Ibáñez-Insa J, Wózniak T, Oliva R, Popescu C, Hernández S, López-Vidrier J 2021 Minerals 11 207

    [35]

    Yan Y L, Jin C L, Wang J, Qin T R, Li F F, Wang K, Han Y H, Gao C X 2017 J. Phys. Chem. Lett. 8 3648Google Scholar

    [36]

    Liu K H, Zhang L M, Cao T, Jin C H, Qiu D A, Zhou Q, Zettl A, Yang P D, Louie S G, Wang F 2014 Nat. Commun. 5 4966Google Scholar

    [37]

    Zhao Q Y, Guo Y H, Zhou Y X, Xu X, Ren Z Y, Bai J T, Xu X L 2017 J. Phys. Chem. C 121 23744Google Scholar

    [38]

    Feng Y Q, Sun H Y, Sun J H, Shen Y, You Y 2019 Mater. Today Commun. 21 100684Google Scholar

    [39]

    Chi Z H, Chen X L, Yen F, Peng F, Zhou Y H, Zhu J L, Zhang Y J, Liu X D, Lin C L, Chu S Q, Li Y C, Zhao J G, Kagayama T, Ma Y M, Yang Z R 2014 Phys. Rev. Lett. 120 037002

    [40]

    Mao H K, Chen B, Chen J H, Li K, Lin J F, Yang W G, Zheng H Y 2016 Matter Radiat. Extrem. 1 59Google Scholar

  • 图 1  (a) 原位高压偏振拉曼光谱系统测试图; (b) ReS2薄片的光学照片, 绿色箭头为入射激光的两个正交偏振方向; (c) 封装样品后的金刚石对顶砧示意图; (d) ReS2晶体结构俯视图, 黑色矩形示意为结构中的铼链, θ为入射激光偏振方向与ReS2晶体b轴的夹角, 为激光与原子面垂直的入射方向; (e) ReS2晶体结构侧视图

    Figure 1.  (a) Schematic illustration of the in-situ high pressure polarized Raman measurement system; (b) optical image of the ReS2 flake being measured (The green arrows indicate the polarization directions of the incident laser); (c) illustration of a diamond anvil cell (DAC) loaded with the ReS2 sample; (d) top view of the ReS2 crystal structure (The black rectangle indicates the Re-Re chain. θ is defined as the angle between the polarization of the incident laser and the b-axis of ReS2. represents the incident direction of the laser (into the page)); (e) side view of the ReS2 crystal structure.

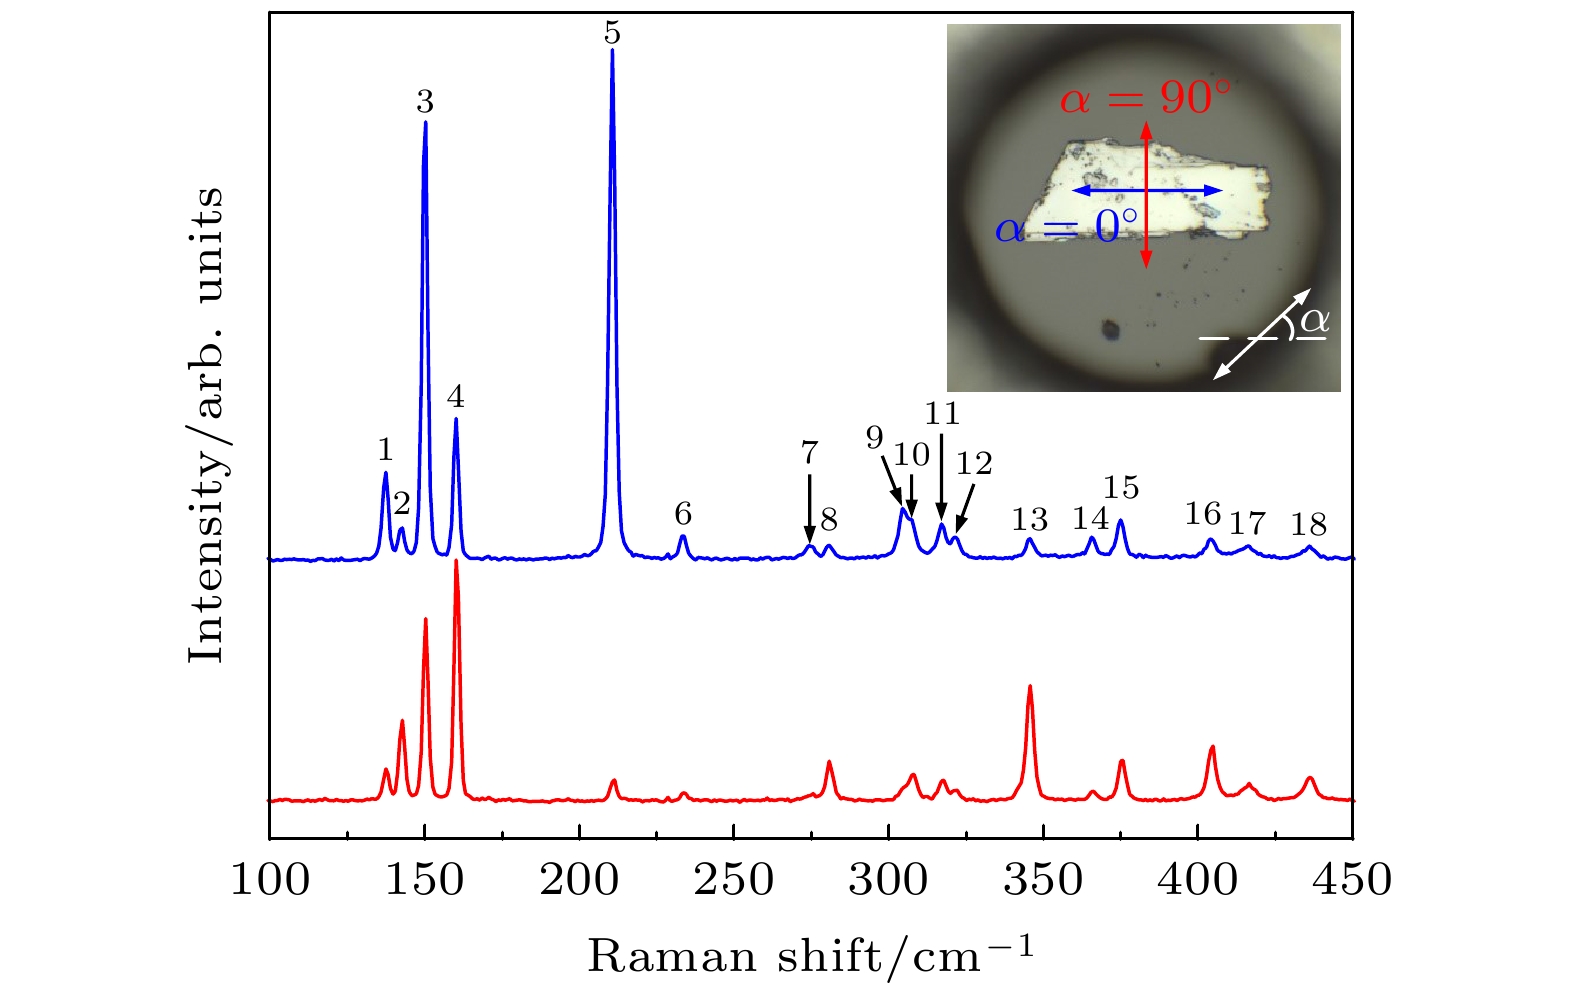
    图 2  两种正交入射激光偏振方向下ReS2的拉曼光谱, 入射激光波长为532 nm; α为入射激光偏振方向(白色箭头)相对于实验台坐标轴x (白色虚线)的夹角, 蓝色为α = 0°, 红色为α = 90°

    Figure 2.  Raman spectra of an ReS2 flake with the incident laser polarized parallel (top, α = 0°) and perpendicular (bottom, α = 90°) to the x-axis of the experimental system. The wavelength of excitation laser is 532 nm. α is defined as the angle of the incident laser polarization direction (white arrow) with respect to the x-axis (white dotted line).

    图 3  ReS2晶体的原位高压拉曼光谱(0—30 GPa) (a) α = 0°; (b) α = 90°. *区域为硅油的拉曼信号; 深蓝色、绿色和橙色虚线分别代表第一个相变点、第二个相变点以及第三个相变点时特征拉曼振动模式的变化趋势

    Figure 3.  In-situ high pressure Raman measurements of ReS2 crystal (0–30 GPa): (a) α = 0°; (b) α = 90°. The bump labeled with * is the Raman signal from silicone oil. The dark blue, green, and orange dotted lines represent the evolution of the key Raman modes revealing the first, second, and third phase transitions, respectively.

    图 4  ReS2晶体的部分拉曼振动模式频率随压强的变化 (0—30 GPa) (a) α = 0°; (b) α = 90°. 深蓝色, 绿色和橙色数据线分别代表第一个相变点, 第二个相变点以及第三个相变点时特征拉曼振动模式的变化趋势; 灰色数据线表示文中不进行重点讨论的拉曼振动模式

    Figure 4.  Pressure dependence of Raman mode frequencies for the ReS2 sample (0–30 GPa): (a) α = 0°; (b) α = 90. The dark blue, green, and orange data lines represent the variation trend of featured Raman modes at the first, second, and third phase transitions, respectively. The gray data lines represent Raman modes that can be observed throughout the entire pressure range.

    表 1  ReS2晶体的18个拉曼振动模式的属性

    Table 1.  Assignment of 18 Raman active modes in ReS2 crystal.

    Serial numberSymmetryRaman frequency/cm–1
    1Ag-like137.5
    2Ag-like142.6
    3Eg-like150.2
    4Eg-like160.4
    5Eg-like211.0
    6Eg-like233.8
    7Cp274.6
    8Cp280.9
    9Eg-like305.0
    10Eg-like307.8
    11Cp317.4
    12Cp321.7
    13Cp345.6
    14Cp365.9
    15Cp375.4
    16Cp404.5
    17Ag-like426.4
    18Ag-like436.1
    DownLoad: CSV
  • [1]

    Xia J, Wang J, Chao D L, Chen Z, Liu Z, Kuo J L, Yan J X, Shen Z X 2017 Nanoscale 9 7533Google Scholar

    [2]

    Wang Q H, Kalantar-Zadeh K, Kis A, Coleman J N, Strano M S 2012 Nat. Nanotechnol. 7 699Google Scholar

    [3]

    刘雨亭, 贺文宇, 刘军伟, 邵启明 2021 物理学报 70 127303Google Scholar

    Liu Y T, He W Y, Liu J W, Sao Q M 2021 Acta Phys. Sin. 70 127303Google Scholar

    [4]

    Radisavljevic B, Radenovic A, Brivio J, Giacometti V, Kis A 2011 Nat. Nanotechnol. 6 147Google Scholar

    [5]

    Zeng H L, Cui X D 2015 Chem. Soc. Rev. 44 2629Google Scholar

    [6]

    Li Y F, Zhou Z, Zhang S B, Chen Z F 2008 J. Am. Chem. Soc. 130 16739Google Scholar

    [7]

    Tongay S, Sahin H, Ko C, Luce A, Fan W, Liu K, Zhou J, Huang Y S, Ho C H, Yan J Y, Ogletree D F, Aloni S, Ji J, Li S S, Li J B, Peeters F M, Wu J Q 2014 Nat. Commun. 5 3252Google Scholar

    [8]

    Chenet D A, Aslan O B, Huang P Y, Fan C, van der Zande A M, Heinz T F, Hone J C 2015 Nano Lett. 15 5667Google Scholar

    [9]

    Lorchat E, Froehlicher G, Berciaud S 2016 ACS Nano 10 2752Google Scholar

    [10]

    Liu E F, Fu Y J, Wang Y J, Feng Y Q, Liu H M, Wan X G, Zhou W, Wang B G, Shao L B, Ho C H, Huang Y S, Cao Z Y, Wang L G, Li A D, Zeng J W, Song F Q, Wang X R, Shi Y, Yuan H T, Hwang H Y, Cui Y, Miao F, Xing D Y 2015 Nat. Commun. 6 6991Google Scholar

    [11]

    Zhong H X, Gao S Y, Shi J J, Yang L 2015 Phys. Rev. B 92 115438Google Scholar

    [12]

    徐翔, 张莹, 闫庆, 刘晶晶, 王骏, 徐新龙, 华灯鑫 2021 物理学报 70 098203Google Scholar

    Xu X, Zhang Y, Yan Q, Liu J J, Wang J, Xu X L, Hua D X 2021 Acta Phys. Sin. 70 098203Google Scholar

    [13]

    He J Q, Zhang L, He D W, Wang Y S, He Z Y, Zhao H 2018 Opt. Express 26 21501Google Scholar

    [14]

    Hart L, Dale S, Hoye S, Webb J L, Wolverson D 2016 Nano Lett. 16 1381Google Scholar

    [15]

    Shim J, Oh A, Kang D H, Oh S, Jang S K, Jeon J, Jeon M H, Kim M, Choi C, Lee J, Lee S, Yeom G Y, Song Y J, Park J H 2016 Adv. Mater. 28 6985Google Scholar

    [16]

    Tongay S, Zhou J, Ataca C, Lo K, Matthews T S, Li J B, Grossman J C, Wu J Q 2012 Nano Lett. 12 5576Google Scholar

    [17]

    Jin W C, Yeh P C, Zaki N, Zhang D T, Sadowski J T, Al-Mahboob A, van der Zande A M, Chenet D A, Dadap J I, Herman I P, Sutter P, Hone J, Osgood Jr R M 2013 Phys. Rev. Lett. 111 106801Google Scholar

    [18]

    Rahman M, Davey K, Qiao S Z 2017 Adv. Funct. Mater. 27 1606129Google Scholar

    [19]

    Ho C H, Huang Y S, Tiong K K 2001 J. Alloy. Compd. 317 222

    [20]

    Xia J, Li D F, Zhou J D, Yu P, Lin J H, Kuo J L, Li H B, Liu Z, Yan J X, Shen Z X 2017 Small 13 1701887Google Scholar

    [21]

    Calandra M, Mauri F 2011 Phys. Rev. Lett. 106 196406Google Scholar

    [22]

    Zhao Z, Zhang H J, Yuan H T, Wang S B, Lin Y, Zeng Q S, Xu G, Liu Z X, Solanki G K, Patel K D, Cui Y, Hwang H Y, Mao W L 2015 Nat. Commun. 6 7312Google Scholar

    [23]

    Xia J, Yan J X, Wang Z H, He Y M, Gong Y J, Chen W Q, Sum T C, Liu Z, Ajayan P M, Shen Z X 2021 Nat. Phys. 17 92Google Scholar

    [24]

    Alidoust M, Halterman K, Zyuzin A A 2017 Phys. Rev. B 95 155124Google Scholar

    [25]

    Hou D B, Ma Y Z, Du J G, Yan J Y, Ji C, Zhu H Y 2010 J. Phys. Chem. Solids 71 1571Google Scholar

    [26]

    Zhou D W, Zhou Y H, Pu C Y, Chen X L, Lu P C, Wang X F, An C, Zhou Y, Miao F, Ho C H, Sun J, Yang Z R, Xing D Y 2017 npj Quantum Mater. 2 19Google Scholar

    [27]

    Kertesz M, Hoffmann R 1984 J. Am. Chem. Soc. 106 3453Google Scholar

    [28]

    Murray H H, Kelty S P, Chianelli R R, Day C S 1994 Inorg. Chem. 33 4418Google Scholar

    [29]

    Wolverson D, Crampin S, Kazemi A S, Ilie A, Bending S J 2014 ACS Nano 8 11154Google Scholar

    [30]

    Feng Y Q, Zhou W, Wang Y J, Zhou J, Liu E F, Fu Y J, Ni Z H, Wu X L, Yuan H T, Miao F, Wang B G, Wan X G, Xing D Y 2015 Phys. Rev. B 92 054110Google Scholar

    [31]

    Wang P, Wang Y G, Qu J Y, Zhu Q, Yang W G, Zhu J L, Wang L P, Zhang W W, He D W, Zhao Y S 2018 Phys. Rev. B 97 235202Google Scholar

    [32]

    Sheremetyeva N, Tristant D, Yoshimura A, Gray J, Liang L B, Meunier V 2019 Phys. Rev. B 100 214101Google Scholar

    [33]

    Saha P, Ghosh B, Mazumder A, Glazyrin K, Mukherjee G D 2020 J. Appl. Phys. 128 085904Google Scholar

    [34]

    Ibáñez-Insa J, Wózniak T, Oliva R, Popescu C, Hernández S, López-Vidrier J 2021 Minerals 11 207

    [35]

    Yan Y L, Jin C L, Wang J, Qin T R, Li F F, Wang K, Han Y H, Gao C X 2017 J. Phys. Chem. Lett. 8 3648Google Scholar

    [36]

    Liu K H, Zhang L M, Cao T, Jin C H, Qiu D A, Zhou Q, Zettl A, Yang P D, Louie S G, Wang F 2014 Nat. Commun. 5 4966Google Scholar

    [37]

    Zhao Q Y, Guo Y H, Zhou Y X, Xu X, Ren Z Y, Bai J T, Xu X L 2017 J. Phys. Chem. C 121 23744Google Scholar

    [38]

    Feng Y Q, Sun H Y, Sun J H, Shen Y, You Y 2019 Mater. Today Commun. 21 100684Google Scholar

    [39]

    Chi Z H, Chen X L, Yen F, Peng F, Zhou Y H, Zhu J L, Zhang Y J, Liu X D, Lin C L, Chu S Q, Li Y C, Zhao J G, Kagayama T, Ma Y M, Yang Z R 2014 Phys. Rev. Lett. 120 037002

    [40]

    Mao H K, Chen B, Chen J H, Li K, Lin J F, Yang W G, Zheng H Y 2016 Matter Radiat. Extrem. 1 59Google Scholar

  • [1] Zhang Xue-Yang, Hu Wang-Yu, Dai Xiong-Ying. Influence of iron anisotropy on phase transition near grain boundary under shock. Acta Physica Sinica, 2024, 73(3): 036201. doi: 10.7498/aps.73.20231081
    [2] Tian Chun-Ling, Liu Hai-Yan, Wang Biao, Liu Fu-Sheng, Gan Yun-Dan. Phase transition and equation of state of dense liquid nitrogen at high temperature and high pressure. Acta Physica Sinica, 2022, 71(15): 158701. doi: 10.7498/aps.71.20220124
    [3] Song Meng-Ting, Zhang Yue, Huang Wen-Juan, Hou Hua-Yi, Chen Xiang-Bai. Enhancement of two-magnon scattering in annealed nickel oxide studied by Raman spectroscopy. Acta Physica Sinica, 2021, 70(16): 167201. doi: 10.7498/aps.70.20210454
    [4] Xu Xiang, Zhang Ying, Yan Qing, Liu Jing-Jing, Wang Jun, Xu Xin-Long, Hua Deng-Xin. Photochemical properties of rhenium disulfide/graphene heterojunctions with different stacking structures. Acta Physica Sinica, 2021, 70(9): 098203. doi: 10.7498/aps.70.20201904
    [5] Ding Yan, Zhong Yue-Hua, Guo Jun-Qing, Lu Yi, Luo Hao-Yu, Shen Yun, Deng Xiao-Hua. Anisotropic Raman characterization and electrical properties of black phosphorus. Acta Physica Sinica, 2021, 70(3): 037801. doi: 10.7498/aps.70.20201271
    [6] Sun Jian-Ping, Prashant Shahi, Zhou Hua-Xue, Ni Shun-Li, Wang Shao-Hua, Lei He-Chang, Wang Bo-Sen, Dong Xiao-Li, Zhao Zhong-Xian, Cheng Jin-Guang. Effect of high pressure on intercalated FeSe high-Tc superconductors. Acta Physica Sinica, 2018, 67(20): 207404. doi: 10.7498/aps.67.20181319
    [7] Cheng Jin-Guang. Pressure-tuned magnetic quantum critical point and unconventional superconductivity. Acta Physica Sinica, 2017, 66(3): 037401. doi: 10.7498/aps.66.037401
    [8] Song Ping, Cai Ling-Cang, Li Xin-Zhu, Tao Tian-Jiong, Zhao Xin-Wen, Wang Xue-Jun, Fang Mao-Lin. Sound velocity and phase transition for low porosity tin at high pressure. Acta Physica Sinica, 2015, 64(10): 106401. doi: 10.7498/aps.64.106401
    [9] Lu Zhi-Peng, Zhu Wen-Jun, Lu Tie-Cheng, Meng Chuan-Min, Xu Liang, Li Xu-Hai. Structural phase transition of Ru at high pressure and temperature. Acta Physica Sinica, 2013, 62(17): 176402. doi: 10.7498/aps.62.176402
    [10] Zhou Ping, Wang Xin-Qiang, Zhou Mu, Xia Chuan-Hui, Shi Ling-Na, Hu Cheng-Hua. First-principles study of pressure induced phase transition, electronic structure and elastic properties of CdS. Acta Physica Sinica, 2013, 62(8): 087104. doi: 10.7498/aps.62.087104
    [11] Chen Yuan-Zheng, Li Shuo, Li Liang, Men Zhi-Wei, Li Zhan-Long, Sun Cheng-Lin, Li Zuo-Wei, Zhou Mi. Study of phase transition of HoVO4 under high pressure by Raman scattering and ab initio calculations. Acta Physica Sinica, 2013, 62(24): 246101. doi: 10.7498/aps.62.246101
    [12] Yuan Huan-Li, Yuan Bao-He, Li Fang, Liang Er-Jun. Phase transition and thermal expansion properties of ZrV2-xPxO7. Acta Physica Sinica, 2012, 61(22): 226502. doi: 10.7498/aps.61.226502
    [13] Zhou Mi, Li Zhan-Long, Lu Guo-Hui, Li Dong-Fei, Sun Cheng-Lin, Gao Shu-Qin, Li Zuo-Wei. High pressure Raman investigation on the Fermi resonance of biphenyl. Acta Physica Sinica, 2011, 60(5): 050702. doi: 10.7498/aps.60.050702
    [14] Zhou Mi, Zhang Peng, Liu Tie-Cheng, Xu Da-Peng, Jiang Yong-Heng, Gao Shu-Qin, Li Zuo-Wei. Effect of pressure on the Fermi resonance of benzene. Acta Physica Sinica, 2010, 59(1): 210-214. doi: 10.7498/aps.59.210
    [15] Wan Yong, Han Wen-Juan, Liu Jun-Hai, Xia Lin-Hua, Xavier Mateos, Valentin Petrov, Zhang Huai-Jin, Wang Ji-Yang. Anisotropy in spectroscopic and laser properties of monoclinic Yb:KLu(WO4)2 crystal. Acta Physica Sinica, 2009, 58(1): 278-284. doi: 10.7498/aps.58.278.1
    [16] Cai Li, Han Xiao-Yun, Wen Xi-Sen. The elastic wave propagation in two-dimensional phononic crystal at low frequencies and the anisotropy of effective velocity. Acta Physica Sinica, 2008, 57(3): 1746-1752. doi: 10.7498/aps.57.1746
    [17] Wang Hui, Liu Jin-Fang, He Yan, Chen Wei, Wang Ying, Gerward L., Jiang Jian-Zhong. Size-induced enhancement of bulk modulus and transition pressure of nanocrystalline Ge. Acta Physica Sinica, 2007, 56(11): 6521-6525. doi: 10.7498/aps.56.6521
    [18] Mu Quan-Quan, Liu Yong-Jun, Hu Li-Fa, Li Da-Yu, Cao Zhao-Liang, Xuan Li. Determination of anisotropic liquid crystal layer parameters by spectroscopic ellipsometer. Acta Physica Sinica, 2006, 55(3): 1055-1060. doi: 10.7498/aps.55.1055
    [19] Zhuang Fei, Xiao San-Shui, Shang Lian-Ju, He Sai-Ling. . Acta Physica Sinica, 2002, 51(9): 2167-2172. doi: 10.7498/aps.51.2167
    [20] . Acta Physica Sinica, 2002, 51(2): 355-361. doi: 10.7498/aps.51.355
Metrics
  • Abstract views:  7242
  • PDF Downloads:  160
Publishing process
  • Received Date:  09 January 2022
  • Accepted Date:  17 March 2022
  • Available Online:  13 July 2022
  • Published Online:  20 July 2022

/

返回文章
返回