


-
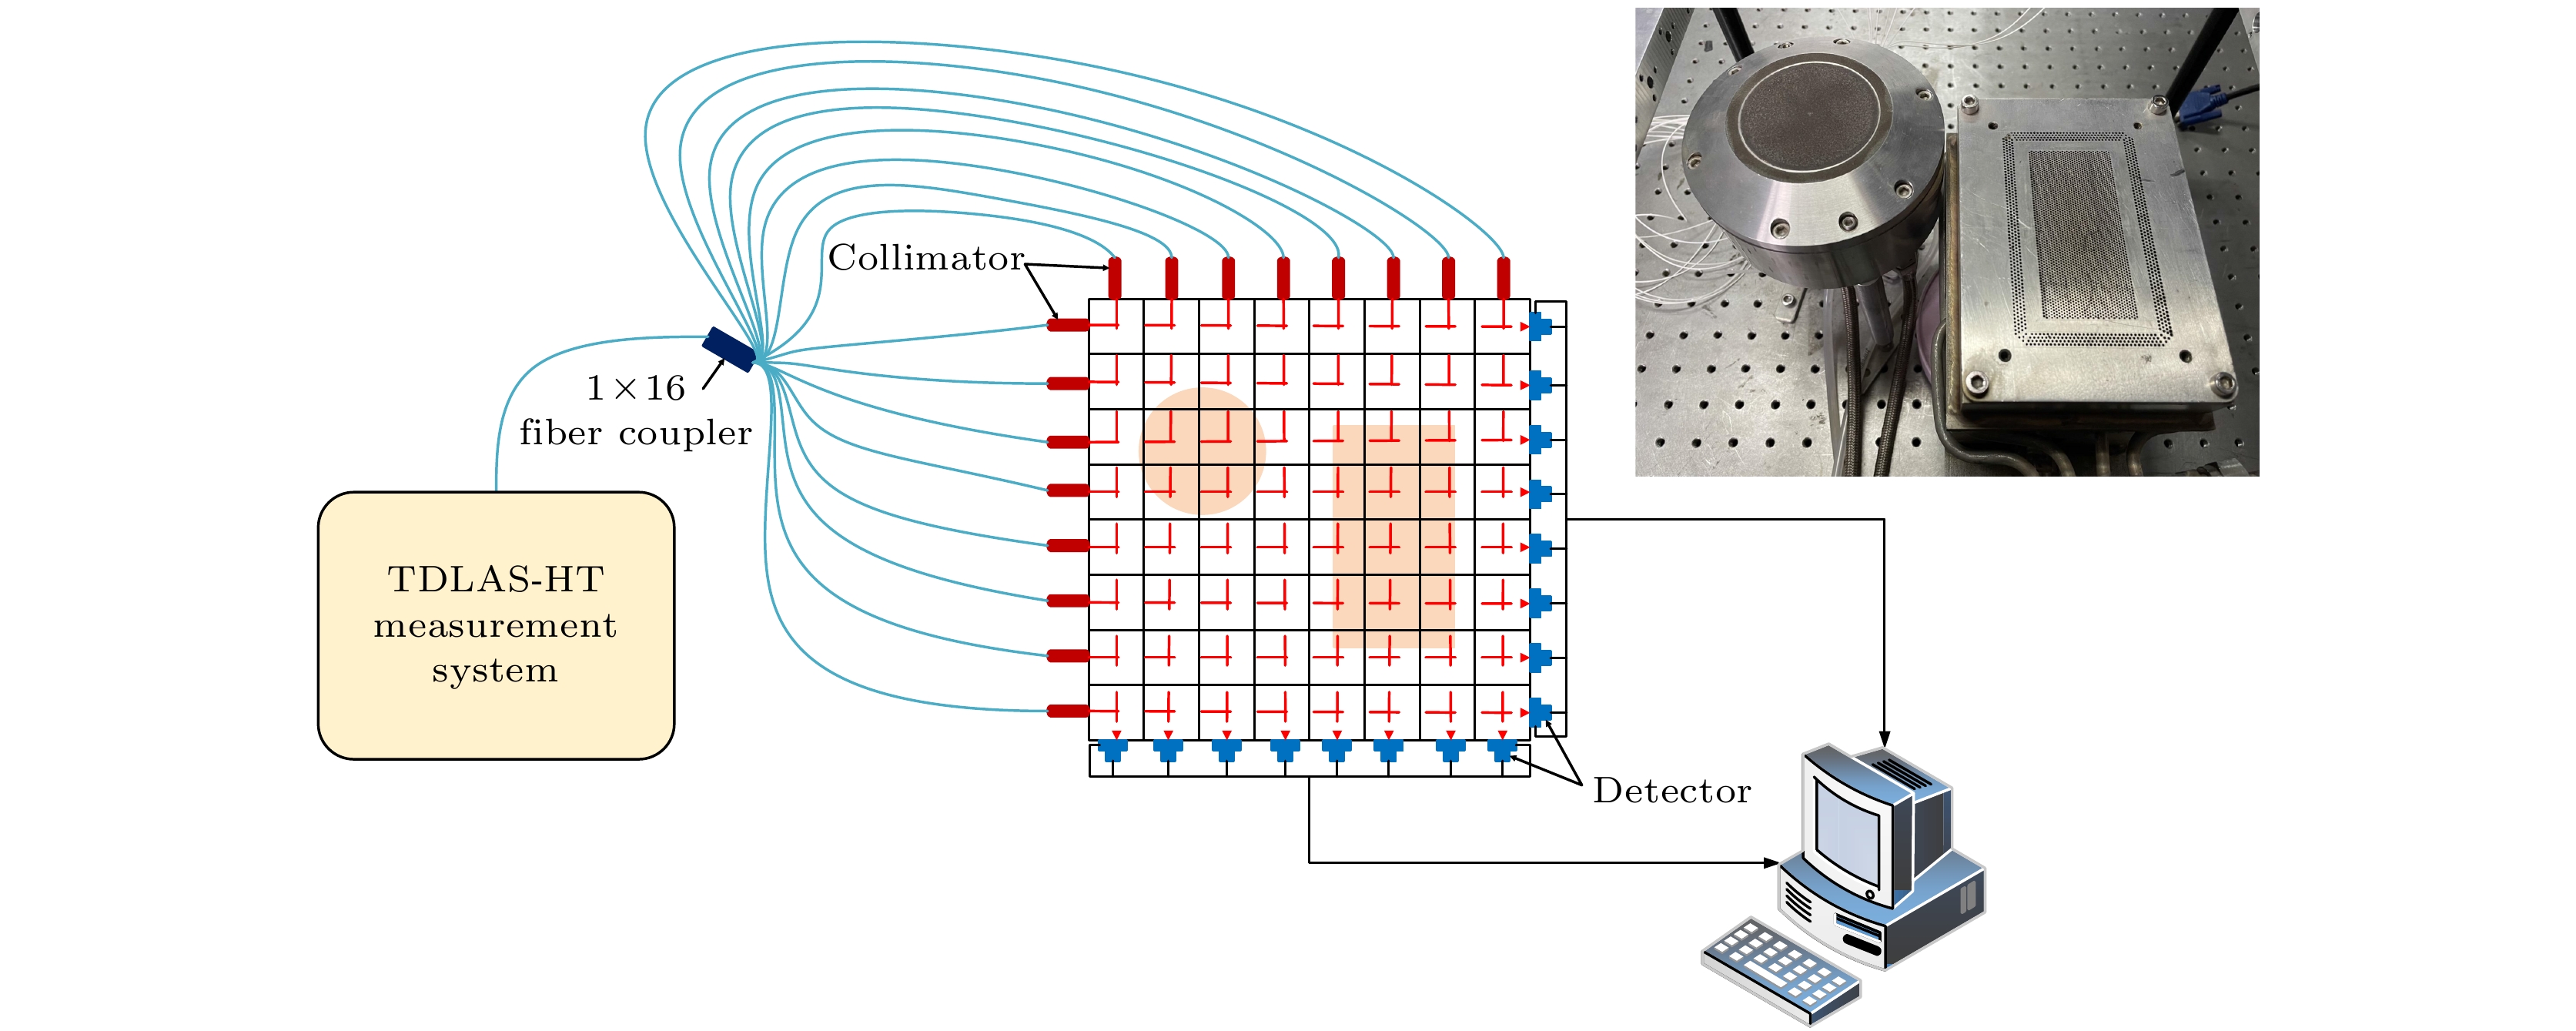
本文研究了选取不同谱线组合对非均匀燃烧场分布重建精度的影响, 并针对传统模拟退火算法收敛速度慢、运行效率不高的问题, 提出了一种改进的模拟退火算法(ISA算法)用于燃烧流场的场分布重建. 通过改变算法的模型扰动及退火方式, 大大提高了算法的运行效率. 数值仿真模拟结果显示, 纳入更多的谱线有助于提高燃烧场重建的精度和降低重建对噪声的敏感性. 相较于传统模拟退火算法, 改进模拟退火算法在精度一致的前提下, 将运行效率提升了近40倍. 利用改进模拟退火算法在实验室平焰炉上重建了两种不同燃烧状态, 重建分布与原始分布基本一致. 通过数值仿真与实际实验, 验证了该方法的有效性, 对高光谱重建燃烧流场的温度浓度分布具有一定的指导意义.In this paper, a method of selecting the optimal transition lines’ combination is analyzed to measure the absorption spectrum of the non-uniform combustion flow field, which is used to solve the basic two-region distribution, and an improved simulated annealing algorithm (ISA) is proposed for reconstructing the field distribution of the combustion flow field, in order to solve the problems of slow convergence speed and low efficiency of the traditional simulated annealing algorithm. By modifying the model perturbation mode and annealing strategy, the efficiency of the algorithm and the chance to jump out of the local optimal space are further improved. According to the numerical simulation results, more transitions are helpful in improving the accuracy of combustion field reconstruction and making the reconstruction less sensitive to noise. It is worth noting that the optimal transitions’ combination is better than the non-optimal transitions’ combination with more transitions included. In this paper, three different combustion models are constructed to verify the effectiveness of the improved algorithm. A comparison between the reconstruction results of the traditional simulated annealing algorithm and the improved simulated annealing algorithm shows that both algorithms have the same precision but the latter algorithm has a higher operating efficiency, and a faster running time (nearly 40 times faster than the former algorithm). At the same time, the simulation results also show that the reconstruction accuracy will decrease slightly with the complication of combustion flow field. By building the TDLAS-HT measurement system in the laboratory and using 8 × 8 orthogonal optical path arrangement, the two different combustion states formed before and after placing the steel rod in the flat flame furnace are reconstructed, the results show that the reconstruction distribution is basically consistent with the original distribution, and the reconstructed distribution well shows the combustion characteristics of the original distribution of the flame field. The effectiveness of the proposed method is verified by numerical simulation and verification tests. Under the condition of the same reconstruction accuracy as the reconstruction accuracy of the traditional simulated annealing algorithm, the higher operating efficiency is helpful in reconstructing the rapidly changing turbulent field, which has some guiding significance for the hyperspectral reconstruction of temperature and concentration distribution in the combustion flow field.
-
Keywords:
- combination of transition lines /
- field distribution reconstruction /
- simulated annealing algorithm /
- hyperspectral
[1] Gustafsson U, Sandsten J, Svanberg S 2000 Appl. Phys. B 71 853
 Google Scholar
[2] Li H J, Farooq A, Jeffries J B, Hanson R K 2007 Appl. Phys. B 89 407
Google Scholar
[3] 李宁 2008 博士学位论文 (杭州: 浙江大学)
Li N 2008 Ph. D. Dissertation (Hangzhou: Zhejiang University) (in Chinese)
[4] 张春晓, 王飞, 李宁, 严建华, 池涌, 岑可法 2009 光谱学与光谱分析 29 2597
Google Scholar
Zhang C X, Wang F, Li N, Yan J H, Chi Y, Cen K F 2009 Spectrosc. Spect. Anal. 29 2597
Google Scholar
[5] Li C G, Dong L, Zheng C T, Frank K T 2016 Sensor. Actuat. B: Chem. 232 188
Google Scholar
[6] Ma Y F, Qiao S D, He Y, Li Y, Zhang Z H, Yu X, Frank K T 2019 Opt. Express 27 14163
Google Scholar
[7] Jiang Y L, Li G, Yang T, Wang J J 2017 IOP. Conf. Ser. Earth Environ. Sci. 52 012092
Google Scholar
[8] Hodgkinson J, Ralph P T 2013 Meas. Sci. Technol. 24 012004
Google Scholar
[9] Liu J T C, Jeffries J B, Hanson R K 2004 Appl. Phys. B 78 503
Google Scholar
[10] Torniainen E D, Hinz A K, Gouldin F C 1998 AIAA. J. 36 1270
Google Scholar
[11] Lindstrom C, Tam C J, Davis D, Eklund D, Williams S 2007 AIAA. 43 2007
[12] Gillet B, Hardalupas Y, Kavounides C, Taylor A M K P 2004 J. Appl. Therm. Eng. 24 1633
Google Scholar
[13] Ma L, Cai W W, Caswell A W, Kraetschmer T, Sanders S T, Roy S, Gord J R 2009 Opt. Express 17 8602
Google Scholar
[14] Paul E, Dai J H, Seamus O, Lu H C, Cai W W 2017 Appl. Phys. Lett. 111 184102
Google Scholar
[15] Cai W W, Ma L 2008 Appl. Opt. 47 3751
Google Scholar
[16] 李根 2014 硕士学位论文 (南京: 东南大学)
Li G 2014 M. S. Thesis (Nanjing: Southeast University) (in Chinese)
[17] Ma L, Li X S, Cai W W, Roy S, Jams R G, Scott T S 2010 Appl. Spectrosc. 64 1274
Google Scholar
[18] Caswell A W 2009 Ph. D. Dissertation (America: University of Wisconsin-Madison)
[19] Corana A, Marchesi M, Martini C, Ridella S 1987 ACM 13 262
Google Scholar
[20] 卢宇婷, 林禹攸, 彭乔姿, 王颖喆 2015 大学数学 31 97
Google Scholar
Lu Y T, Lin Y Y, Peng Q Z, Wang Y Z 2015 Coll. Math. 31 97
Google Scholar
-
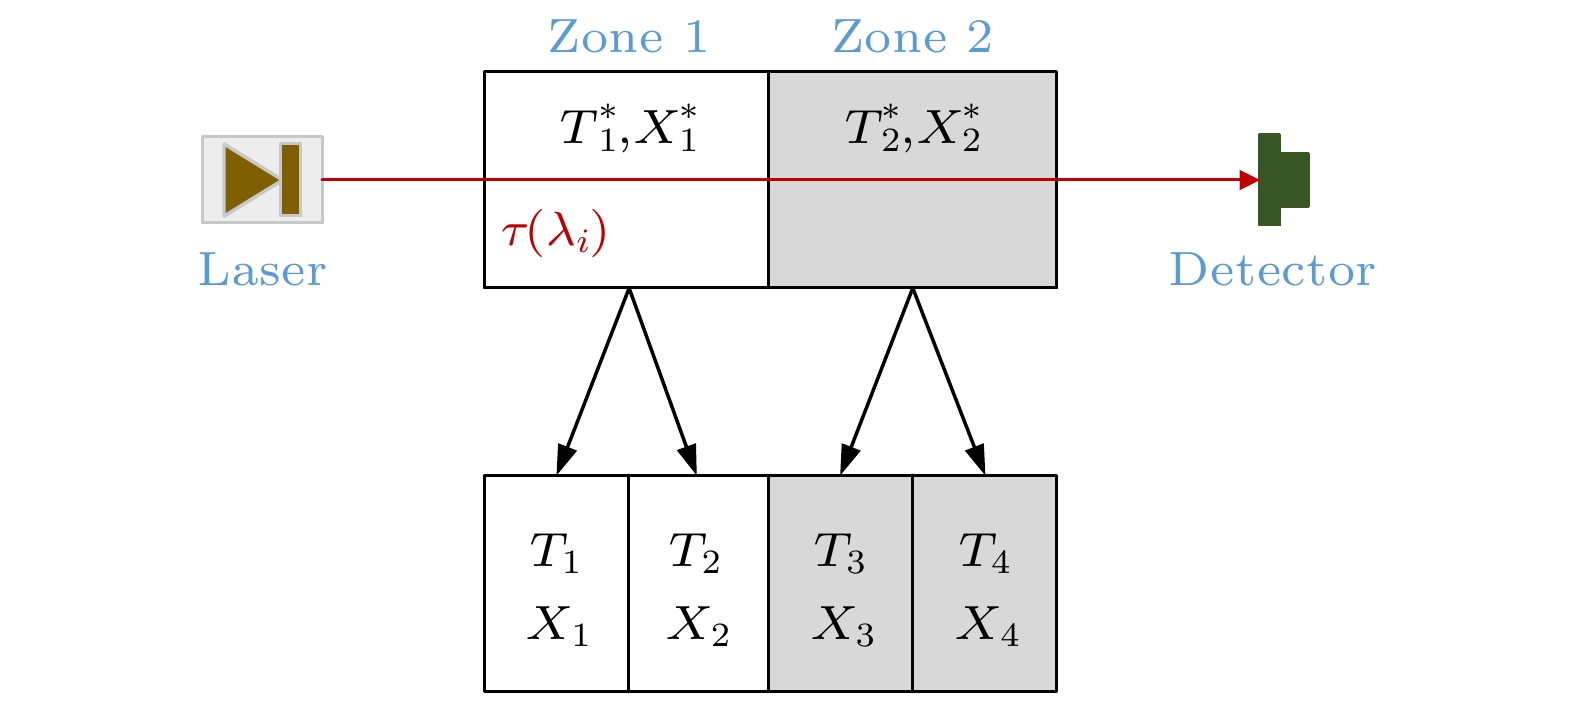
图 2 基本的二区分布及其进一步划分
Fig. 2. The basic simple two-zone distribution and its further division.
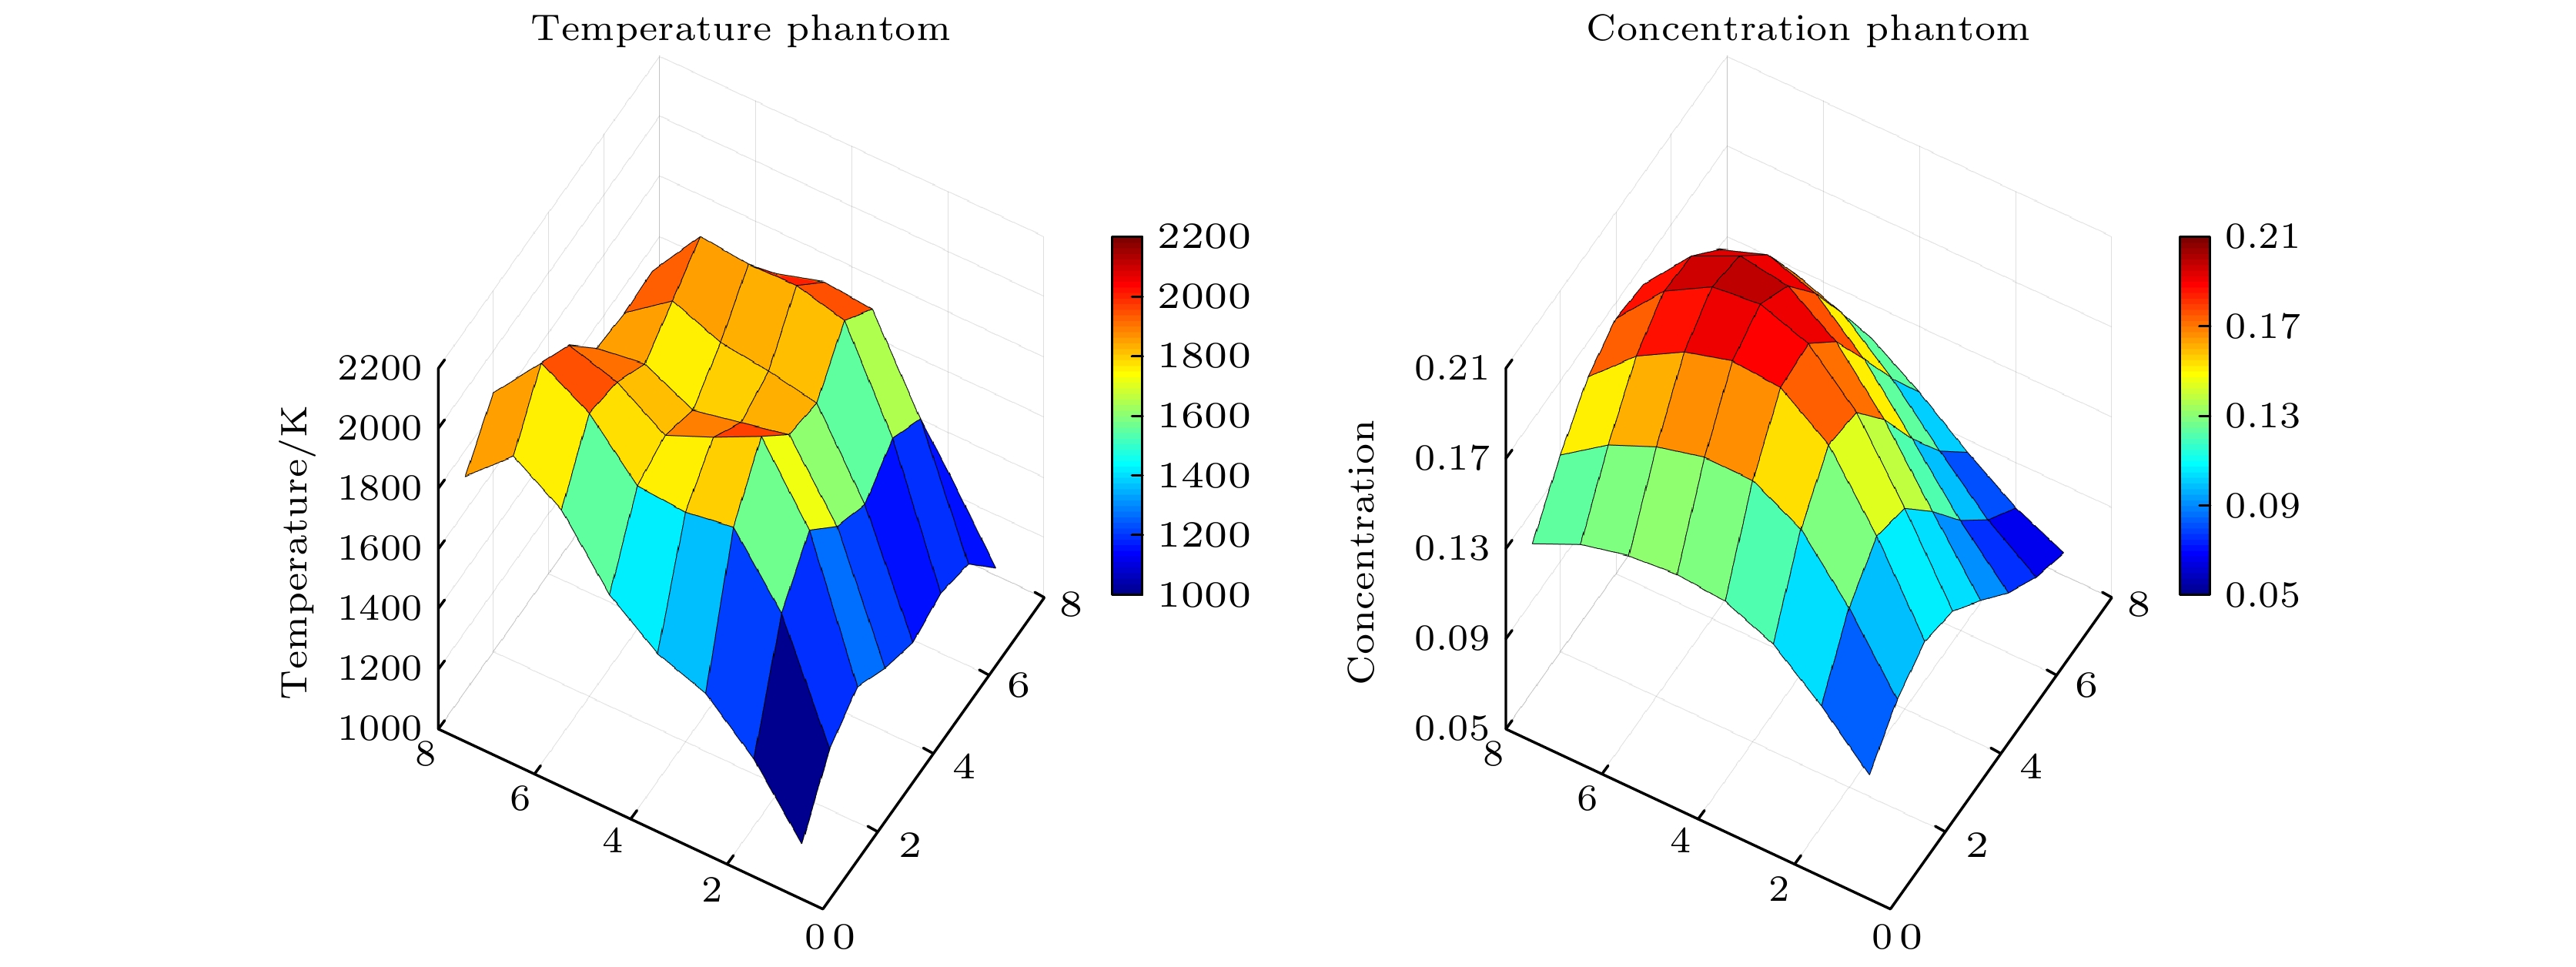
图 3 模拟的燃烧流场的温度和浓度分布
Fig. 3. Temperature and concentration distribution of simulated combustion flow field.
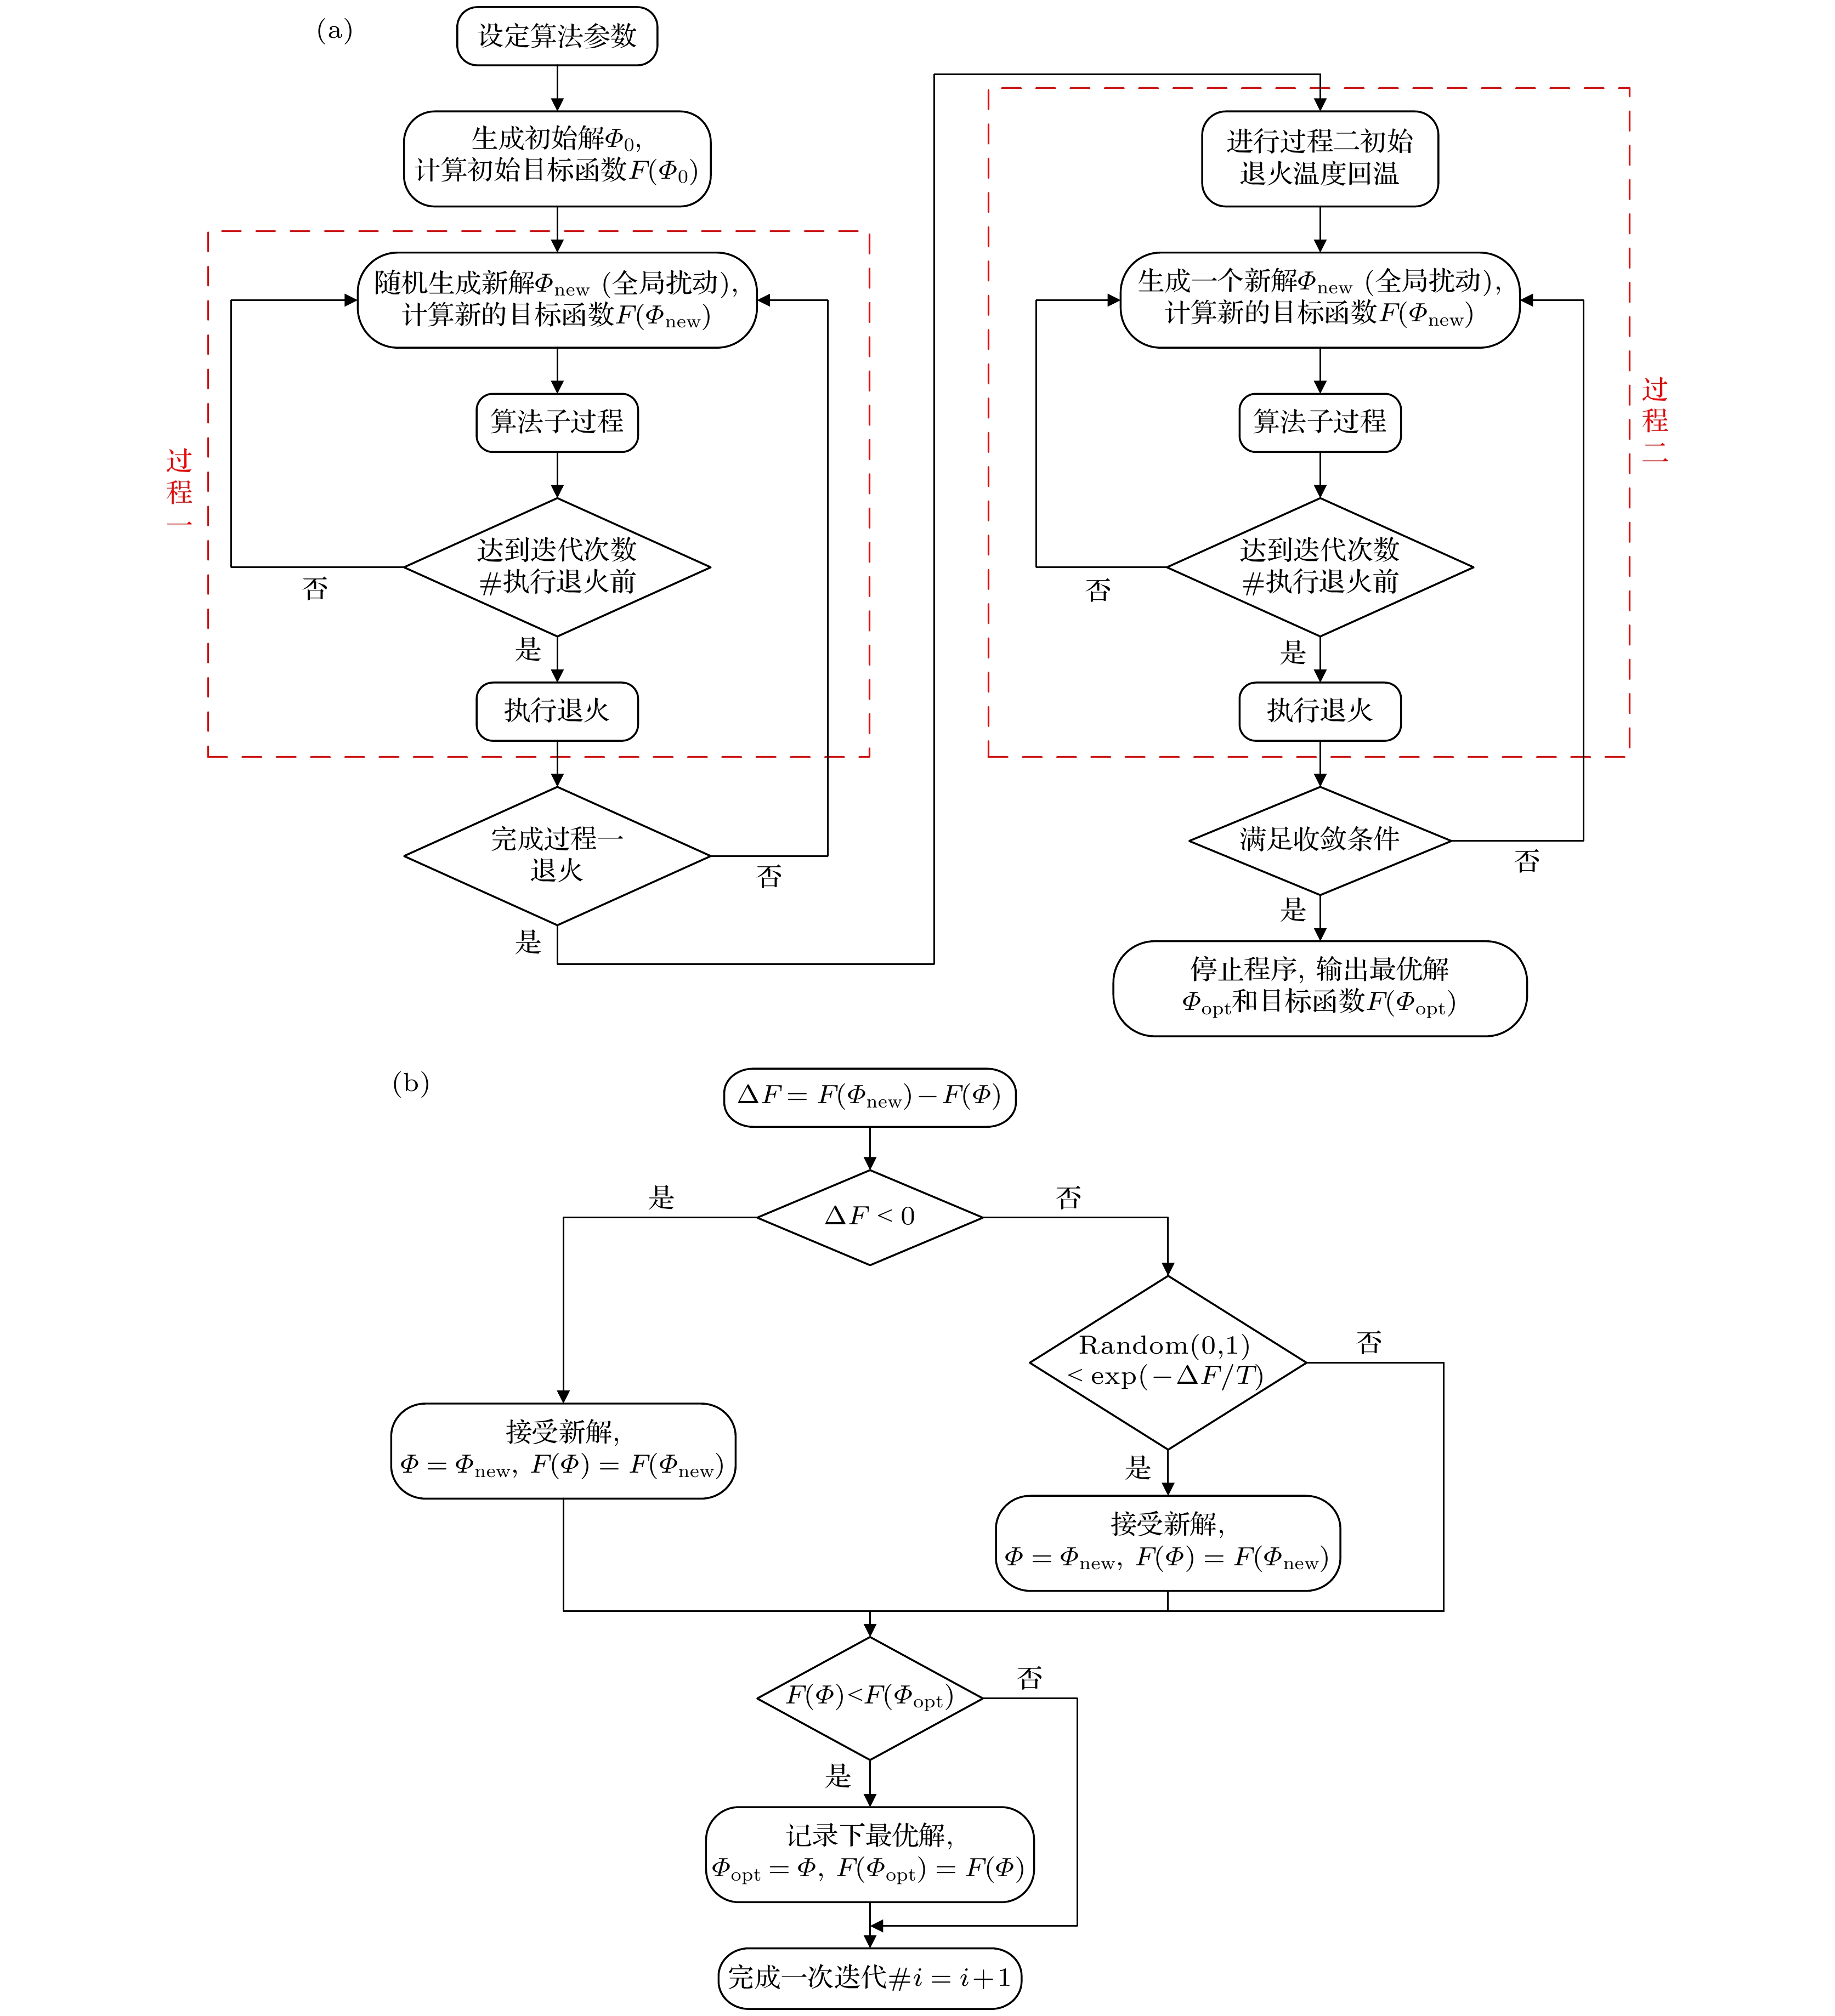
图 5 两段式模拟退火算法流程图 (a) 算法主流程; (b) 算法子过程
Fig. 5. Flow chart of two-stage simulated annealing algorithm: (a) Main flow of algorithm; (b) subprocess of algorithm.
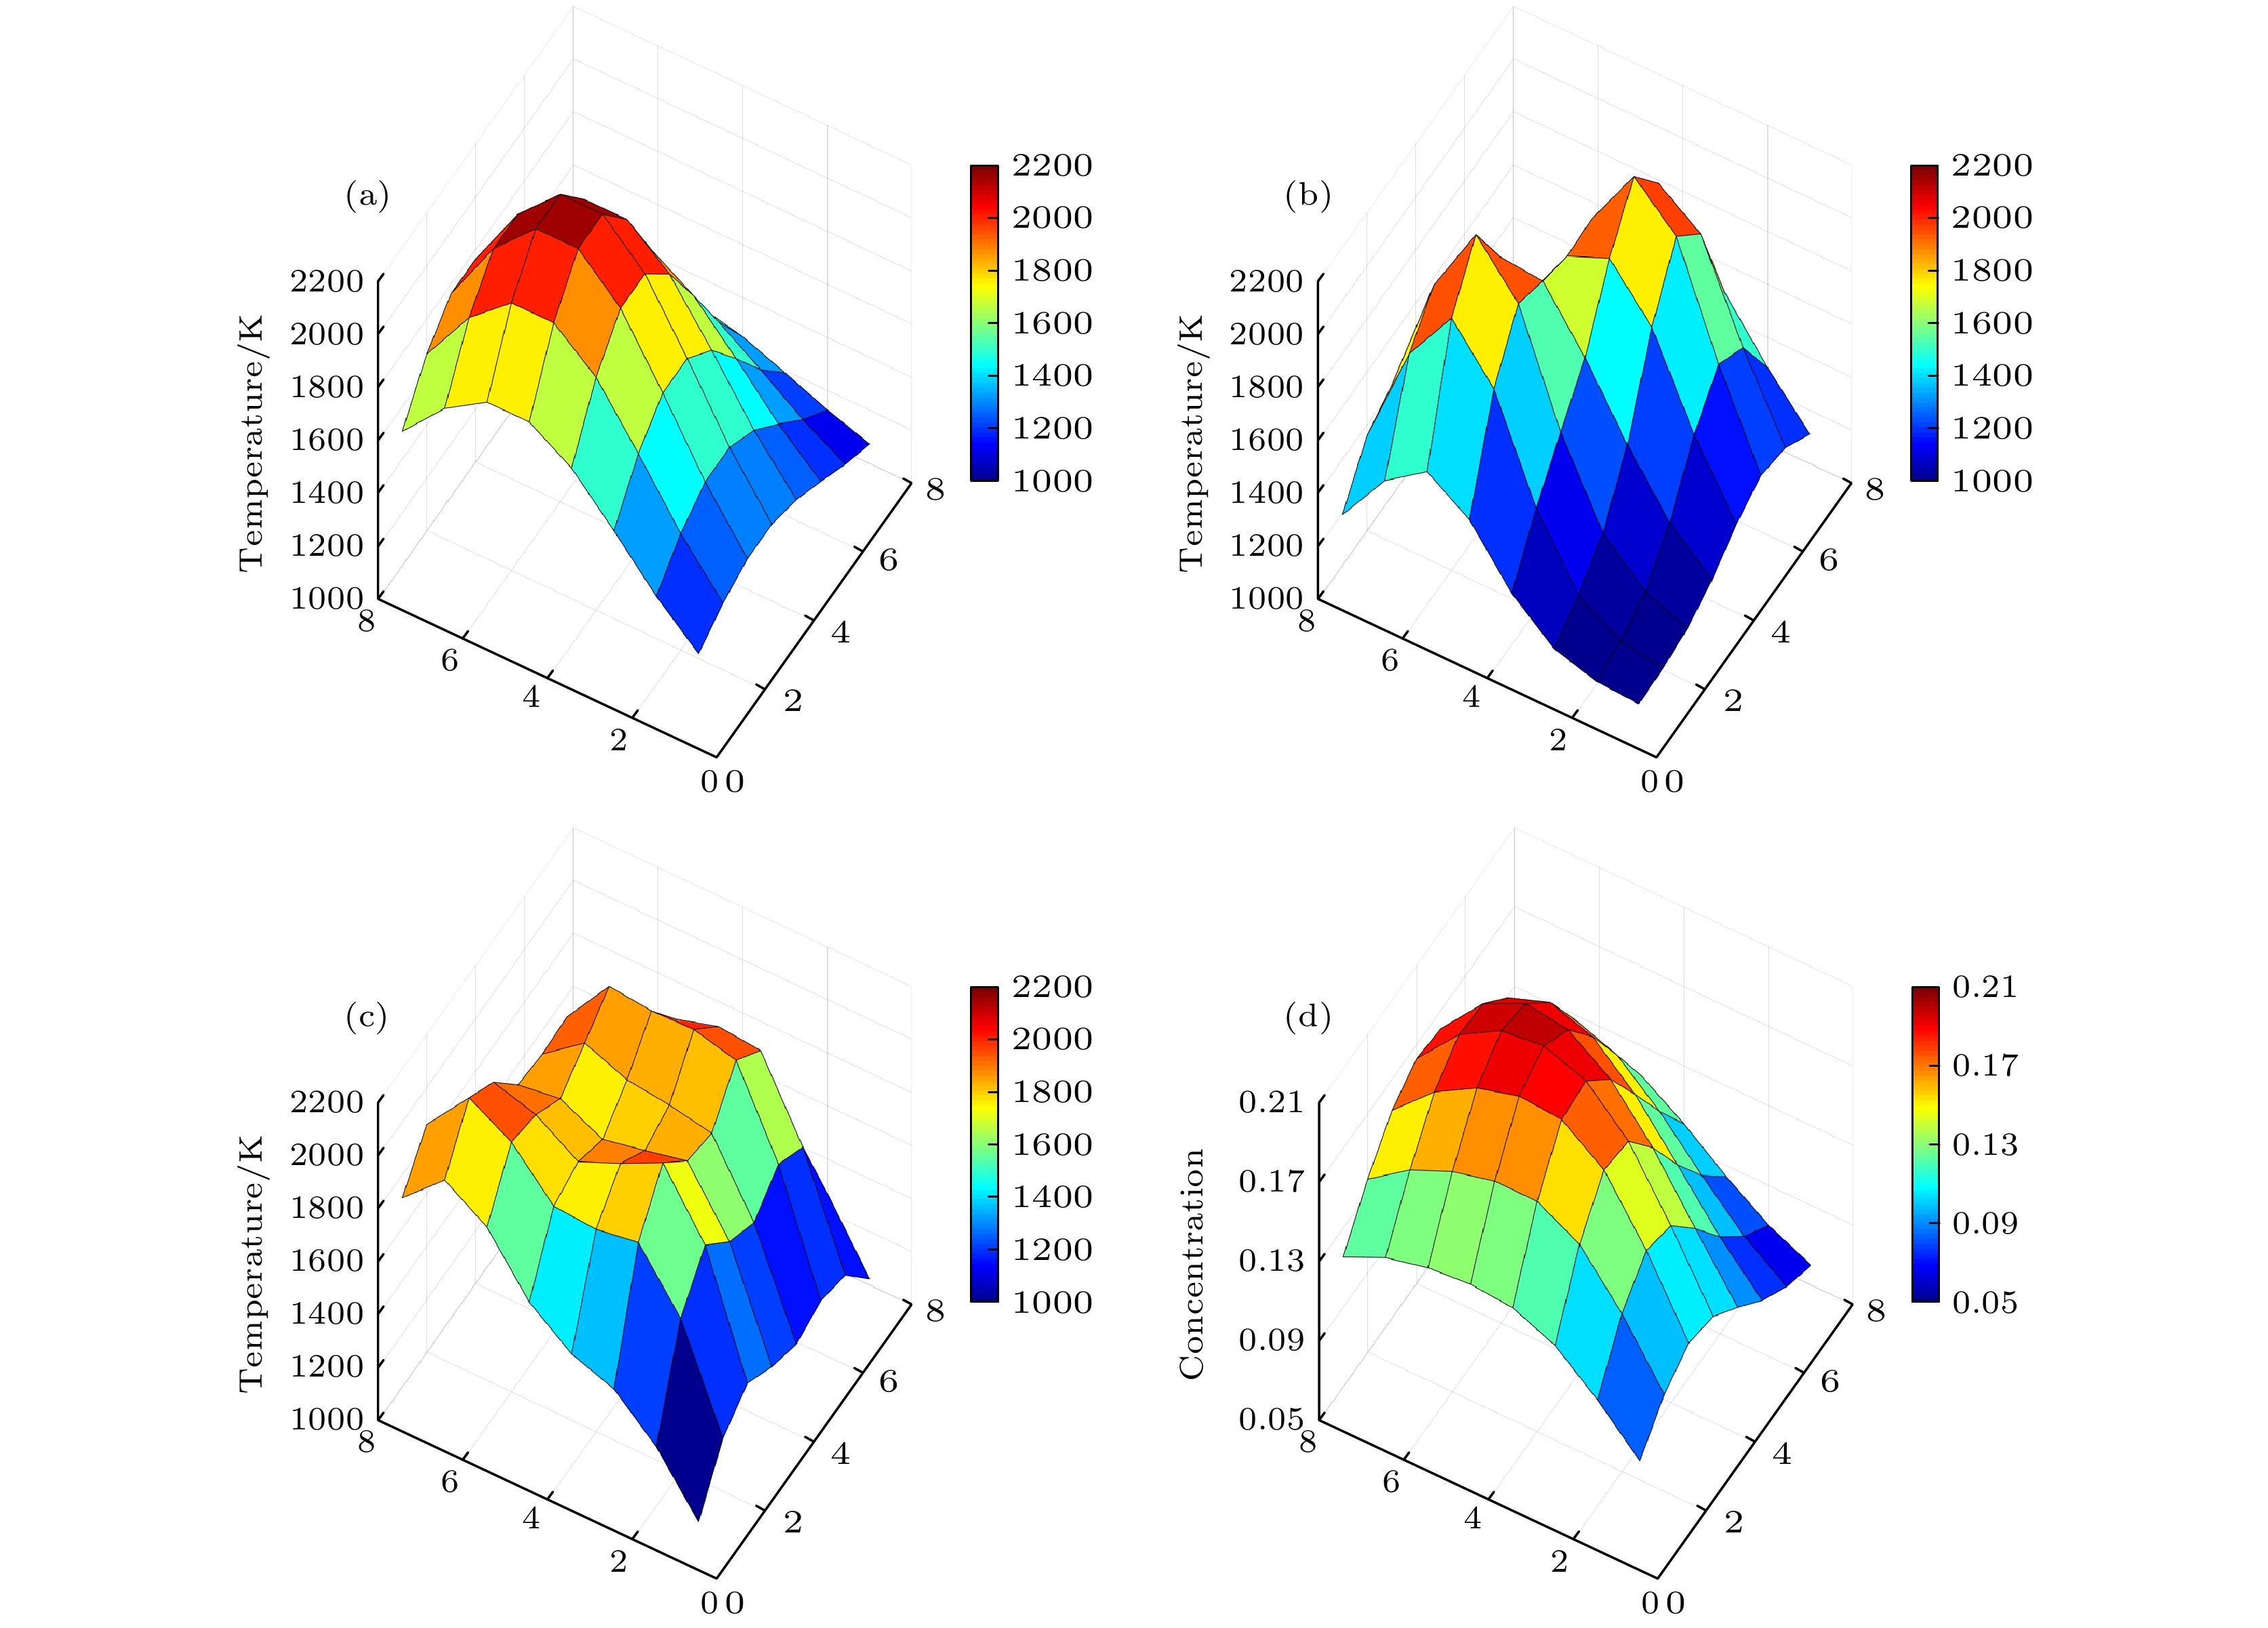
图 8 三种不同模态燃烧场分布 (a) 单高斯峰; (b) 双高斯峰; (c) 多高斯峰; (d) 浓度分布
Fig. 8. Three different modes of combustion field distribution: (a) Single Gaussian peak; (b) two Gaussian peaks; (c) multiple Gaussian peaks; (d) concentration distribution.
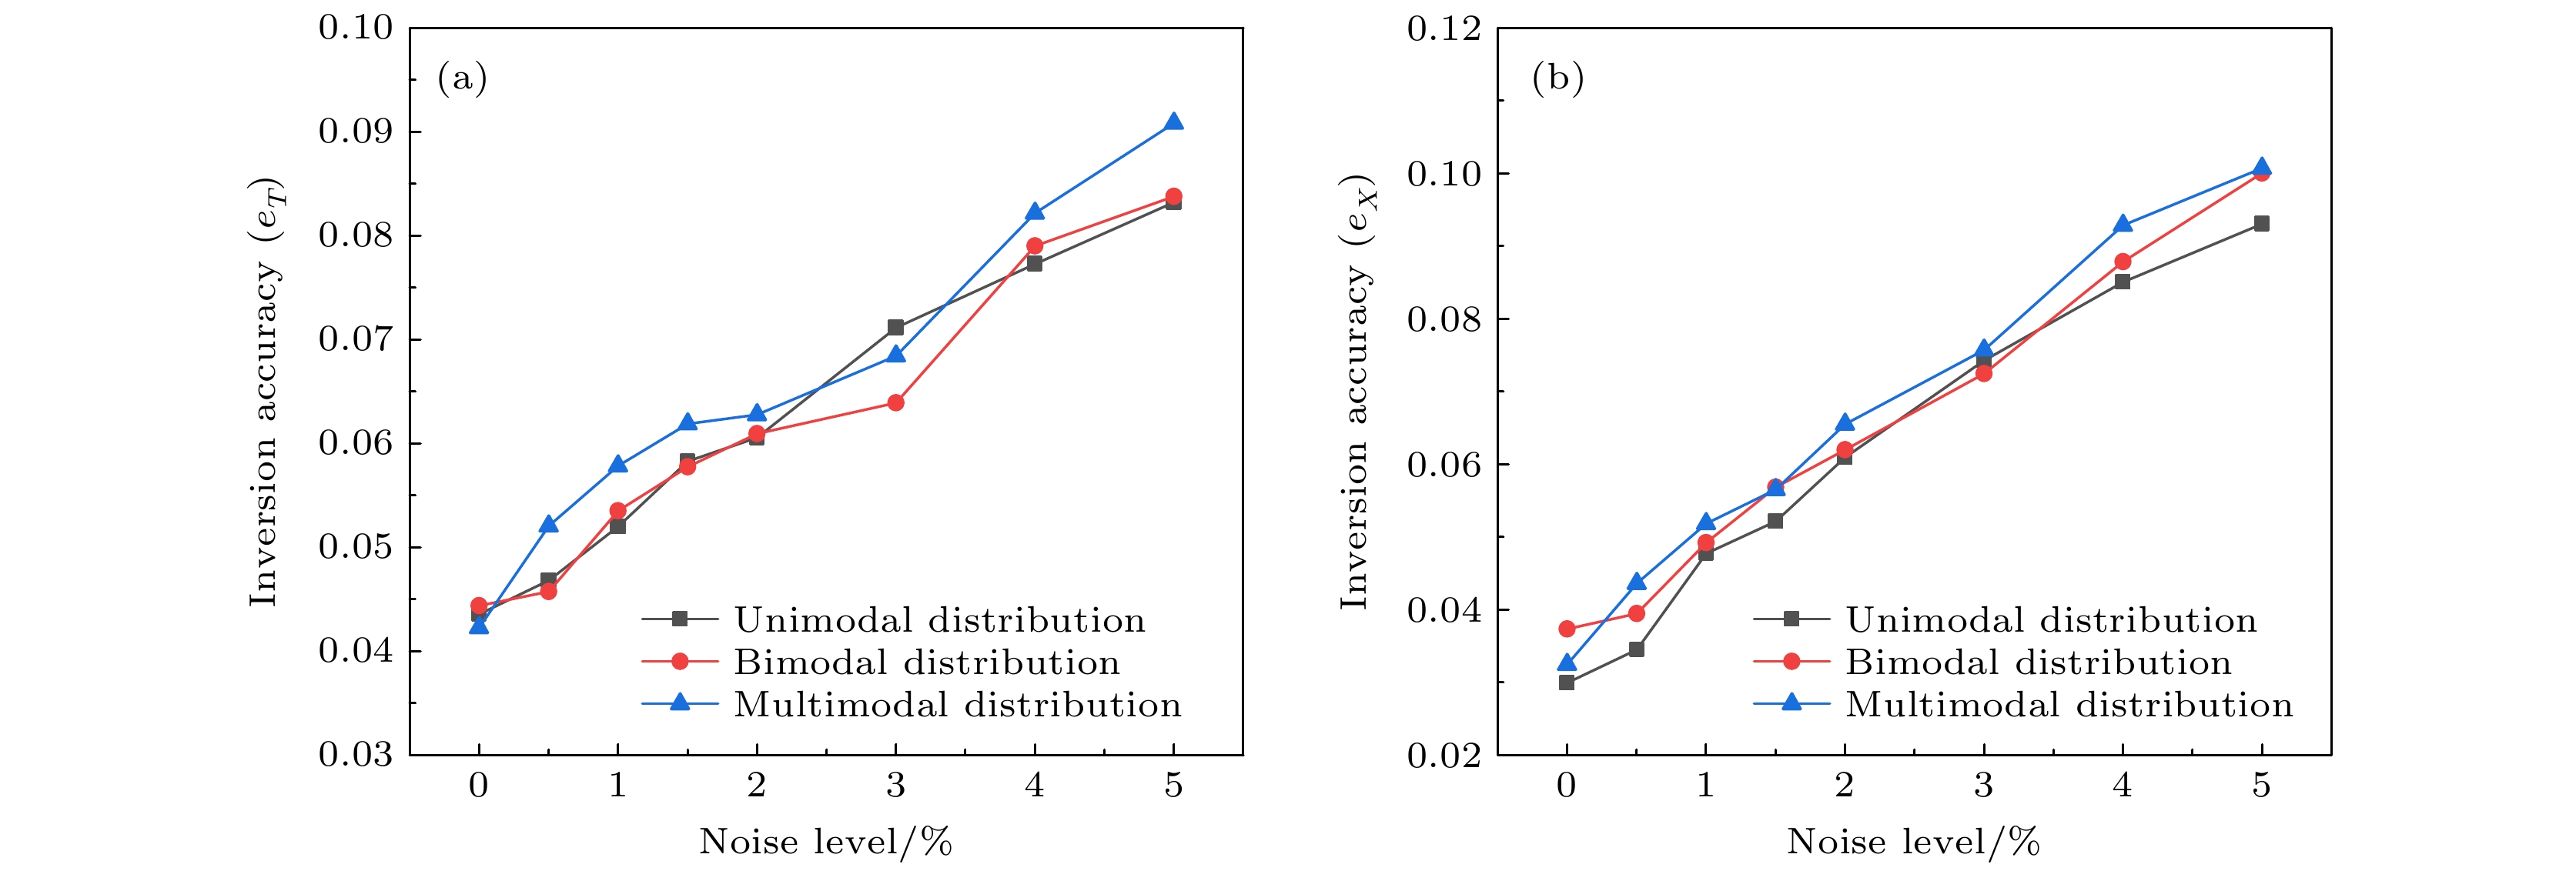
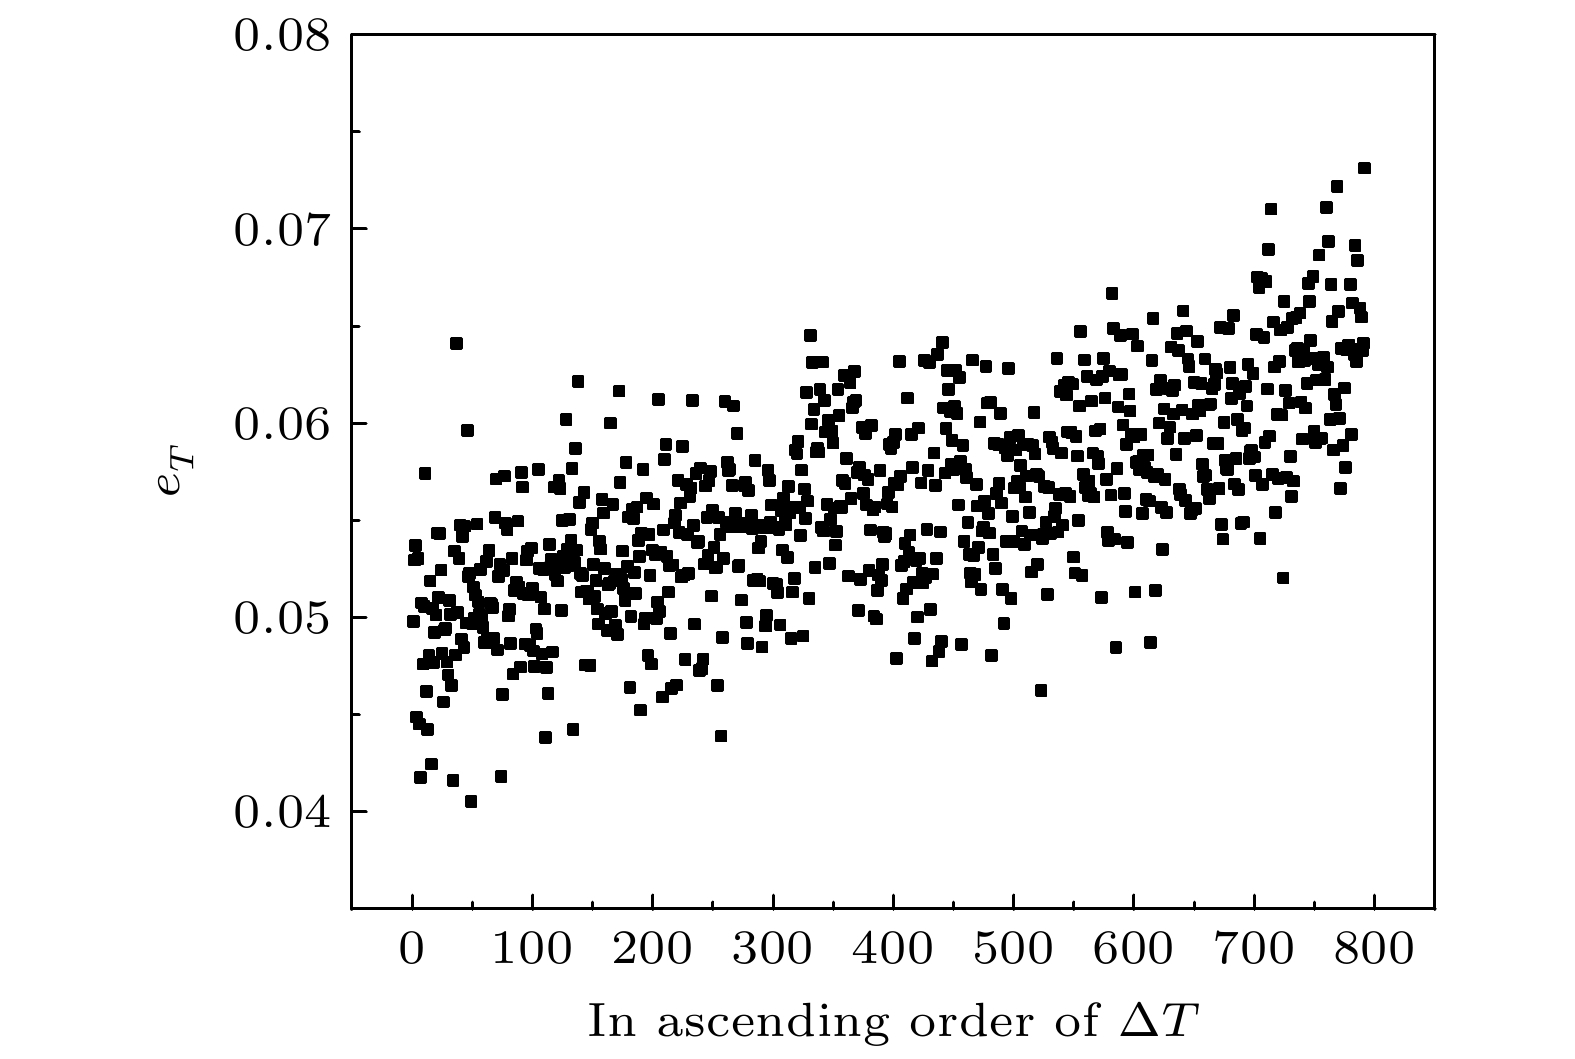
图 9 三种不同模态燃烧流场的温度浓度反演精度
Fig. 9. The inversion accuracy of three different modes of combustion field distribution.
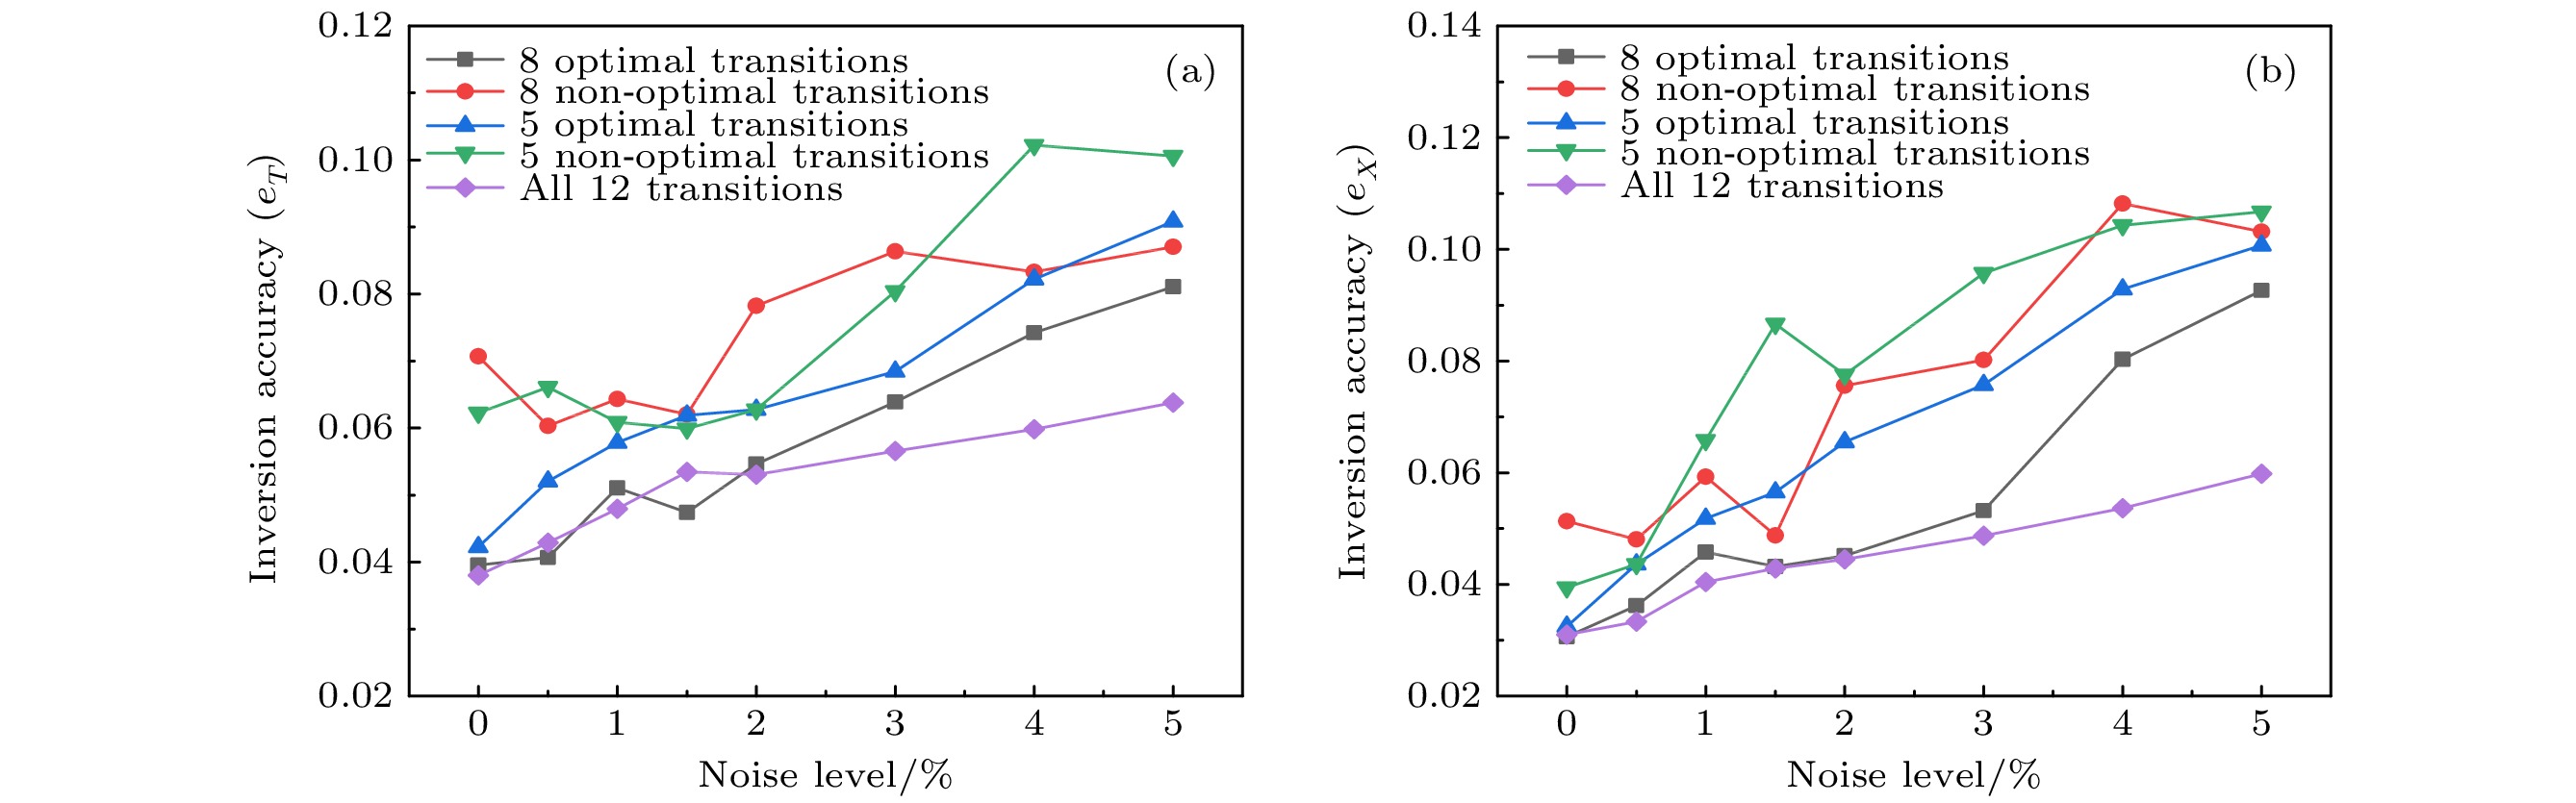
图 10 最优5条、8条谱线组合和非最优5条、8条谱线组合以及所有12条谱线在不同噪声水平下温度浓度的反演精度
Fig. 10. The inversion accuracy of the optimal 5, 8 transition lines combinations, the non-optimal 5, 8 transition lines combinations and all 12 transition lines combinations under different noise levels.
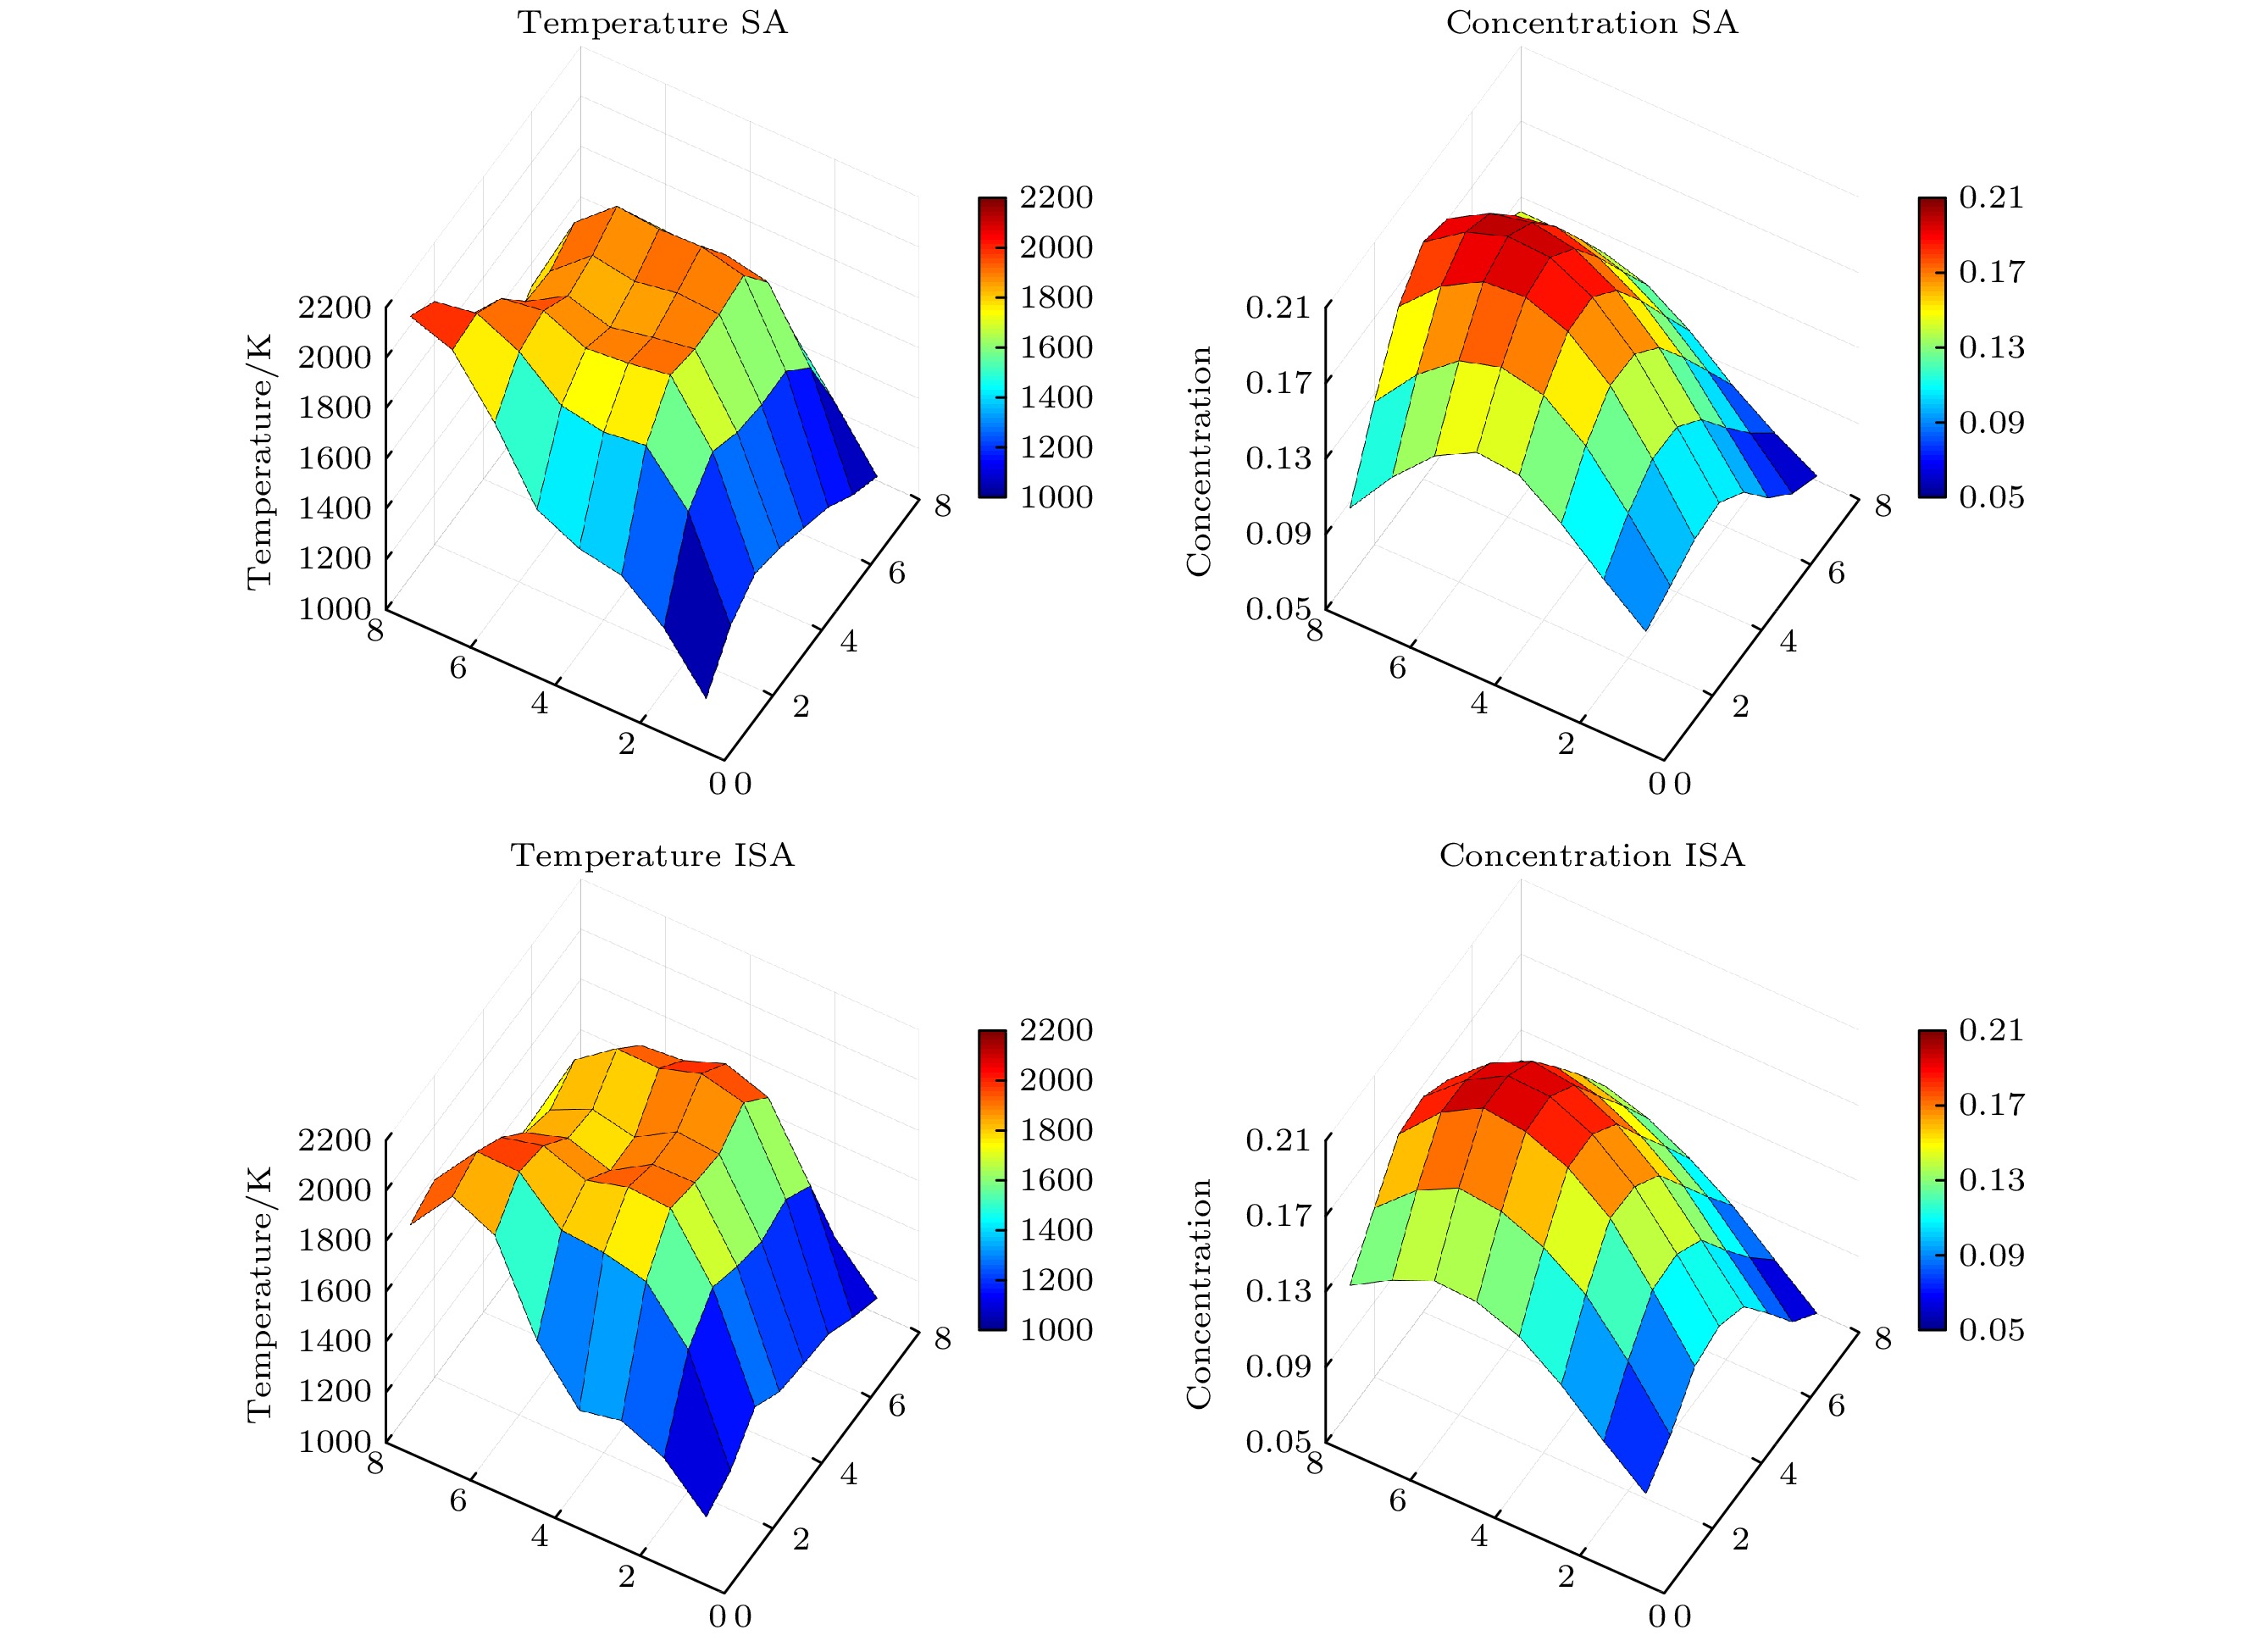
图 11 零噪声水平下两种算法重建结果对比, 上面板为传统模拟退火算法重建结果, 下面板为改进模拟退火算法重建结果
Fig. 11. Under zero noise level, the reconstruction results of two algorithms. Top: SA algorithm reconstruction results, Bottom: ISA algorithm reconstruction results.
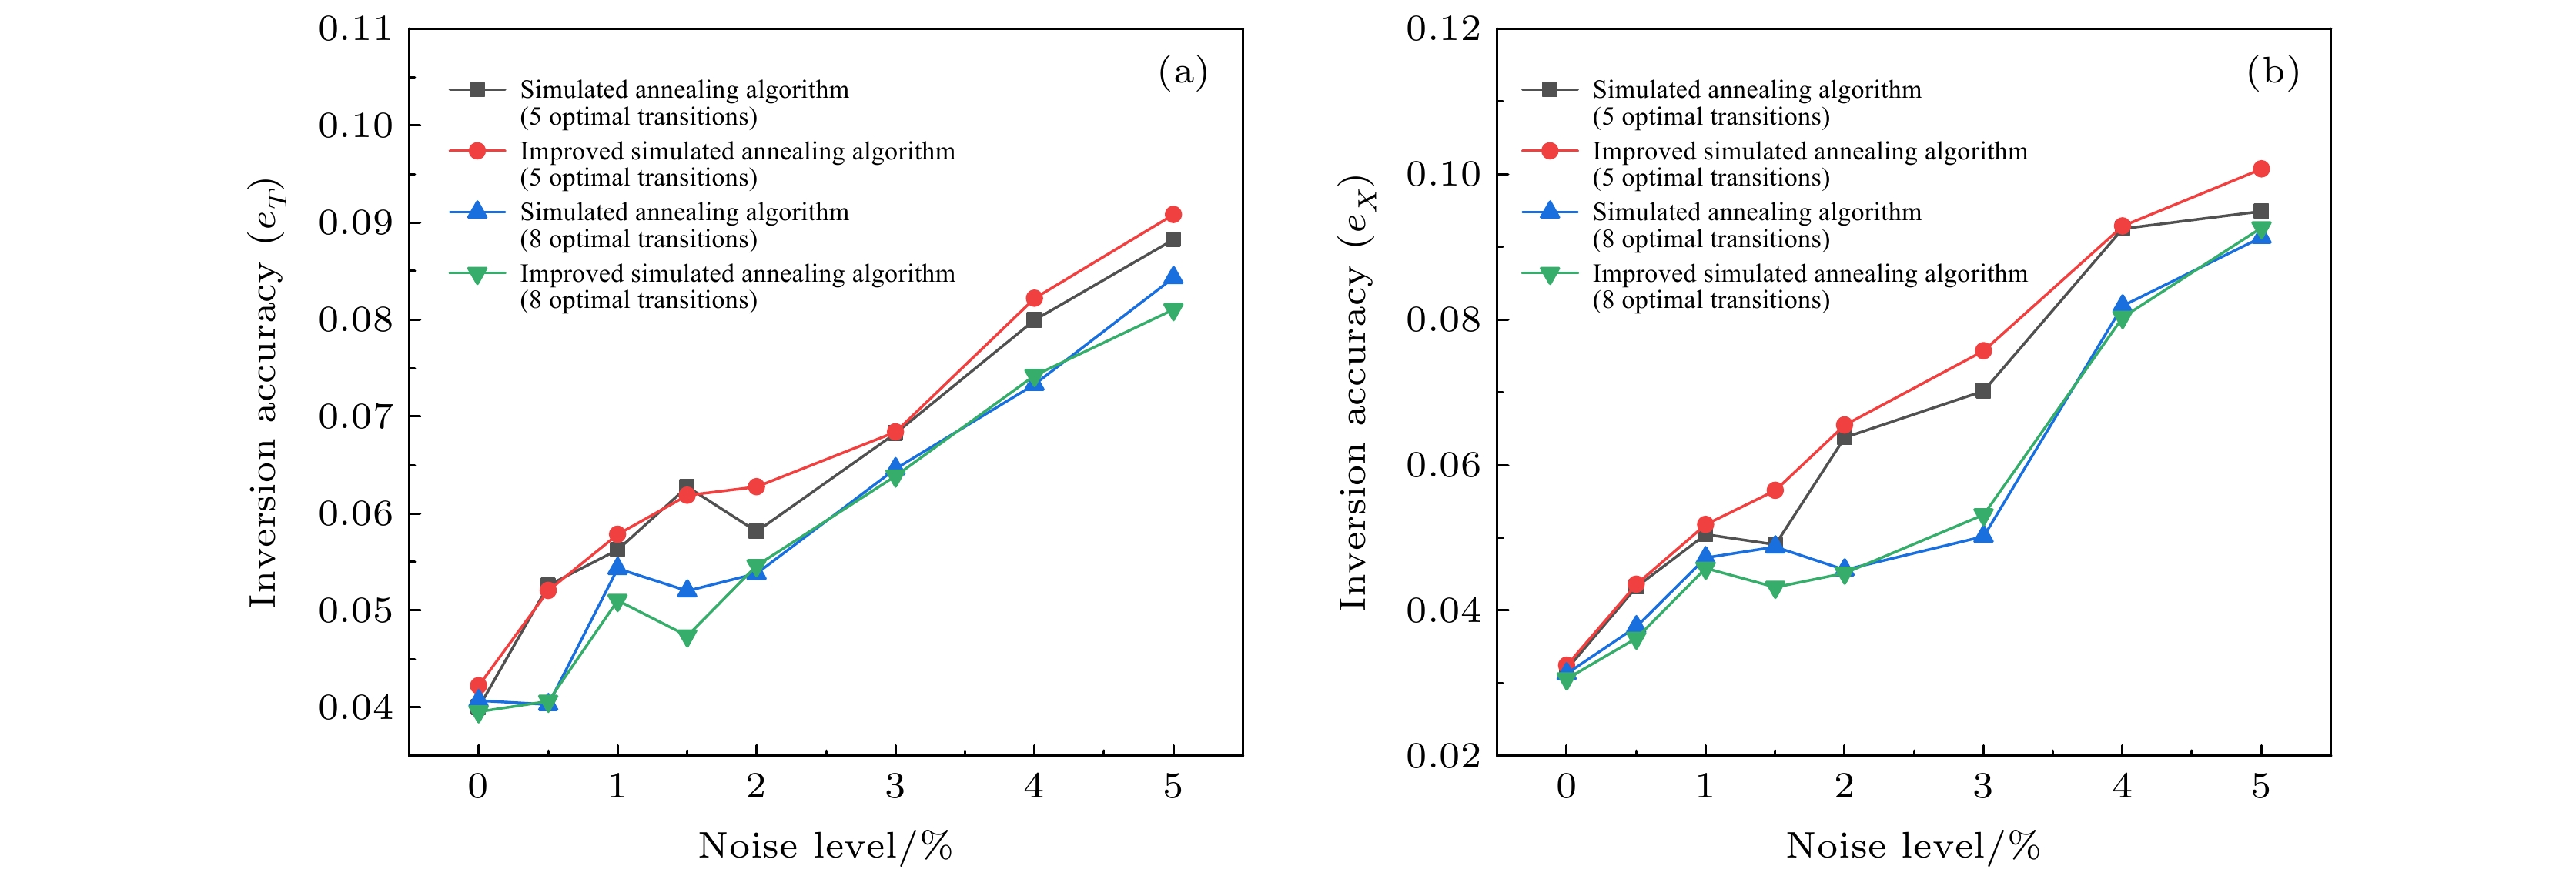
图 12 两种算法的重建精度对比
Fig. 12. Comparison of reconstruction accuracy between the two algorithms.
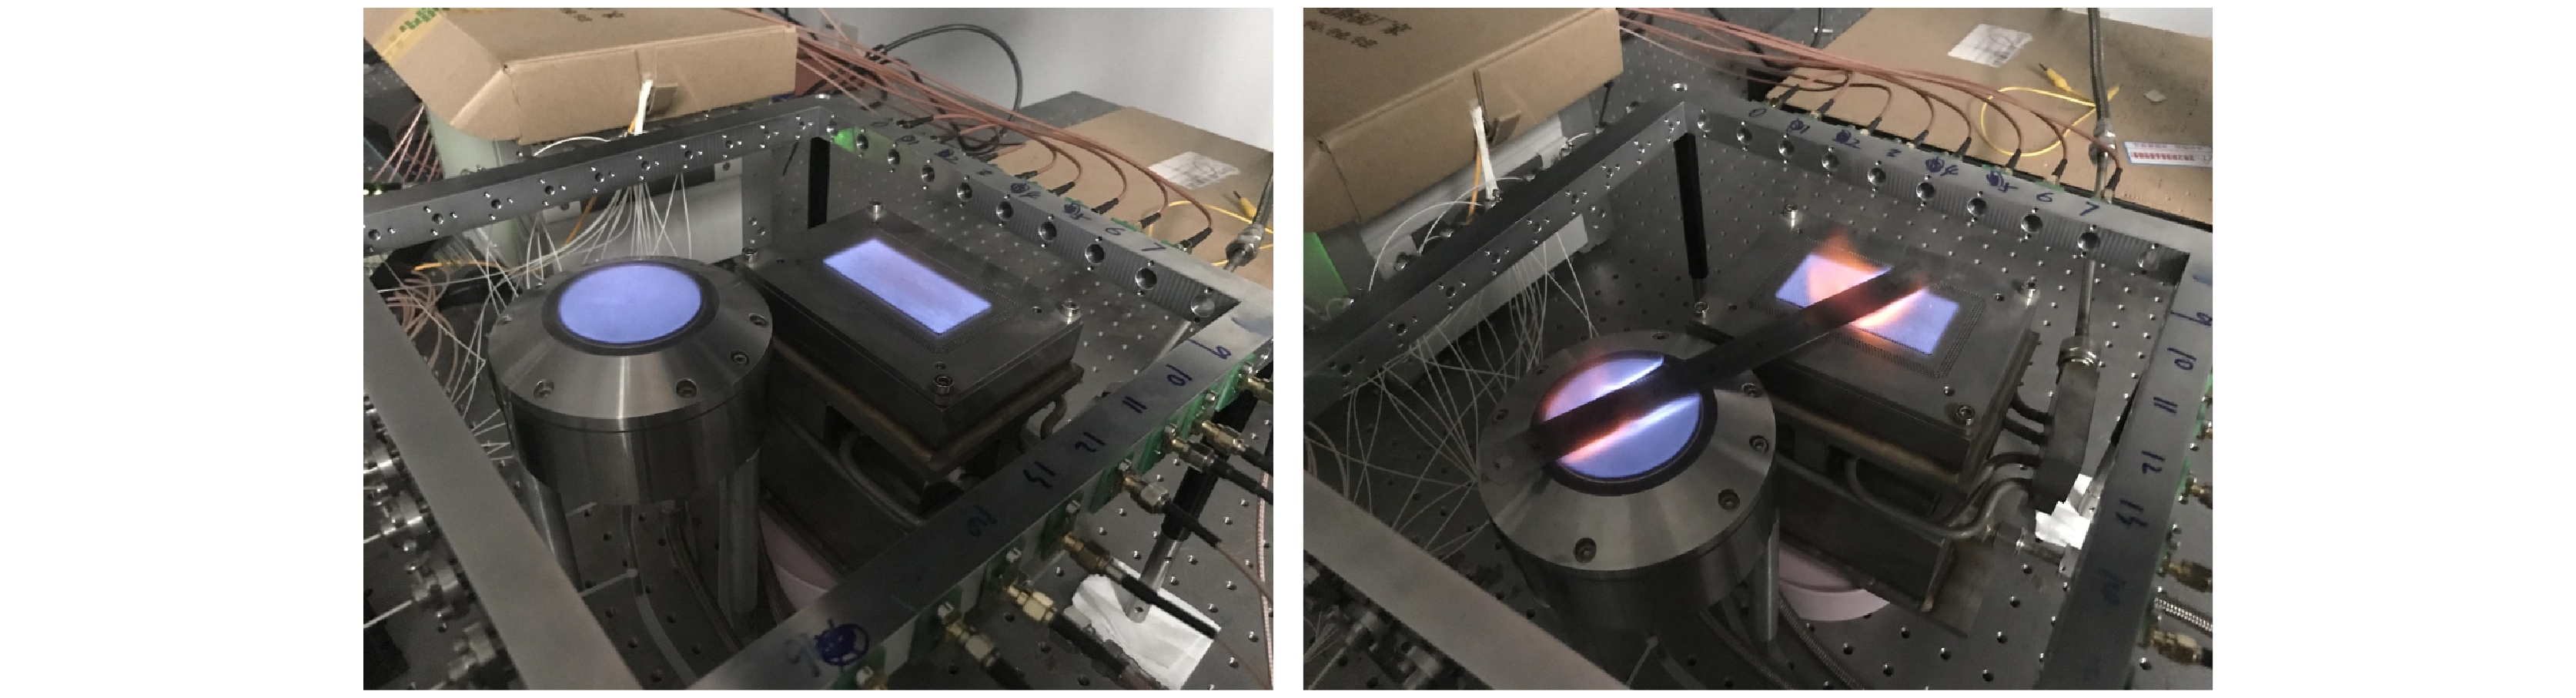
图 14 钢尺放置前后平焰炉燃烧分布
Fig. 14. The combustion distribution of Mckenna flat flame furnace before and after placing the steel ruler.
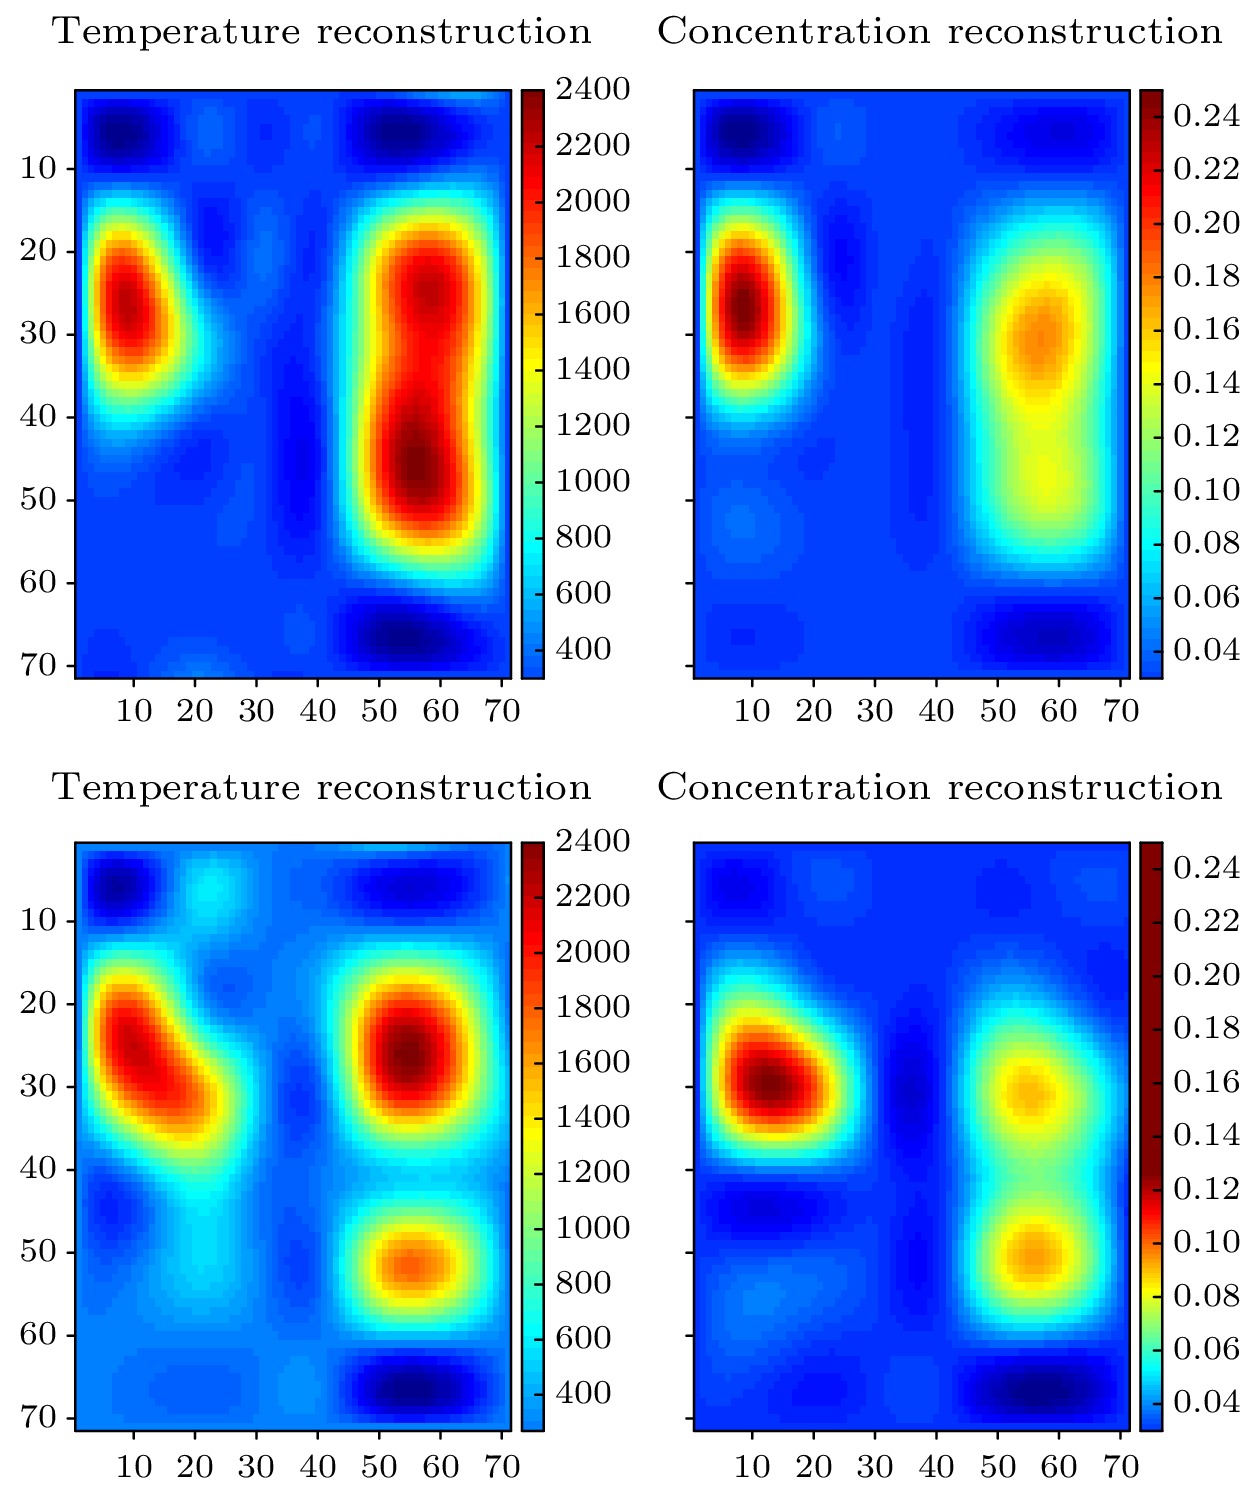
图 15 钢尺放置前后重建结果, 上面板为未放置钢尺前重建结果, 下面板为放置钢尺后重建结果
Fig. 15. Reconstruction results before and after steel ruler placement. Top: Reconstruction results before placing the steel ruler; Bottom: Reconstruction results after placing the steel ruler.
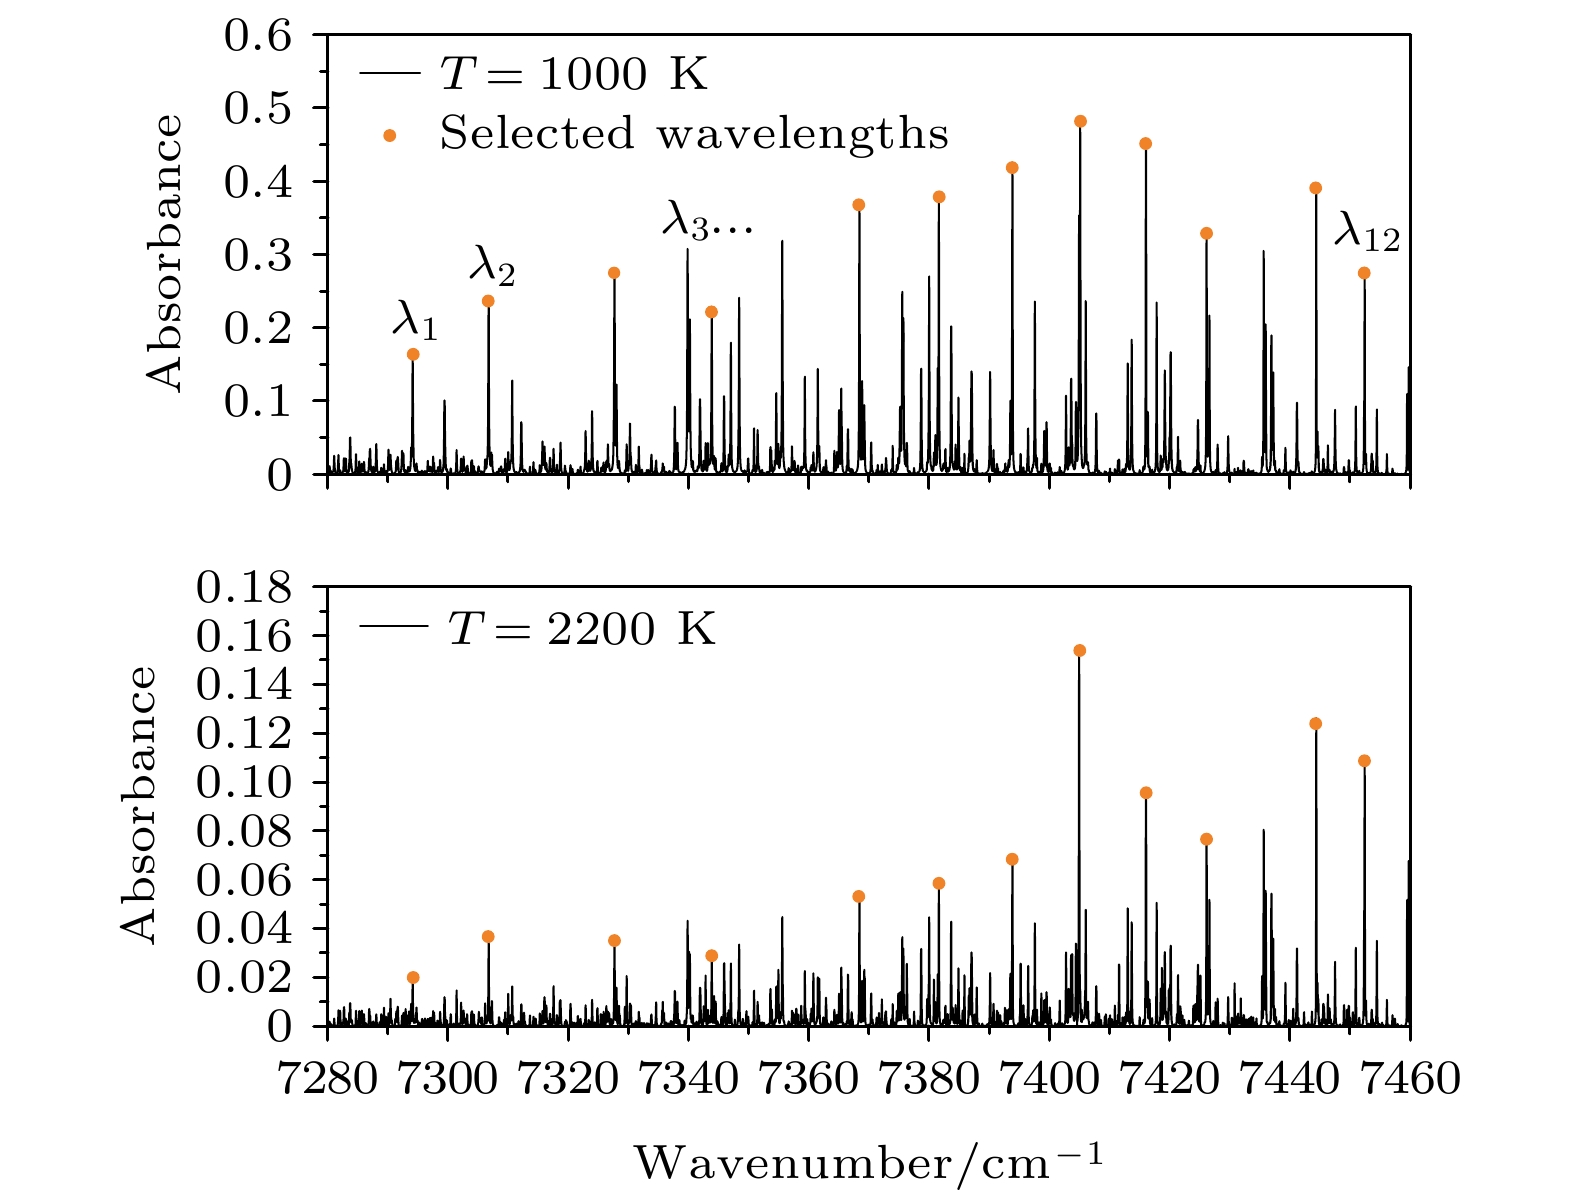
表 1 12条H2O吸收谱线的光谱参数
Table 1. Spectral parameters of 12 H2O absorption lines.
${\nu _0}/{\rm{c}}{{\rm{m}}^{ - 1}}$ $S({T_0})/({\rm{c} }{ {\rm{m} }^{ - 2} } \!\cdot\! {\rm{at} }{ {\rm{m} }^{ - 1} })$ $E''$ 7294.12 0.4041 23.7944 7306.75 0.4463 79.4964 7327.68 0.4612 136.7617 7343.85 0.3298 173.3658 7368.41 0.1731 447.2523 7381.61 0.0999 586.2435 7393.85 0.0516 744.1626 7405.11 0.0247 920.1680 7416.05 0.0142 1114.4030 7426.14 0.0042 1327.1096 7444.35 0.0005 1774.7503 7452.41 0.0002 2073.5139  下载: 导出CSV
表 2 两种算法应用于高光谱层析成像的运行时间对比
Table 2. Comparison of running time of two algorithms applied to hyperspectral tomography.
Noise level Simulated annealing algorithm Improved Simulated annealing algorithm 5 optimal transitions 8 optimal transitions 5 optimal transitions 8 optimal transitions 0% 8704 s 12379 s 231 s 364 s 0.5% 8346 s 12265 s 242 s 372 s 1% 9213 s 12403 s 237 s 384 s 1.5% 9001 s 12608 s 217 s 379 s 2% 8945 s 12337 s 230 s 342 s 3% 8573 s 13151 s 225 s 356 s 4% 8733 s 12726 s 240 s 351 s 5% 8667 s 12516 s 235 s 347 s
下载: 导出CSV
表 3 实验所用谱线及光谱参数
Table 3. Spectral lines and spectral parameters used in the experiment.
${\nu _0}/{\rm{c}}{{\rm{m}}^{ - 1}}$ $S({T_0})/({\rm{c}}{{\rm{m}}^{ - 2}} \cdot {\rm{at}}{{\rm{m}}^{ - 1}})$ $E''$ 7467.77 1.093 E-5 2551.48 7444.36 1.100 E-3 1790.04 7185.60 1.905 E-2 1045.06 7179.75 5.814 E-3 1216.19 6807.83 6.032 E-7 3319.45
下载: 导出CSV
-
[1] Gustafsson U, Sandsten J, Svanberg S 2000 Appl. Phys. B 71 853
Google Scholar
[2] Li H J, Farooq A, Jeffries J B, Hanson R K 2007 Appl. Phys. B 89 407
Google Scholar
[3] 李宁 2008 博士学位论文 (杭州: 浙江大学)
Li N 2008 Ph. D. Dissertation (Hangzhou: Zhejiang University) (in Chinese)
[4] 张春晓, 王飞, 李宁, 严建华, 池涌, 岑可法 2009 光谱学与光谱分析 29 2597
Google Scholar
Zhang C X, Wang F, Li N, Yan J H, Chi Y, Cen K F 2009 Spectrosc. Spect. Anal. 29 2597
Google Scholar
[5] Li C G, Dong L, Zheng C T, Frank K T 2016 Sensor. Actuat. B: Chem. 232 188
Google Scholar
[6] Ma Y F, Qiao S D, He Y, Li Y, Zhang Z H, Yu X, Frank K T 2019 Opt. Express 27 14163
Google Scholar
[7] Jiang Y L, Li G, Yang T, Wang J J 2017 IOP. Conf. Ser. Earth Environ. Sci. 52 012092
Google Scholar
[8] Hodgkinson J, Ralph P T 2013 Meas. Sci. Technol. 24 012004
Google Scholar
[9] Liu J T C, Jeffries J B, Hanson R K 2004 Appl. Phys. B 78 503
Google Scholar
[10] Torniainen E D, Hinz A K, Gouldin F C 1998 AIAA. J. 36 1270
Google Scholar
[11] Lindstrom C, Tam C J, Davis D, Eklund D, Williams S 2007 AIAA. 43 2007
[12] Gillet B, Hardalupas Y, Kavounides C, Taylor A M K P 2004 J. Appl. Therm. Eng. 24 1633
Google Scholar
[13] Ma L, Cai W W, Caswell A W, Kraetschmer T, Sanders S T, Roy S, Gord J R 2009 Opt. Express 17 8602
Google Scholar
[14] Paul E, Dai J H, Seamus O, Lu H C, Cai W W 2017 Appl. Phys. Lett. 111 184102
Google Scholar
[15] Cai W W, Ma L 2008 Appl. Opt. 47 3751
Google Scholar
[16] 李根 2014 硕士学位论文 (南京: 东南大学)
Li G 2014 M. S. Thesis (Nanjing: Southeast University) (in Chinese)
[17] Ma L, Li X S, Cai W W, Roy S, Jams R G, Scott T S 2010 Appl. Spectrosc. 64 1274
Google Scholar
[18] Caswell A W 2009 Ph. D. Dissertation (America: University of Wisconsin-Madison)
[19] Corana A, Marchesi M, Martini C, Ridella S 1987 ACM 13 262
Google Scholar
[20] 卢宇婷, 林禹攸, 彭乔姿, 王颖喆 2015 大学数学 31 97
Google Scholar
Lu Y T, Lin Y Y, Peng Q Z, Wang Y Z 2015 Coll. Math. 31 97
Google Scholar

 下载:
下载:


计量
- 文章访问数: 9909
- PDF下载量: 116
- 被引次数: 0
