


-
为获取生物组织和活体细胞内部精细结构, 要求显微成像技术具备层析成像能力. 基于动态散斑照明的宽场荧光显微技术利用动态变化的散斑图案全场照明待测样品, 通过提取焦平面内变化剧烈的荧光信号, 获得三维结构的荧光层析图像. 本文通过理论分析和模拟仿真, 研究了这一荧光显微技术获取荧光层析图像的过程. 模拟仿真了影响荧光层析图像成像质量的主要因素, CCD记录的原始荧光图像数量和散射体颗粒度与成像质量的关系. 模拟仿真结果表明, 荧光层析图像的成像质量随原始荧光图像数量的增加先提高后趋向饱和, 随散射体颗粒度的增大先增大后降低. 综合考虑成像质量和成像时间等因素, 当用于提取荧光层析图像的原始荧光图像的数量为60幅, 散射体颗粒度为1000左右时, 可获得图像对比度高于85%的高空间分辨率荧光层析图像. 理论分析和模拟仿真研究工作为基于动态散斑照明的宽场荧光显微技术的系统结构设计、实现和优化提供了理论基础和指导.In order to obtain the internal fine structure of biological tissues and living cells, the microscopic imaging technology is required to be capable of microscopy. In the wide-field fluorescence microscopy with dynamic speckle illumination, a series of dynamically changing speckle patterns are used to illuminate a biological sample in the whole field. The fluorescence sectioning images of sample’s three-dimensional structural are obtained by extracting intensely changing fluorescence signals in the focal plane. In this paper, the process of obtaining fluorescence sectioning images by the fluorescence microscopy is studied by theoretical analysis and simulation. Two main factors affecting the imaging quality of fluorescence sectioning image are analyzed, which are the number of original fluorescence images recorded by CCD and granularity of diffuser. The simulation results indicates that the imaging quality of fluorescence sectioning images first increases and then tends to saturation with the number of original fluorescence images increasing. It first increases and then decreases with the graininess of diffusers increasing. Considering the imaging quality and imaging time, when the number of original fluorescence images is 60 that is used to extract fluorescence sectioning images, and the granularity of diffuser is about 1000, the high spatial resolution fluorescence sectioning images with contrast higher than 85% can be obtained. Theoretical analysis and simulation research provide a theoretical basis and guidance for designing the system structure, implementing and optimizing the wide-field fluorescence microscopy with dynamic speckle illumination.
-
Keywords:
- speckle /
- fluorescence microscopy /
- sectioning imaging /
- wide-field illumination
[1] Minsky M US Patent 3013467 [1957-12-19]
[2] Minsky M 1988 Scanning 10 128
 Google Scholar
[3] Kohen E, Hirschberg J G 1989 Cell Structure and Function by Microspectrofluorometry (San Diego, CA: Academic) p13
[4] Tsien R Y, Miyawaki A 1998 Science 280 1954
Google Scholar
[5] Wilson T, Sheppard C 1984 Theory and Practice of Scanning Optical Microscopy (Orlando, FL: Academic) p47
[6] Pawley J B 1995 Handbook of Biological Confocal Microscopy (New York: Plenum) p9
[7] Ikagawa H, Yoneda M, Iwaki M, Isogai Z, Tsujii K, Yamazaki R, Kamiya T, Zako M 2005 Invest. Ophthalmol. Vis. Sci. 46 2531
Google Scholar
[8] Szeto H H, Schiller P W, Zhao K, Luo G X 2004 FASEB J. 19 118
[9] Mason W T 1999 Fluorescent and Luminescent Probes for Biological Activity (San Diego, CA: Academic) p99
[10] Somekh M G, See C W, J Goh 2000 Opt. Comm. 174 75
Google Scholar
[11] Ventalon C, Mertz J 2005 Opt. Lett. 30 3350
Google Scholar
[12] Ventalon C, Mertz J 2006 Opt. Express 14 7198
Google Scholar
[13] 林浩铭, 邵永红, 屈军乐, 尹君, 陈思平, 牛憨笨 2008 物理学报 57 7641
Google Scholar
Lin H M, Shao Y H, Qu J L, Yin J, Chen S P, Niu H B 2008 Acta Phys. Sin. 57 7641
Google Scholar
[14] Wilson T, Juskaitis R, Neil M A A, Kozubek M 1996 Opt. Lett. 21 1879
Google Scholar
-
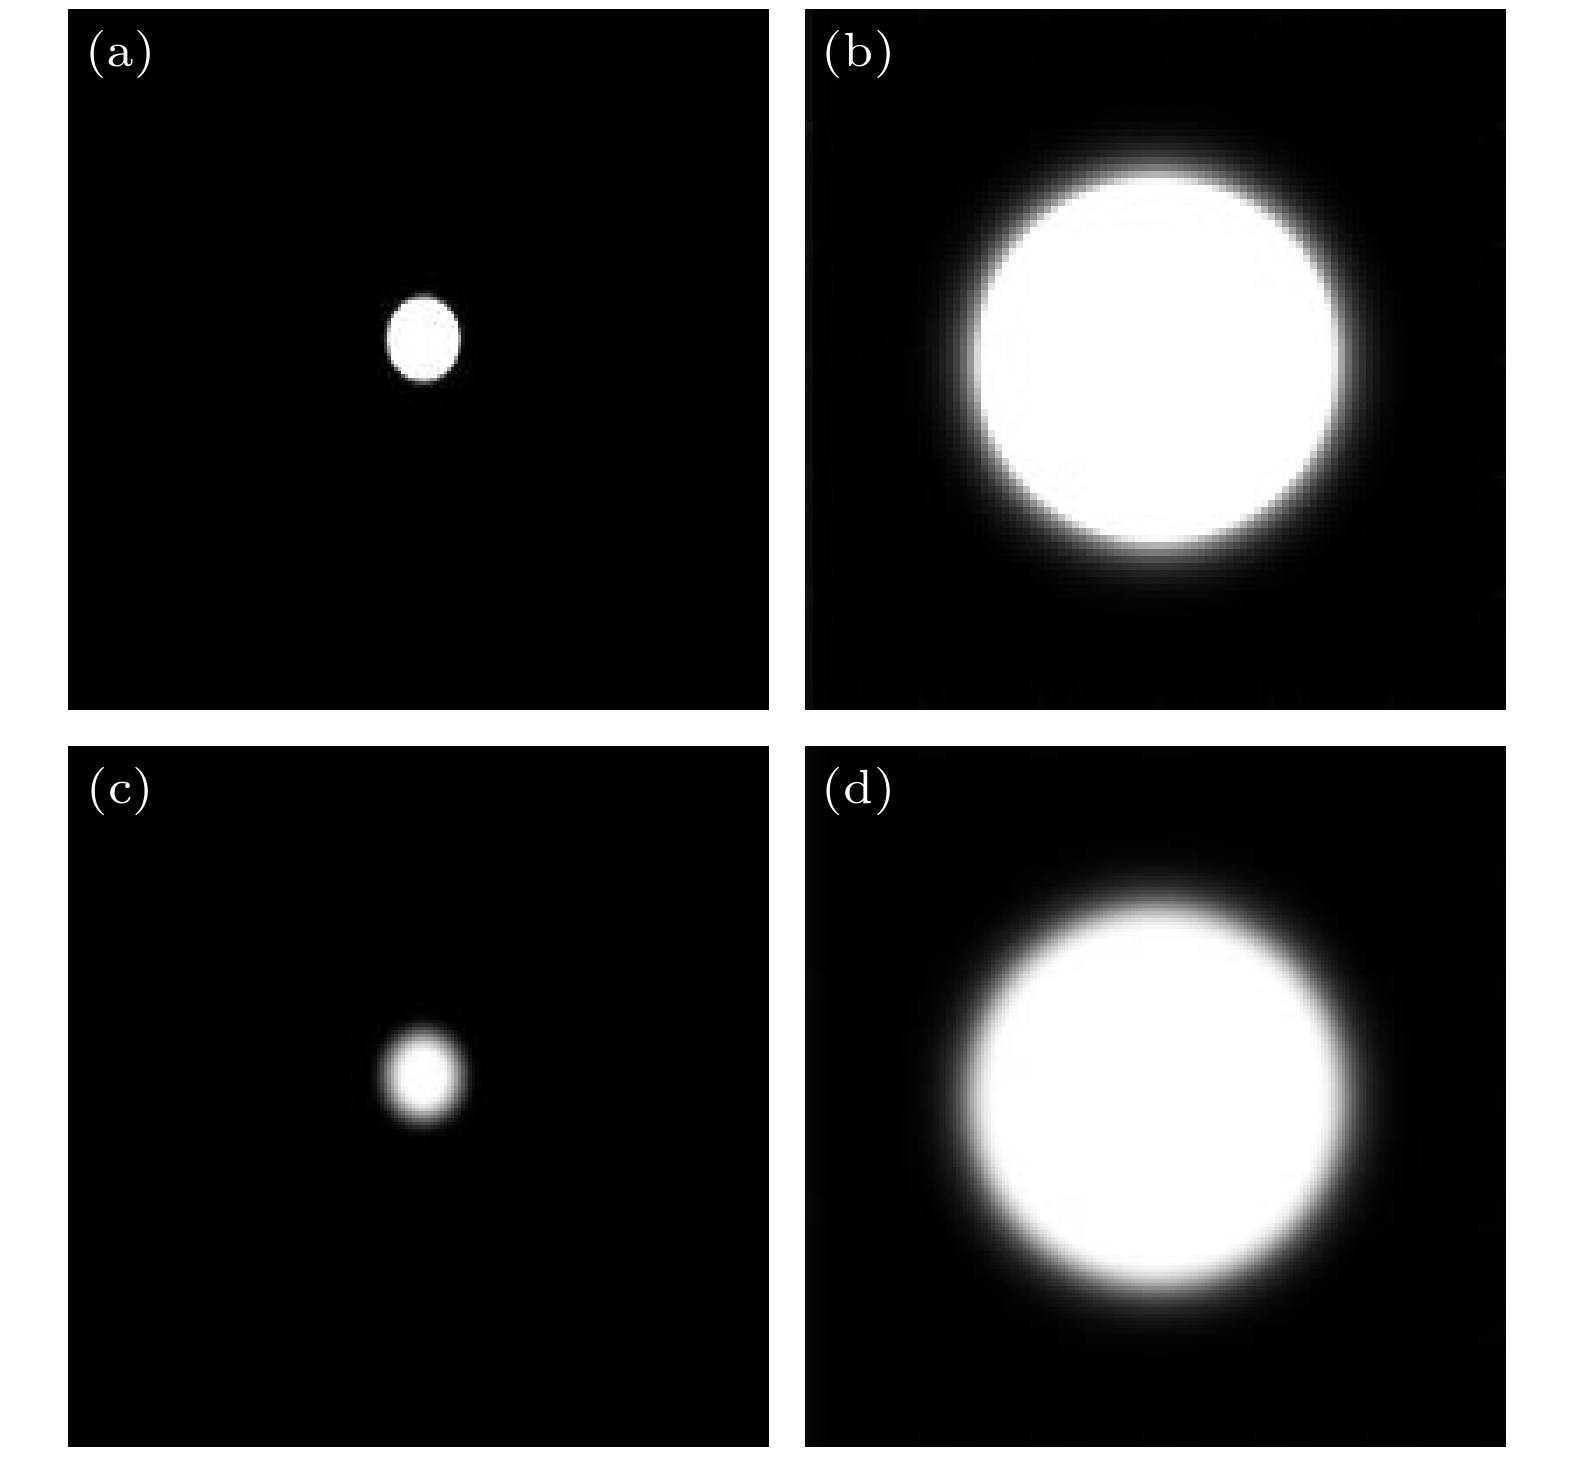
图 1 不同半径的两个小球样品的焦平面荧光图像 R (a), 10R (b) 和离焦荧光图像 R (c), 10R (d)
Fig. 1. Fluorescence images of focal (a), (b) and defocus (c), (d) planes of two small spherical samples with radii of R and 10R respectively.
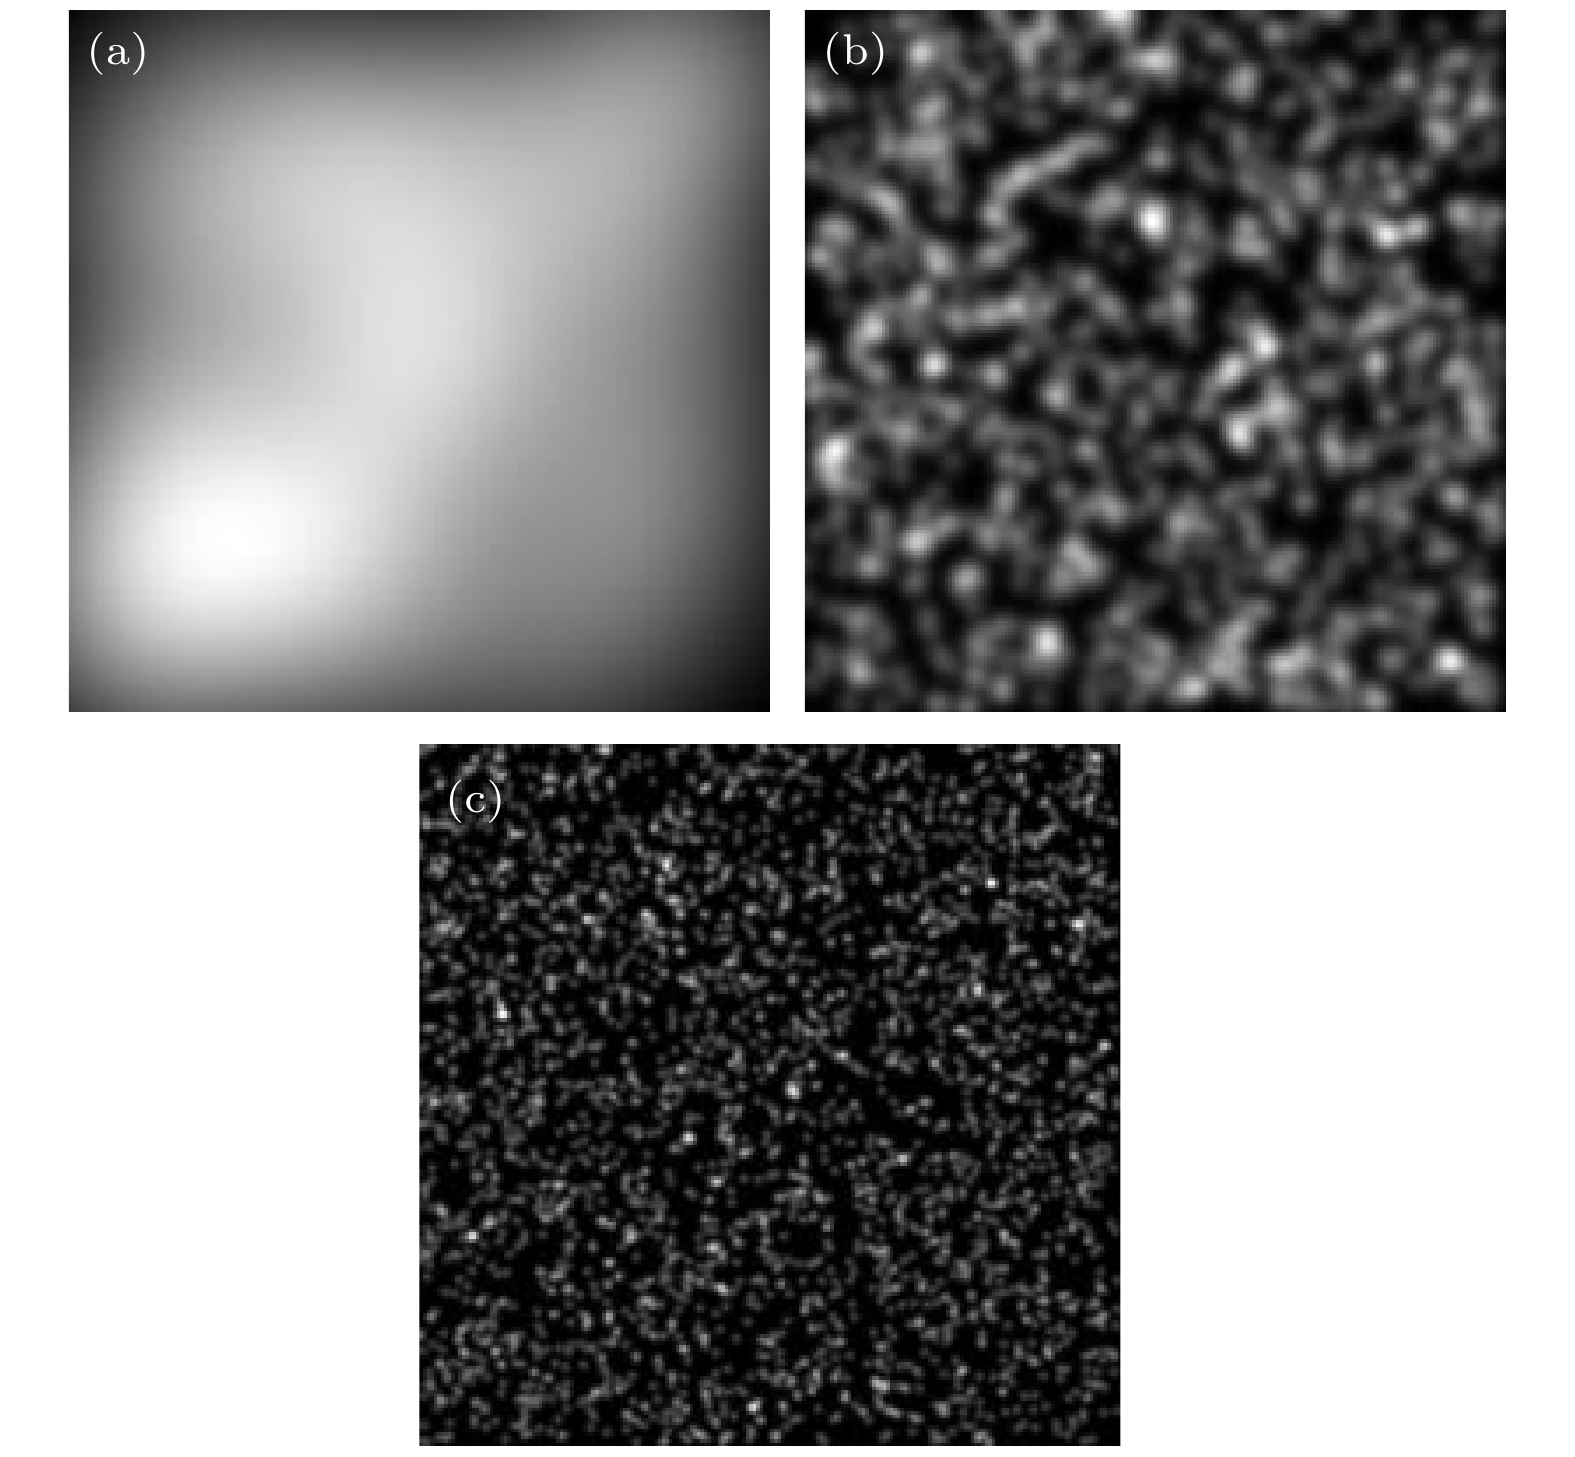
图 2 激光光束通过颗粒度分别为100 (a), 1000 (b)和3000 (c)的散射体形成的照明散斑图案
Fig. 2. Illumination speckle patterns are formed when a laser beam passes through diffusers with different granularity of 100 (a), 1000 (b) and 3000 (c), respectively.
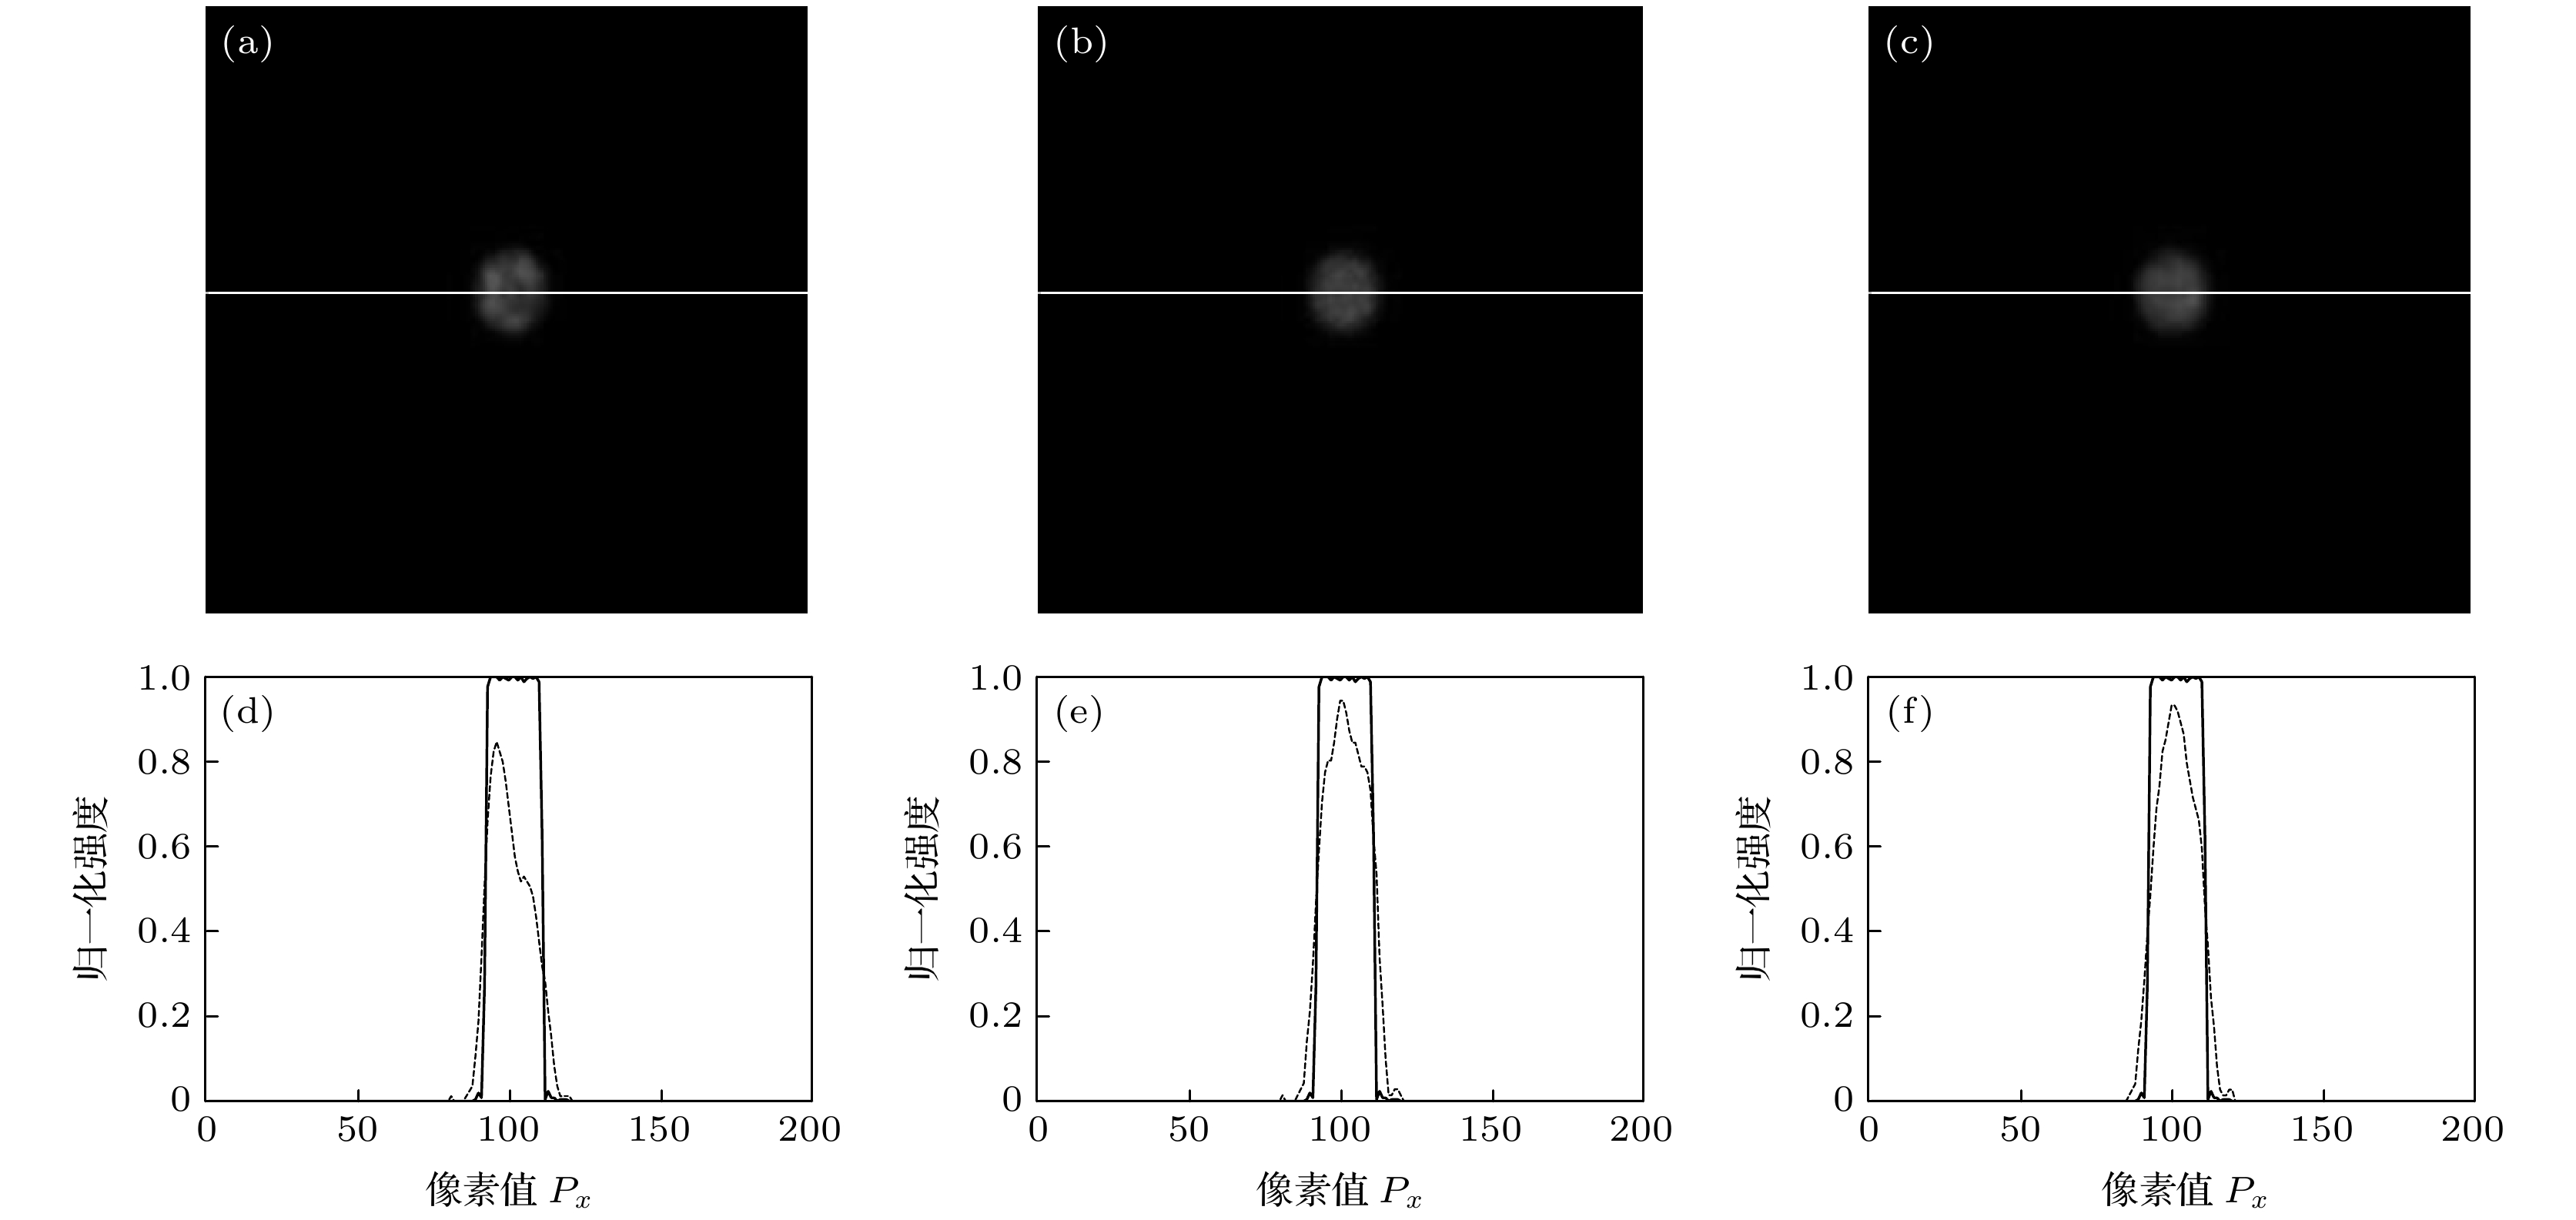
图 3 颗粒度为1000时, 半径为R的小球样品荧光层析图像 (a)—(c)及中心位置处荧光信号归一化强度(d)—(f) (a), (d) N = 20; (b), (e) N = 60; (c), (f) N = 200
Fig. 3. The fluorescence sectioning images (a)–(c) of a small spherical sample with a radius of R and the normalized intensity (d)–(f) of the fluorescence signal at the center position with the granularity of diffuser being 1000: (a), (d) N = 20; (b), (e) N = 60; (c), (f) N = 200.
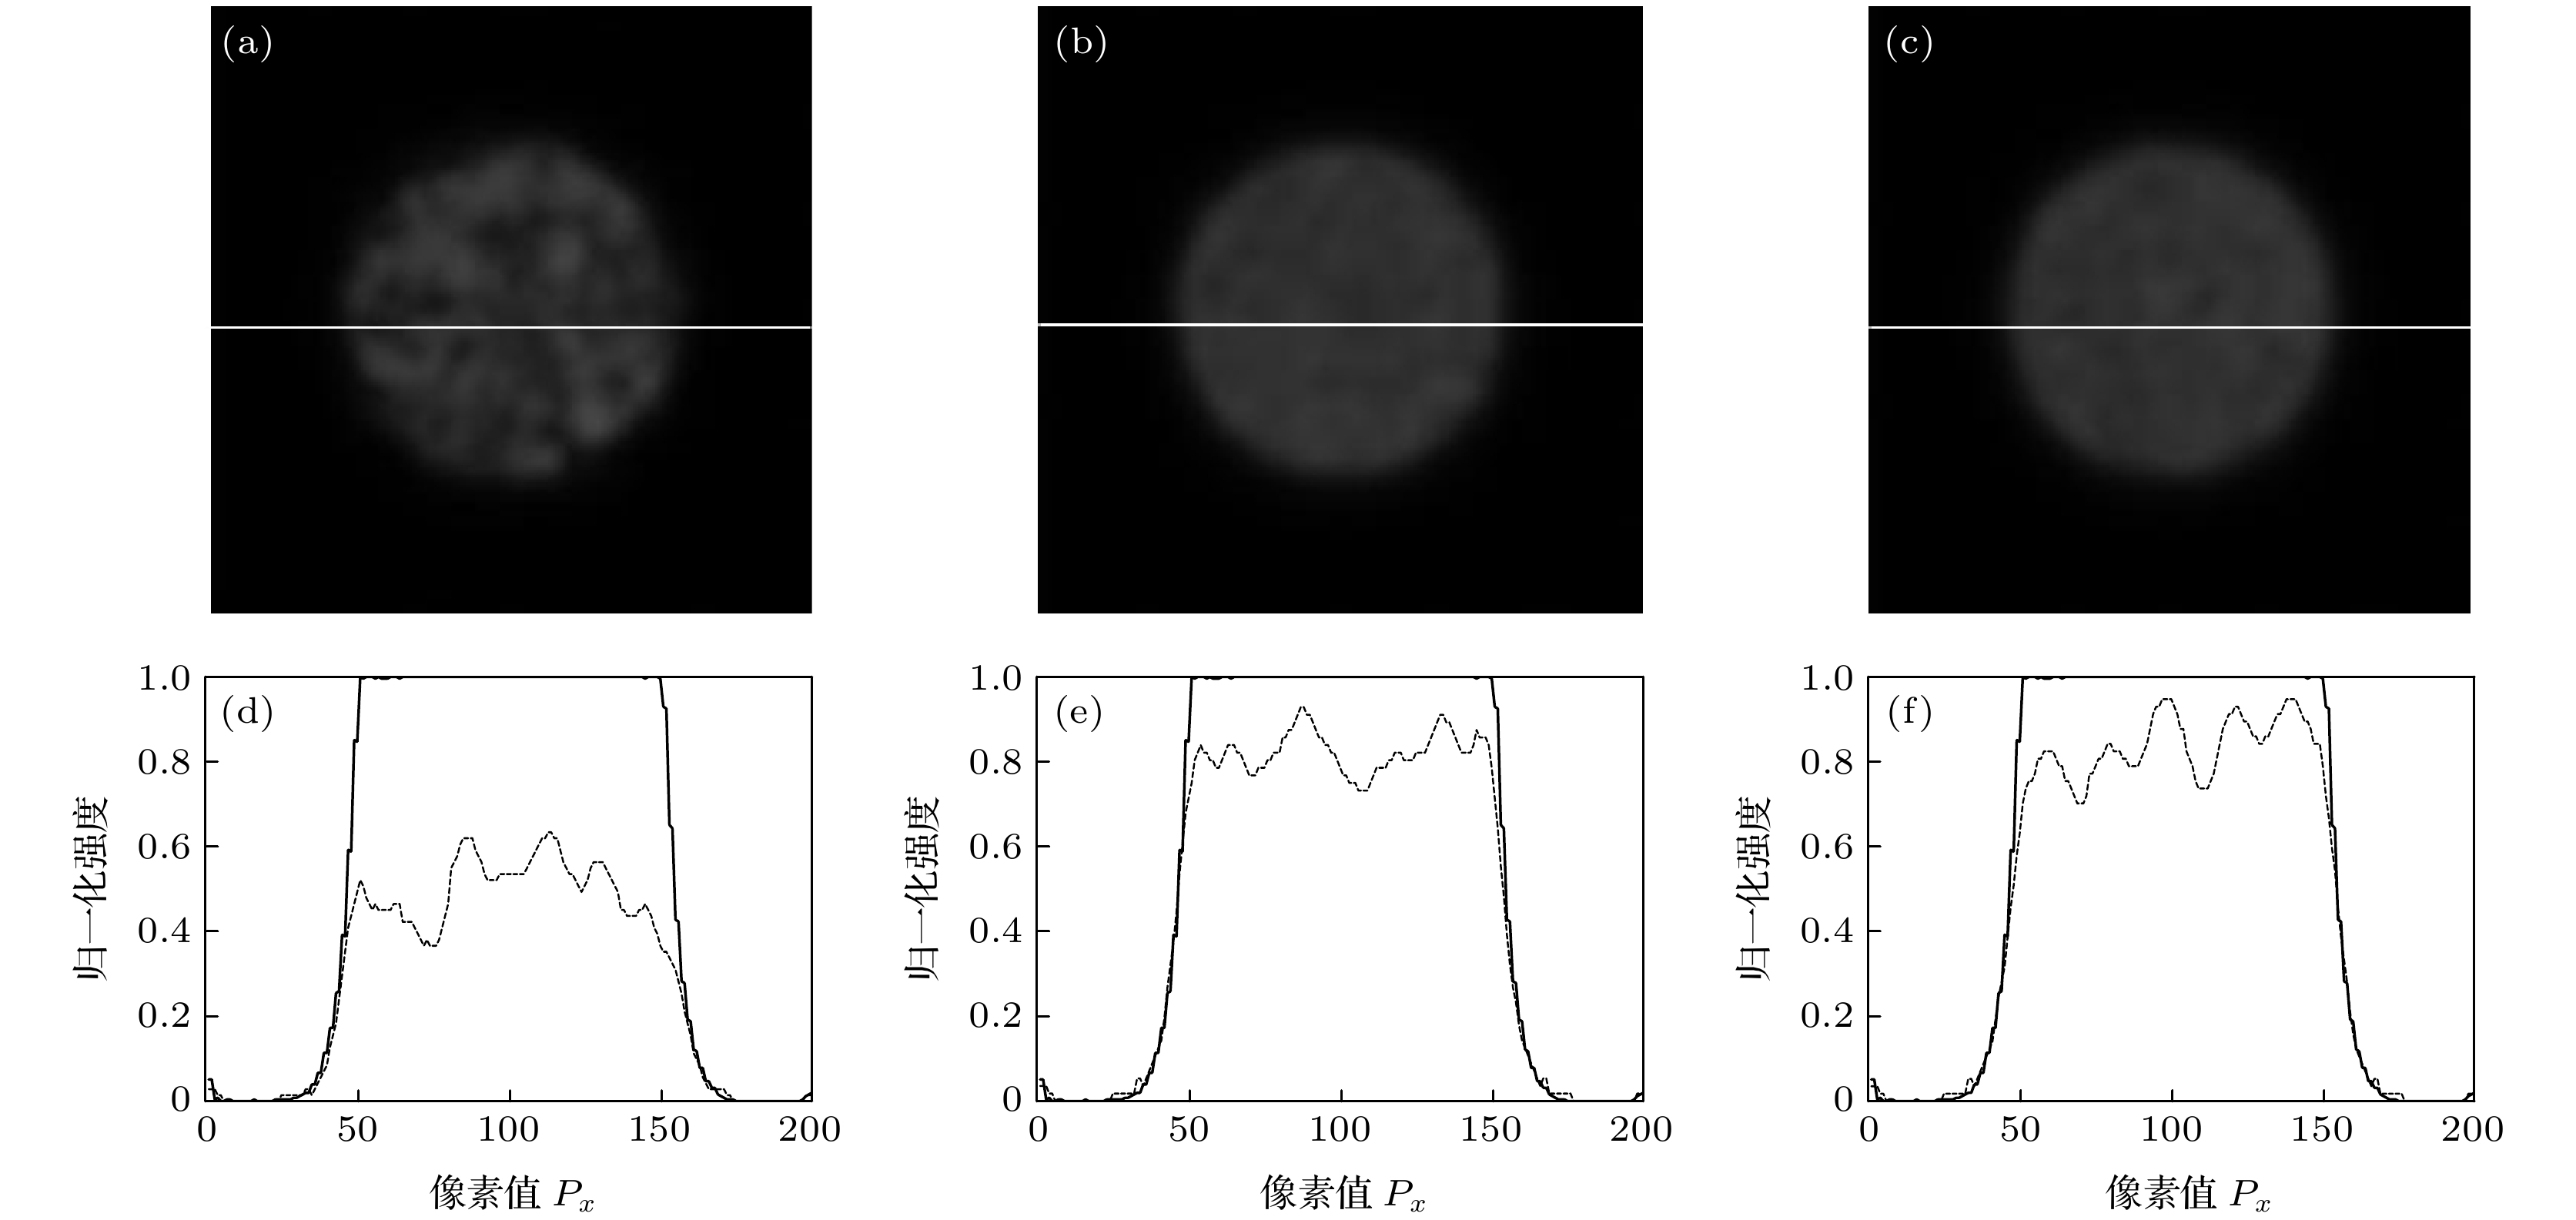
图 4 颗粒度为500时, 半径为10R的小球样品荧光层析图像 (a)—(c)及中心位置处荧光信号归一化强度(d)—(f) (a), (d) N = 20; (b), (e) N = 60; (c), (f) N = 200
Fig. 4. The fluorescence sectioning images (a)–(c) of a small spherical sample with a radius of 10R and the normalized intensity (d)–(f) of the fluorescence signal at the center position with the granularity of diffuser being 500: (a), (d) N = 20; (b), (e) N = 60; (c), (f) N = 200.

图 5 不同颗粒度条件下, 层析图像荧光信号归一化强度平均值与原始荧光图像数量之间的关系 (a)小球样品; (b)大球样品
Fig. 5. When the granularities of diffusers are different, the relationships between the average values of the normalized intensity of the fluorescence signals of sectioning images and the numbers of the original fluorescence images: (a) Small ball; (b) large ball.
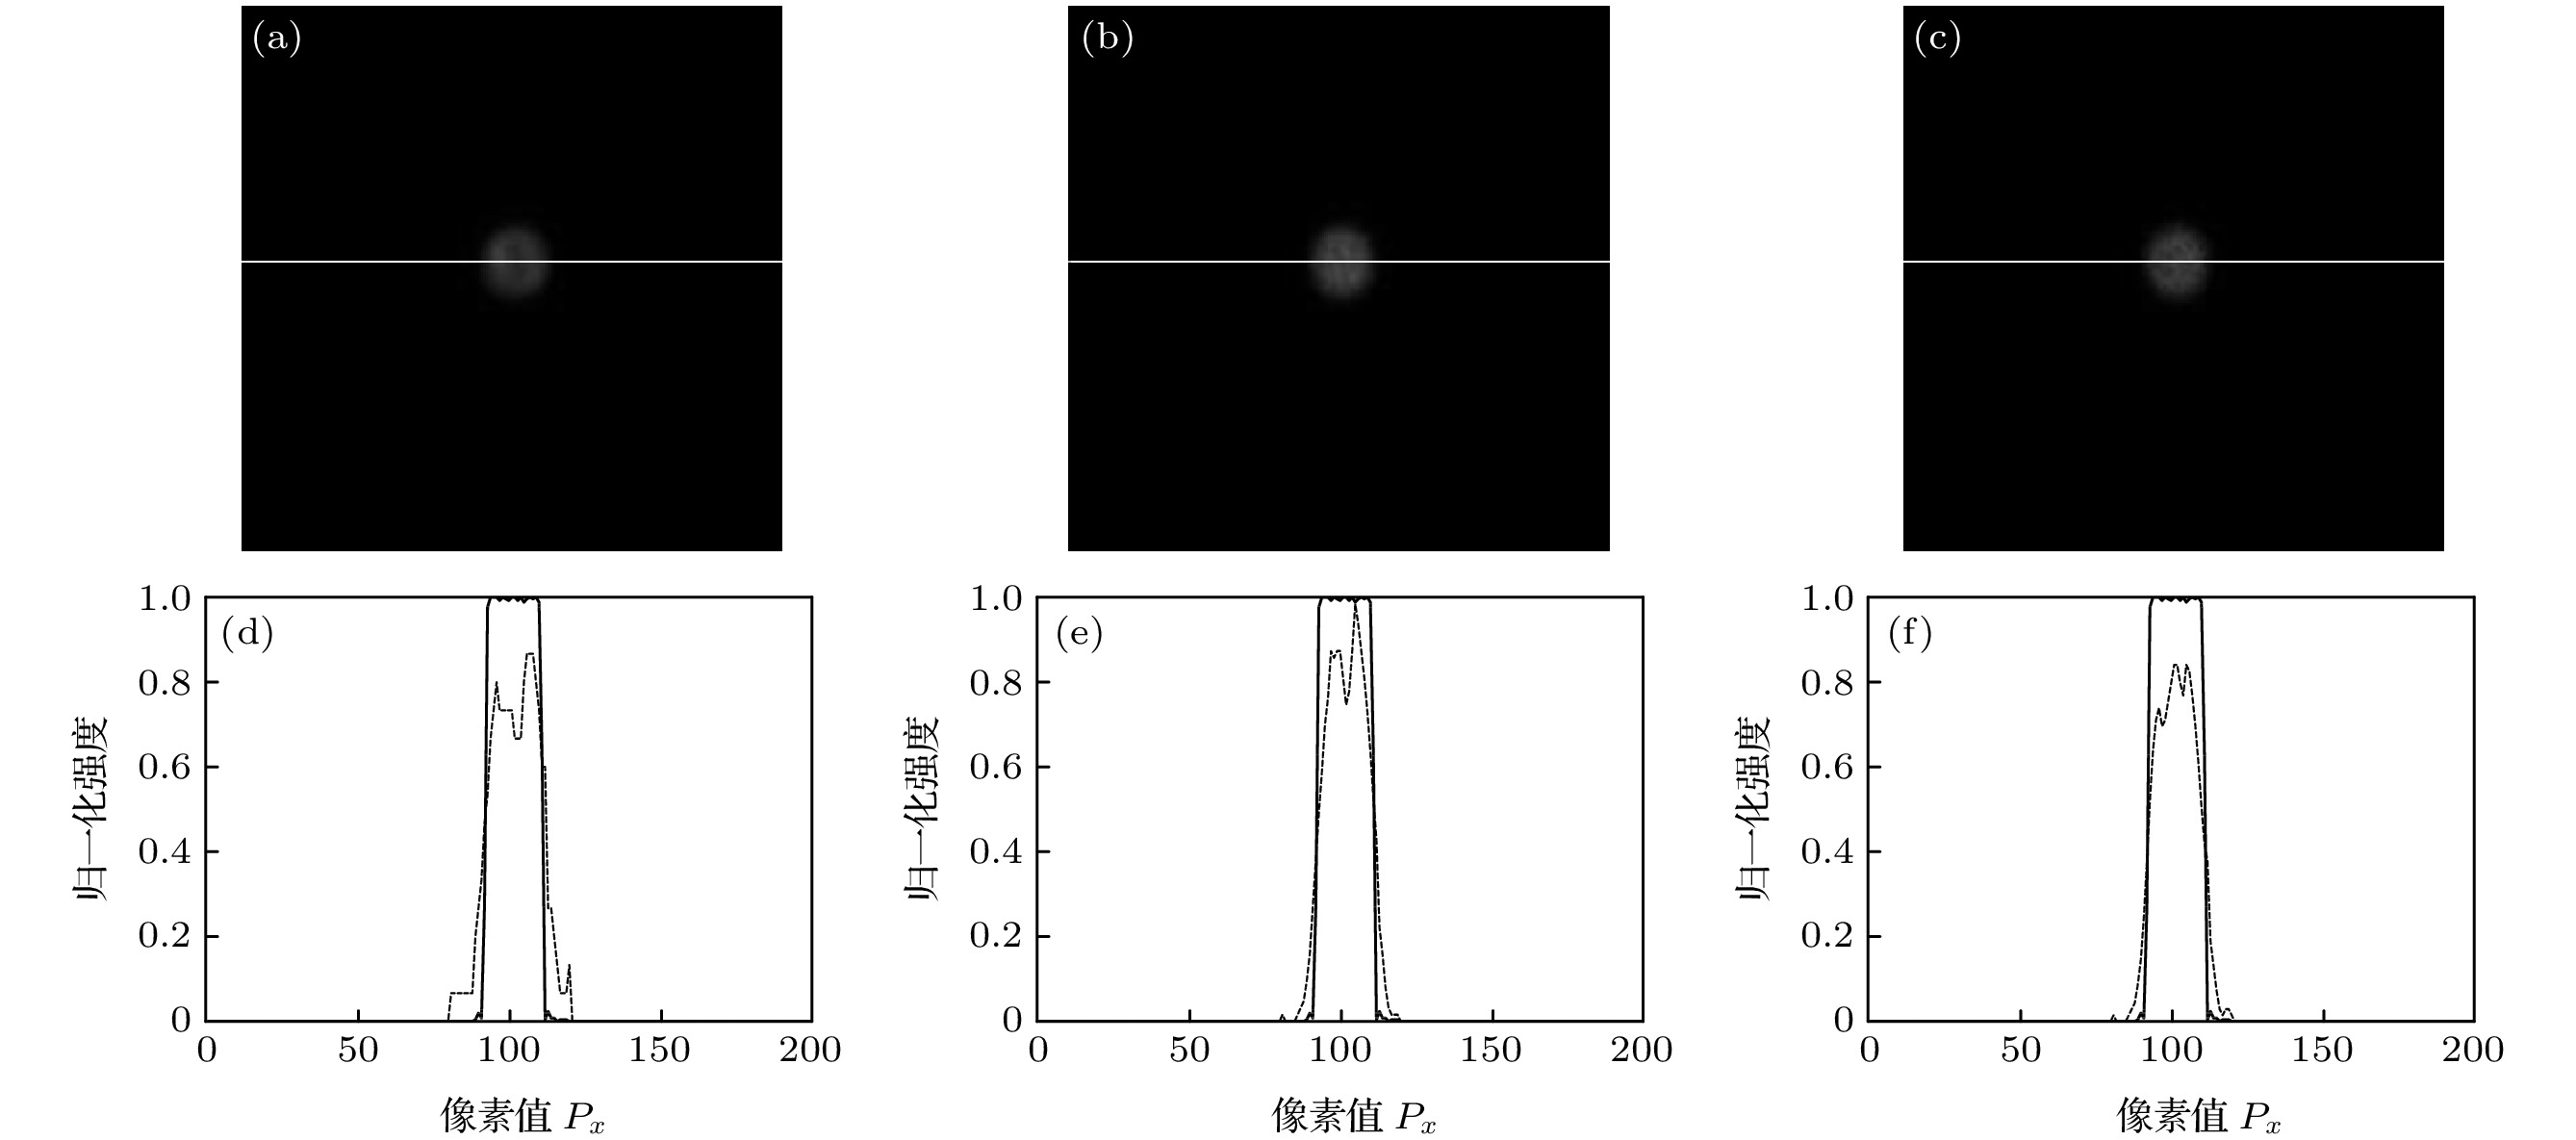
图 6 CCD记录120幅原始荧光图像时, 半径为R的小球样品荧光层析图像 (a)—(c)及中心位置处荧光信号归一化强度 (d)—(f) (a), (d) G =100; (b), (e) G =1000; (c), (f) G = 3000
Fig. 6. The fluorescence sectioning images (a)–(c) of a small spherical sample with a radius of R and the normalized intensity (d)–(f) of the fluorescence signal at the center position with 120 original fluorescence images being recorded by CCD: (a), (d) G =100; (b), (e) G =1000; (c), (f) G = 3000.

图 7 CCD记录120幅原始荧光图像时, 半径为10R的小球样品荧光层析图像 (a)—(c)及中心位置处荧光信号归一化强度 (d)—(f) (a), (d) G =20; (b), (e) G =1000; (c), (f) G = 3000
Fig. 7. When 120 original fluorescence images are recorded by CCD and the different granularity of diffuser, G=20, 1000, 3000, The fluorescence sectioning images (a)–(c) of a small spherical sample with a radius of 10R and the normalized intensity (d)–(f) of the fluorescence signal at the center position with 120 original fluorescence images being recorded by CCD: (a), (d) G =20; (b), (e) G =1000; (c), (f) G = 3000.
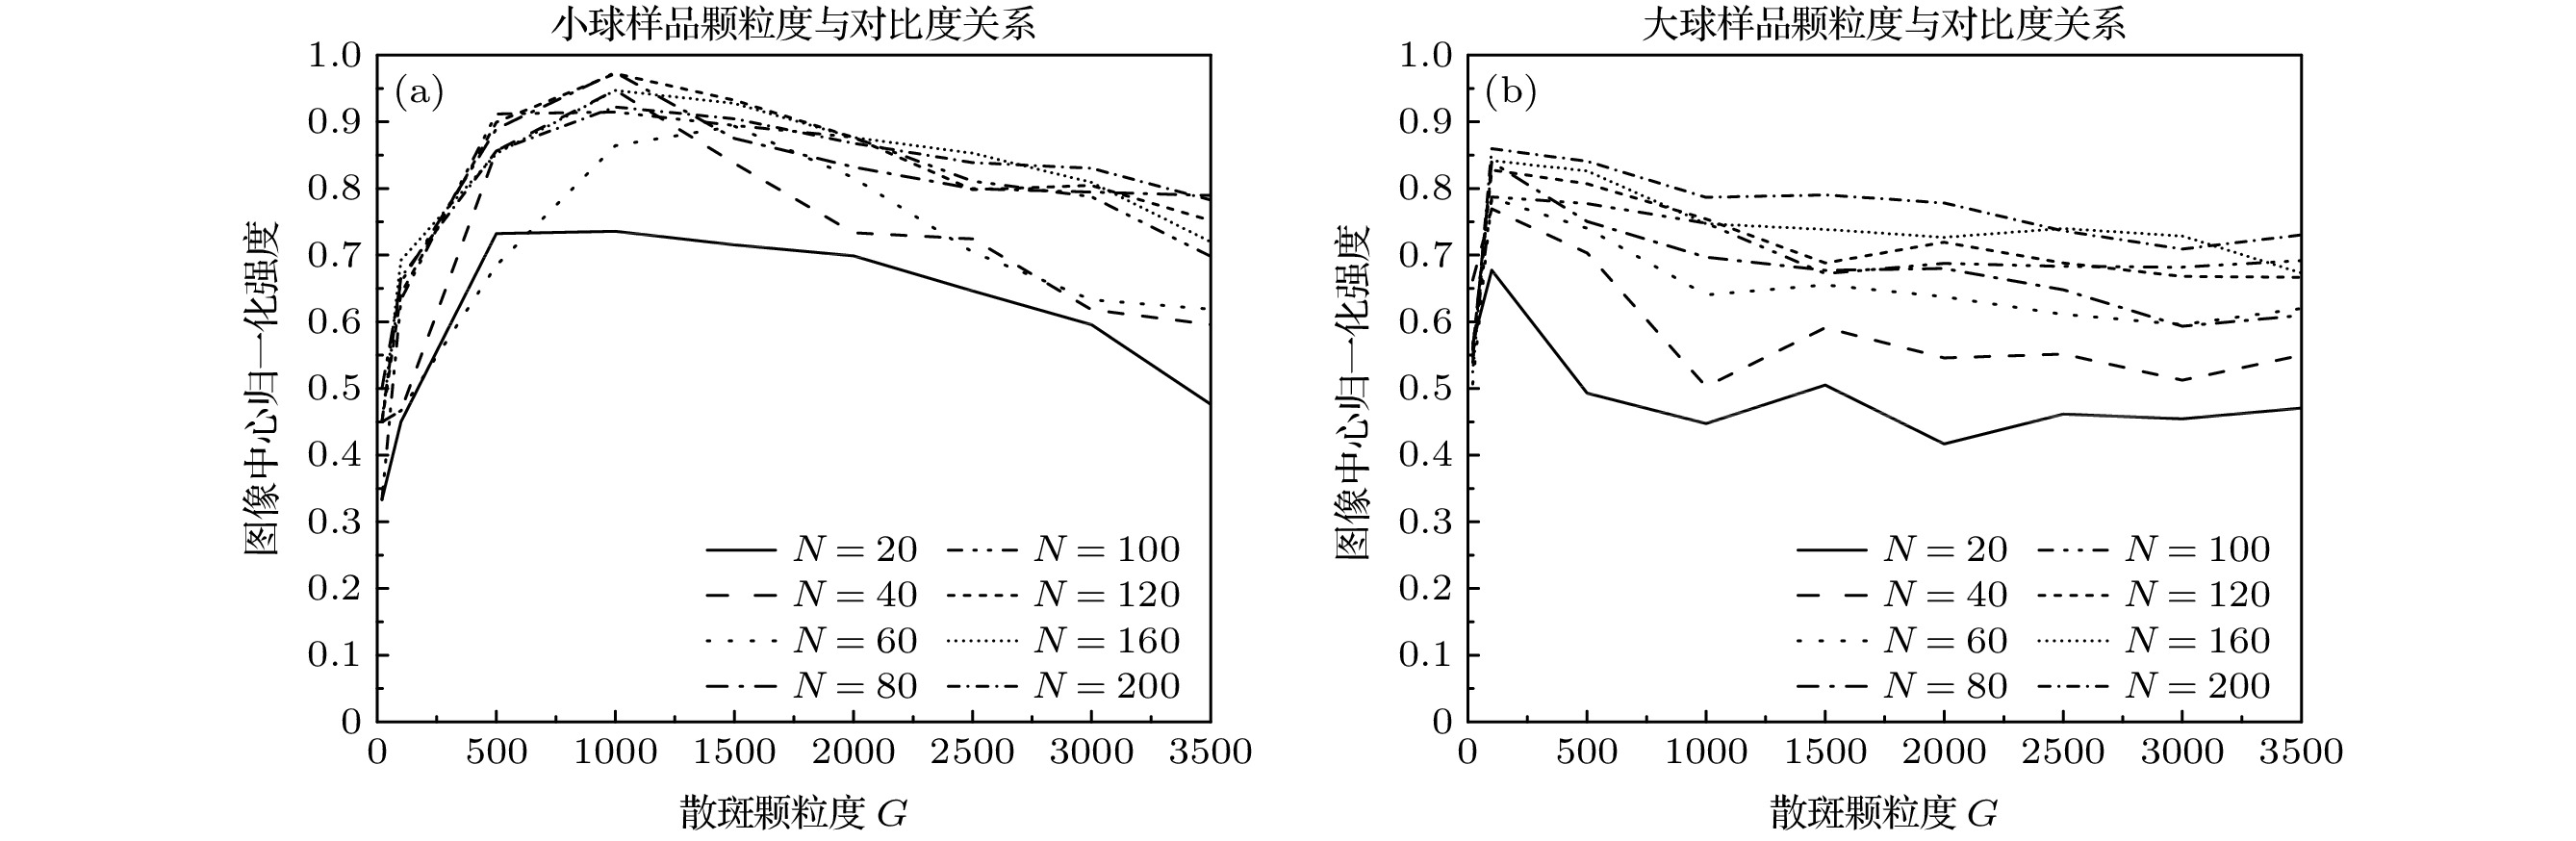
图 8 CCD记录不同原始荧光图像数量时, 层析图像荧光信号归一化强度平均值与散斑颗粒度之间的关系 (a)小球样品; (b)大球样品
Fig. 8. The relationships between the average values of the normalized intensity of the fluorescence signals of sectioning images and the diffuser granularities with different numbers of the original fluorescence images being recorded by CCD: (a) Small ball; (b) large ball.
-
[1] Minsky M US Patent 3013467 [1957-12-19]
[2] Minsky M 1988 Scanning 10 128
Google Scholar
[3] Kohen E, Hirschberg J G 1989 Cell Structure and Function by Microspectrofluorometry (San Diego, CA: Academic) p13
[4] Tsien R Y, Miyawaki A 1998 Science 280 1954
Google Scholar
[5] Wilson T, Sheppard C 1984 Theory and Practice of Scanning Optical Microscopy (Orlando, FL: Academic) p47
[6] Pawley J B 1995 Handbook of Biological Confocal Microscopy (New York: Plenum) p9
[7] Ikagawa H, Yoneda M, Iwaki M, Isogai Z, Tsujii K, Yamazaki R, Kamiya T, Zako M 2005 Invest. Ophthalmol. Vis. Sci. 46 2531
Google Scholar
[8] Szeto H H, Schiller P W, Zhao K, Luo G X 2004 FASEB J. 19 118
[9] Mason W T 1999 Fluorescent and Luminescent Probes for Biological Activity (San Diego, CA: Academic) p99
[10] Somekh M G, See C W, J Goh 2000 Opt. Comm. 174 75
Google Scholar
[11] Ventalon C, Mertz J 2005 Opt. Lett. 30 3350
Google Scholar
[12] Ventalon C, Mertz J 2006 Opt. Express 14 7198
Google Scholar
[13] 林浩铭, 邵永红, 屈军乐, 尹君, 陈思平, 牛憨笨 2008 物理学报 57 7641
Google Scholar
Lin H M, Shao Y H, Qu J L, Yin J, Chen S P, Niu H B 2008 Acta Phys. Sin. 57 7641
Google Scholar
[14] Wilson T, Juskaitis R, Neil M A A, Kozubek M 1996 Opt. Lett. 21 1879
Google Scholar

 下载:
下载:
计量
- 文章访问数: 8274
- PDF下载量: 130
- 被引次数: 0
