


-
伽马单中子出射反应截面是核工程输运计算中的重要参数, 部分核素(γ, n)的反应测量因来自不同实验室而分歧明显. 本文基于变分自编码器方法, 针对原子核质量数在29—207区域的伽马单中子出射反应截面实验测量数据进行分析, 有效识别多家测量之间的离群点. 首先, 研究变分自编码器方法, 建立伽马单中子光核测量数据离群点识别网络; 其次, 对$^{29}\text{Si}$, $^{54}\text{Fe}$, $^{63}\text{Cu}$, $^{141}\text{Pr}$, $^{181}\text{Ta}$, $^{206}\text{Pb}$和$^{207}\text{Pb}$的29家多能点测量数据进行离群点识别; 最后, 计算离群点识别前后的实验数据与国际原子能机构光核评价数据库(IAEA-2019-PD)评价值之间的偏差, 检测变分自编码器的分析效果. 研究表明, 变分自编码器方法可以有效识别(γ, n)反应实验测量离群点, 其中$^{54}\text{Fe}$,$^{63}\text{Cu}$, $^{181}\text{Ta}$, $^{206}\text{Pb}$和$^{207}\text{Pb}$的伽马单中子出射反应截面与IAEA-2019-PD评价结果一致性更高, 验证了该方法在核数据研究中的应用潜力.
The (γ, n) cross-section is important in nuclear engineering transport calculations. The measurements of the (γ, n) reaction for some isotopes show significant discrepancies among different laboratories. Since the analysis of experimental data is the primary task in the evaluation of nuclear data, identifying the measured outlier data is crucial for improving the quality of nuclear data. Therefore, a variational autoencoder (VAE) method is used in this work to analyze experimental measurements of (γ, n) cross sections for nuclear mass ranging from 29 to 207, in order to provide more reliable experimental information for evaluating nuclear data. According to the proton number Z and nuclear mass A, we design a variational autoencoder network for outlier identification in the measurement of (γ, n). The silhouette coefficient method and K-means algorithm are used to cluster the latent variables of VAE. Subsequently, the experimental data with and without the outliers are compared with those from the IAEA-2019-PD to assess the VAE in its application to the evaluation of photoneutron measurements. The results demonstrate that the VAE can effectively identify outliers in the measurements of (γ, n). After excluding outliers, the (γ, n) cross-section for $^{54}\text{Fe}$, $^{63}\text{Cu}$, $^{181}\text{Ta}$, $^{206}\text{Pb}$, and $^{207}\text{Pb}$ showed higher consistency with the IAEA-2019-PD evaluation results. However, $^{29}\text{Si}$ and $^{141}\text{Pr}$ still deviate from the IAEA-2019-PD evaluation results, therefore requiring more analyses of the measurements themselves in future. The VAE method can effectively identify outliers and extract the latent structures in experimental data of (γ, n) reaction. It provides more reliable experimental information for evaluating nuclear data and validating the potential application of this method in nuclear data research. However, the generalizability of VAE method still needs further developing, especially in addressing the issues of uneven energy distribution for various measurements. -
Keywords:
- variational autoencoder /
- (γ, n) reaction /
- cross section /
- outlier
[1] International Atomic Energy Agency 2000 Handbook on Photonuclear Data for Applications: Cross-sections and Spectra (Vienna: IAEA) pp1–284
[2] Obložinskỳ P 2002 J. Nucl. Sci. Technol. 39 31
[3] Dietrich S S, Berman B L 1988 At. Data Nucl. Data Tables 38 199
 Google Scholar
[4] Kawano T, Cho Y, Dimitriou P, et al. 2020 Nucl. Data Sheets 163 109
Google Scholar
[5] Carleo G, Cirac I, Cranmer K, Daudet L, Schuld M, Tishby N, Vogt-Maranto L, Zdeborová L 2019 Rev. Mod. Phys. 91 045002
Google Scholar
[6] He W, Li Q, Ma Y, Niu Z, Pei J, Zhang Y 2023 Sci. China Phys. Mech. Astron. 66 282001
Google Scholar
[7] He W B, Ma Y G, Pang L G, Song H C, Zhou K 2023 Nucl. Sci. Tech. 34 88
Google Scholar
[8] Bai J, Niu Z, Sun B, Niu Y 2021 Phys. Lett. B 815 136147
Google Scholar
[9] Xing K, Sun X J, Xu R R, Zou F L, Hu Z H, Wang J M, Tao X, Sun X D, Tian Y, Niu Z M 2024 Phys. Lett. B 855 138825
Google Scholar
[10] Li W, Liu L, Niu Z, Niu Y, Huang X 2024 Phys. Rev. C 109 044616
Google Scholar
[11] Bardhan J, Mandal T, Mitra S, Neeraj C, Patra M 2024 Eur. Phys. J. Spec. Top. 233 2559
Google Scholar
[12] Mitra S, Choi H, Liu S, Glatt R, Wendt K, Schunck N 2024 arXiv: 2404.02332 [nucl-th]
[13] Fox J M, Wendt K A 2024 arXiv: 2403.16389 [nucl-th]
[14] Kingma D P 2013 arXiv: 1312.6114 [stat.ML]
[15] Otuka N, Dupont E, Semkova V, et al. 2014 Nucl. Data Sheets 120 272
[16] Higgins I, Matthey L, Pal A, Burgess C P, Glorot X, Botvinick M M, Mohamed S, Lerchner A 2017 ICLR (Poster) 3
[17] Parzen E 1962 Ann. Math. Stat. 33 1065
Google Scholar
[18] Maas A L, Hannun A Y, Ng A Y, et al. 2013 Proc. ICML 30 3
[19] He K, Zhang X, Ren S, Sun J 2015 Proceedings of the IEEE International Conference on Computer Vision Santigago, Chile, December 13–16, 2015 p1026
[20] Kingma D P 2014 arXiv: 1412.6980 [cs.LG]
[21] MacQueen J 1967 Proc. Fifth Berkeley Symp. Math. Stat. Prob. 1 281
[22] Rousseeuw P J 1987 J. Comput. Appl. Math. 20 53
Google Scholar
[23] Fukuda K, Okabe S 1973 J. Phys. Soc. Jpn. 34 315
Google Scholar
[24] Pywell R, Berman B, Kean P, Thompson M 1981 Nucl. Phys. A 369 141
Google Scholar
[25] McNeill K, Pywell R, Berman B, Woodworth J, Thompson M, Jury J 1987 Phys. Rev. C 36 1621
Google Scholar
[26] Ratner B, Sergiyevsky A, Verbitsky S 1977 Nucl. Phys. A 285 71
Google Scholar
[27] Katz L, Cameron A 1951 Can. J. Phys. 29 518
Google Scholar
[28] Norbury J, Thompson M, Shoda K, Tsubota H 1978 Aust. J. Phys. 31 471
Google Scholar
[29] Plaisir C, Hannachi F, Gobet F, Tarisien M, Aléonard M, Méot V, Gosselin G, Morel P, Morillon B 2012 Eur. Phys. J. A 48 68
Google Scholar
[30] Sund R, Baker M, Kull L, Walton R 1968 Phys. Rev. 176 1366
Google Scholar
[31] Dzhilavyan L, Kucher N 1979 Sov. J. Nucl. Phys. 30 151
[32] Berman A, Brown K 1954 Phys. Rev. 96 83
[33] Scott M, Hanson A, Kerst D 1955 Phys. Rev. 100 209
Google Scholar
[34] Owen D, Muirhead E, Spicer B 1968 Nucl. Phys. A 122 177
Google Scholar
[35] Byerly Jr P R, Stephens W 1951 Phys. Rev. 83 54
Google Scholar
[36] Martins M, Hayward E, Lamaze G, Maruyama X, Schima F, Wolynec E 1984 Phys. Rev. C 30 1855
[37] Sund R, Verbinski V 1970 Phys. Rev. C 2 1129
[38] Utsunomiya H, Makinaga A, Goko S, et al. 2006 Phys. Rev. C 74 025806
Google Scholar
[39] Cook B, Hutchinson D, Waring R, Bradford J, Johnson R, Griffn J 1966 Phys. Rev. 143 730
Google Scholar
[40] Belyaev S, Semenov V 1991 Bull. Russ. Acad. Sci. Phys. 55 66
[41] Belyaev S, Kozin A, Nechkin A, Semenov S S, Semenko S 1985 Yad. Fiz. 42 1050
[42] Utsunomiya H, Akimune H, Goko S, et al 2003 Phys. Rev. C 67 015807
Google Scholar
[43] Goko S, Utsunomiya H, Goriely S, et al 2006 Phys. Rev. Lett. 96 192501
Google Scholar
[44] Kondo T, Utsunomiya H, Goriely S, et al 2012 Phys. Rev. C 86 014316
Google Scholar
[45] Birenbaum Y, Berant Z, Kahane S, Wolf A, Moreh R 1995 Phys. Rev. C 51 3496
Google Scholar
-
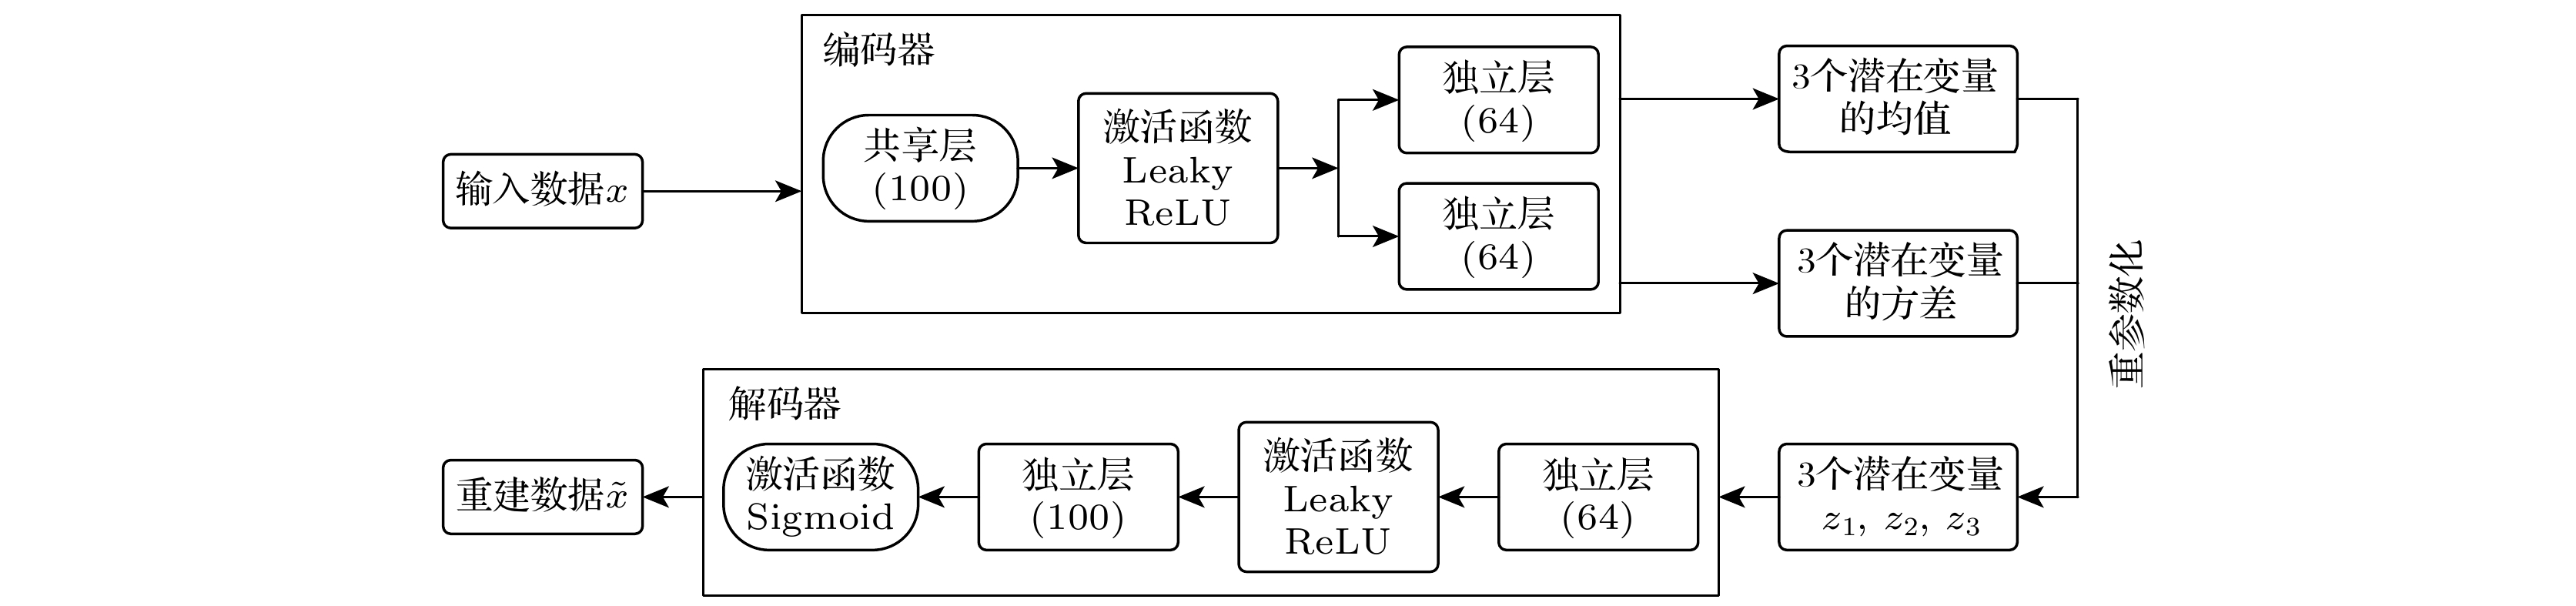
图 1 VAE网络示意图, 括号内为该层神经网络神经元数量
Fig. 1. Schematic diagram of VAE network, with the number of neurons in this layer in parentheses.
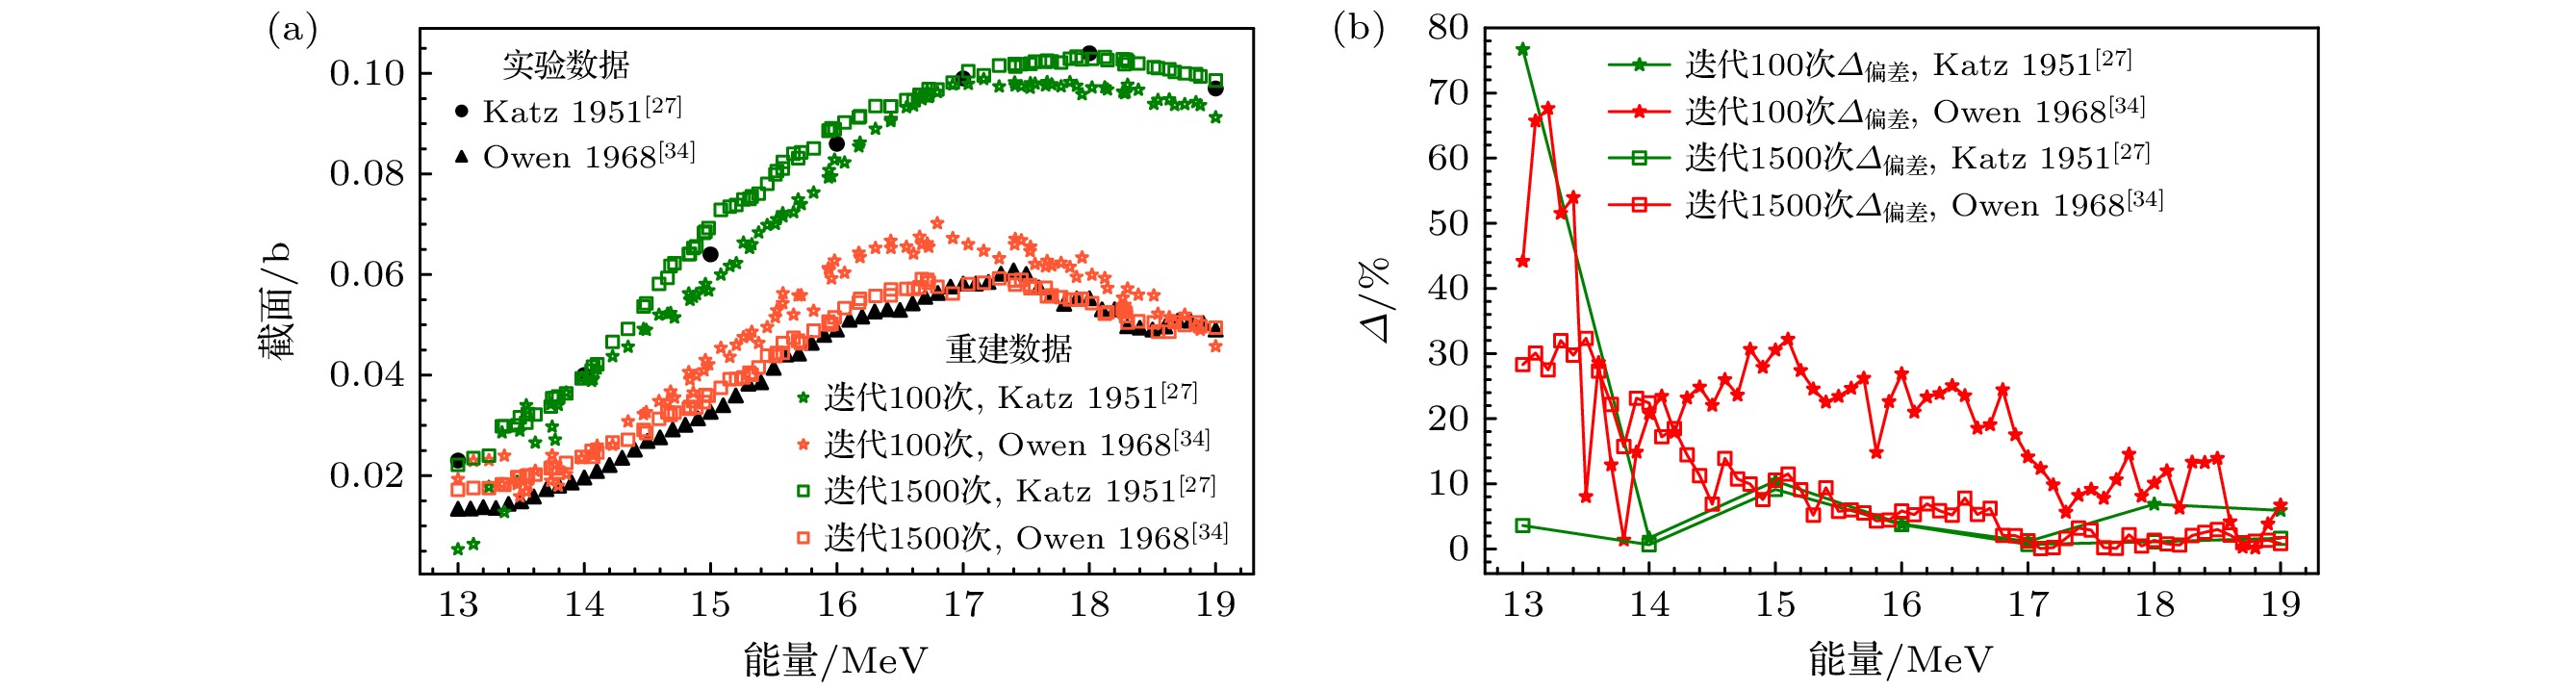
图 3 $ ^{63}\text{Cu} $光中子核反应截面VAE网络100次迭代和1500次迭代训练结果与Katz和Cameron[27]、Owen等[34]的实验测量比对 (a) VAE数据重建结果; (b)重建数据与实验数据的$\varDelta_\text{偏差}$
Fig. 3. Comparison of the $ ^{63}\text{Cu} $ photoneutron reaction cross section training results of the VAE network after 100 and 1500 epochs with experimental measurements by Katz and Cameron[27], and Owen et al.[34]: (a) The VAE data reconstruction results; (b) the $\varDelta_\text{偏差}$ between the reconstructed data and the experimental data.
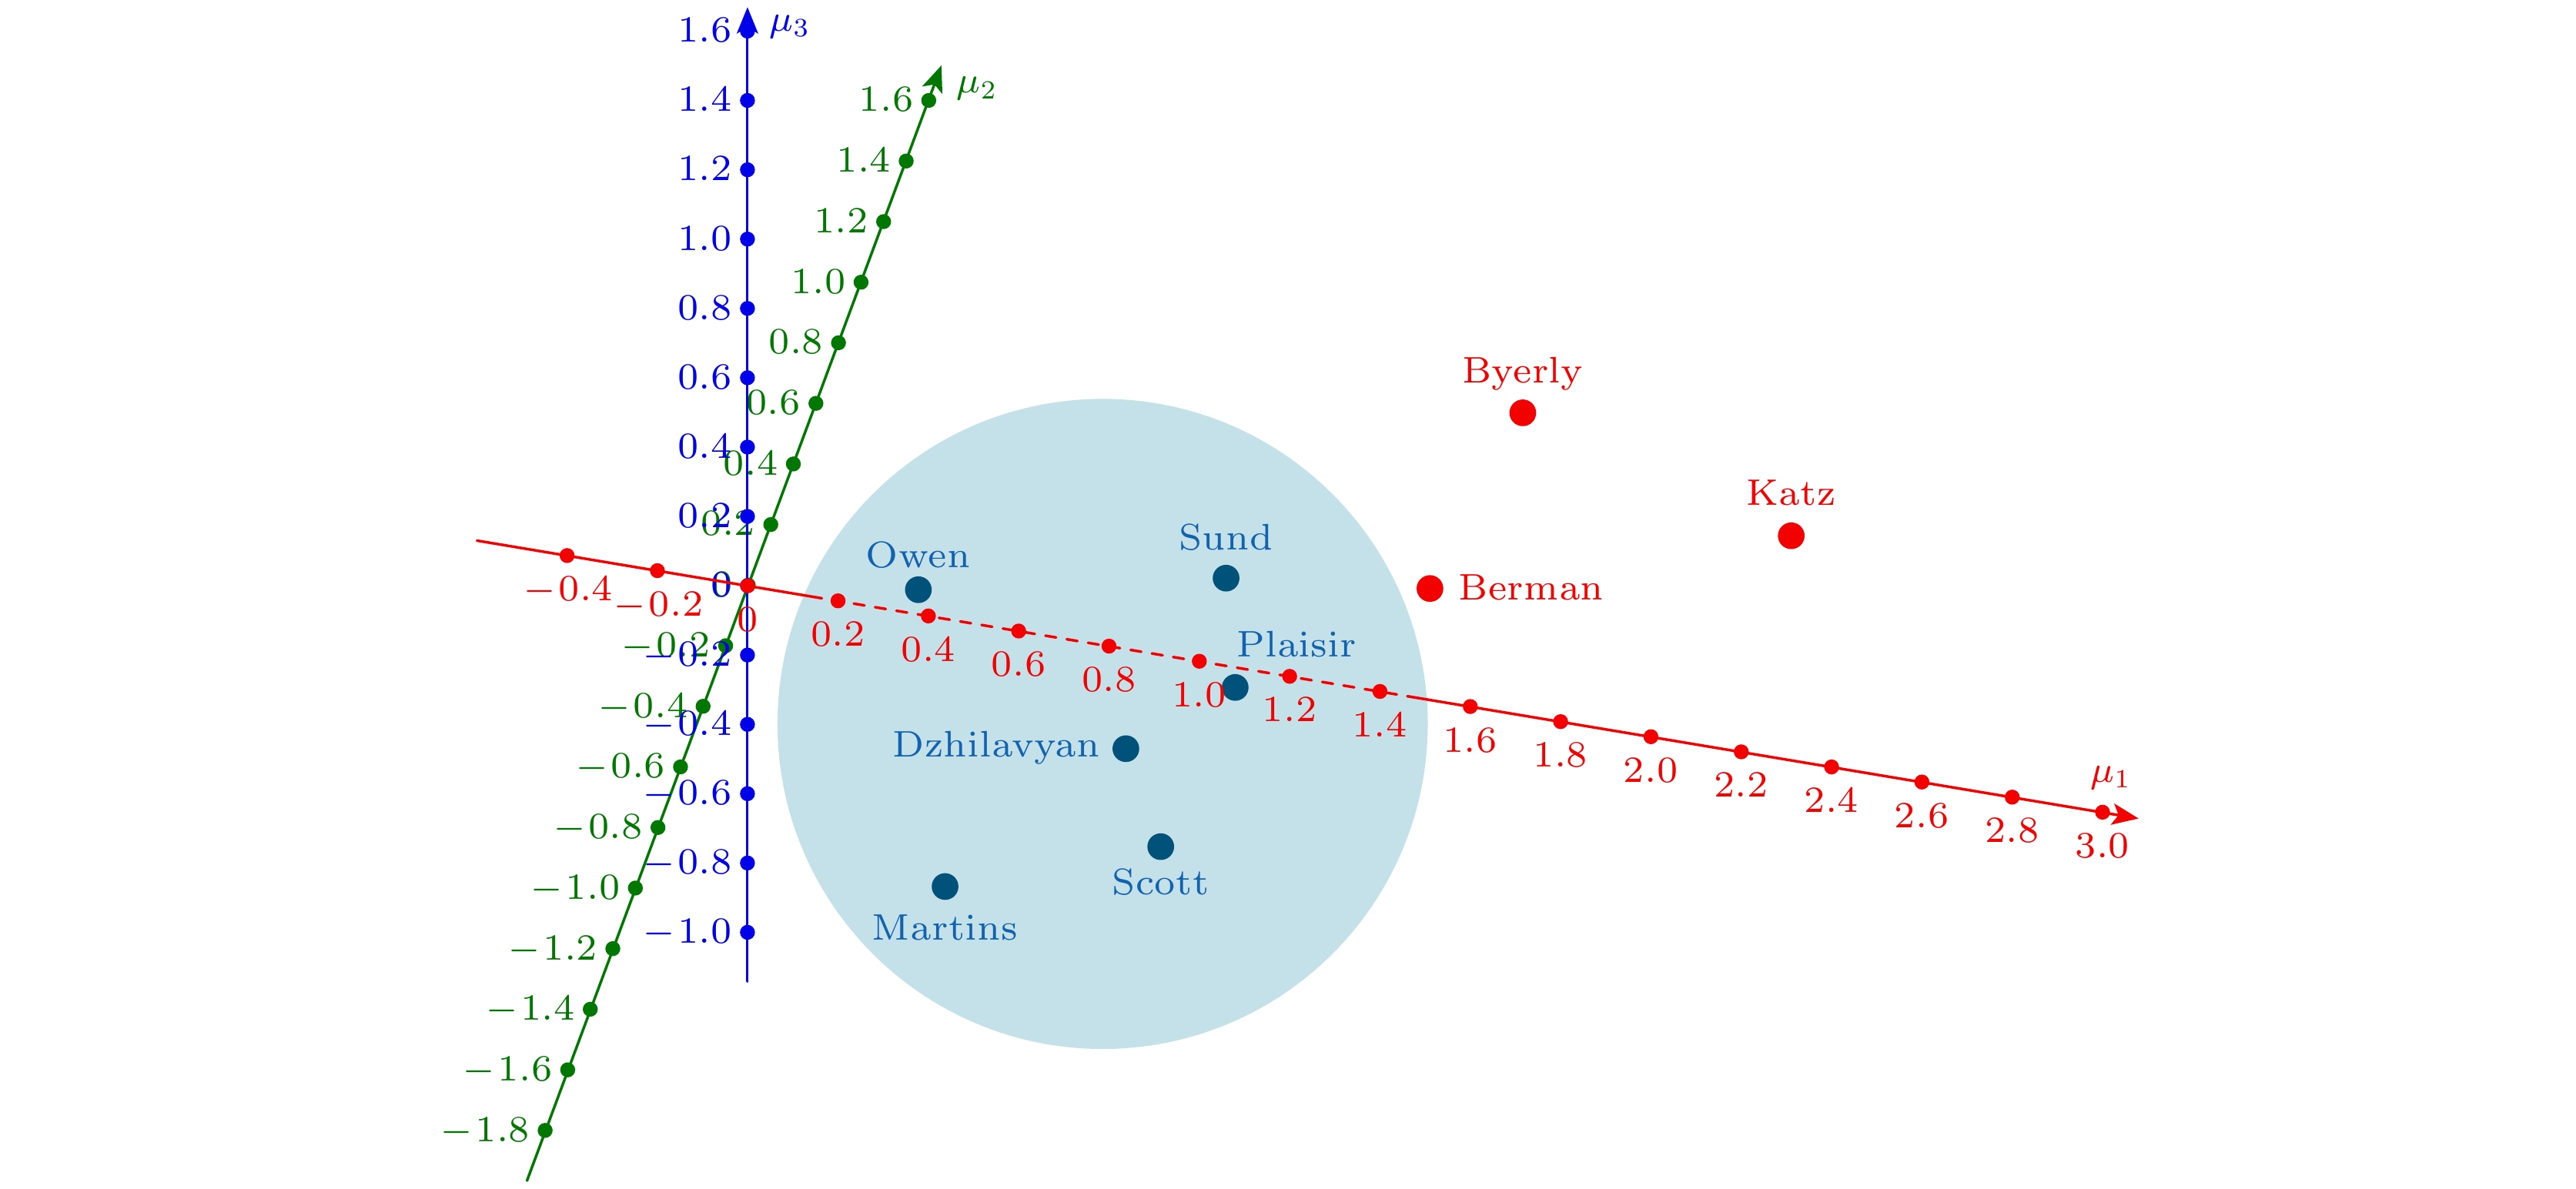
图 4 基于Plaisir等[29]、Sund等[30]、Dzhilavyan和Kucher[31]、Scott等[33]、Owen等[34]、Martins等[36]、Berman和Brown[32]、Katz和Cameron[27]以及Byerly Jr和Stephens等[35]的$ ^{63}\text{Cu} $实验测量的潜在变量的聚类图. 其中, 三个潜在变量的均值μ1, μ2以及μ3作为坐标轴, 浅蓝色圆形阴影为最大成员簇的范围, 蓝色点为属于最大簇的实验测量, 红色为簇之外的实验测量
Fig. 4. Clustering plot of latent variables for experimental measurements $ ^{63}\text{Cu} $, based on the work of Plaisir et al.[29], Sund et al.[30], Dzhilavyan and Kucher[31], Scott et al.[33], Owen et al.[34], Martins et al.[36], Berman and Brown[32], Katz and Cameron[27], Byerly Jr and Stephens[35]. The plot uses three latent variables μ1, μ2 and μ3 as axes. The light blue circular shading represents the range of the largest cluster, with blue dots indicating experimental measurements belonging to the largest cluster, and red dots representing measurements outside the cluster.
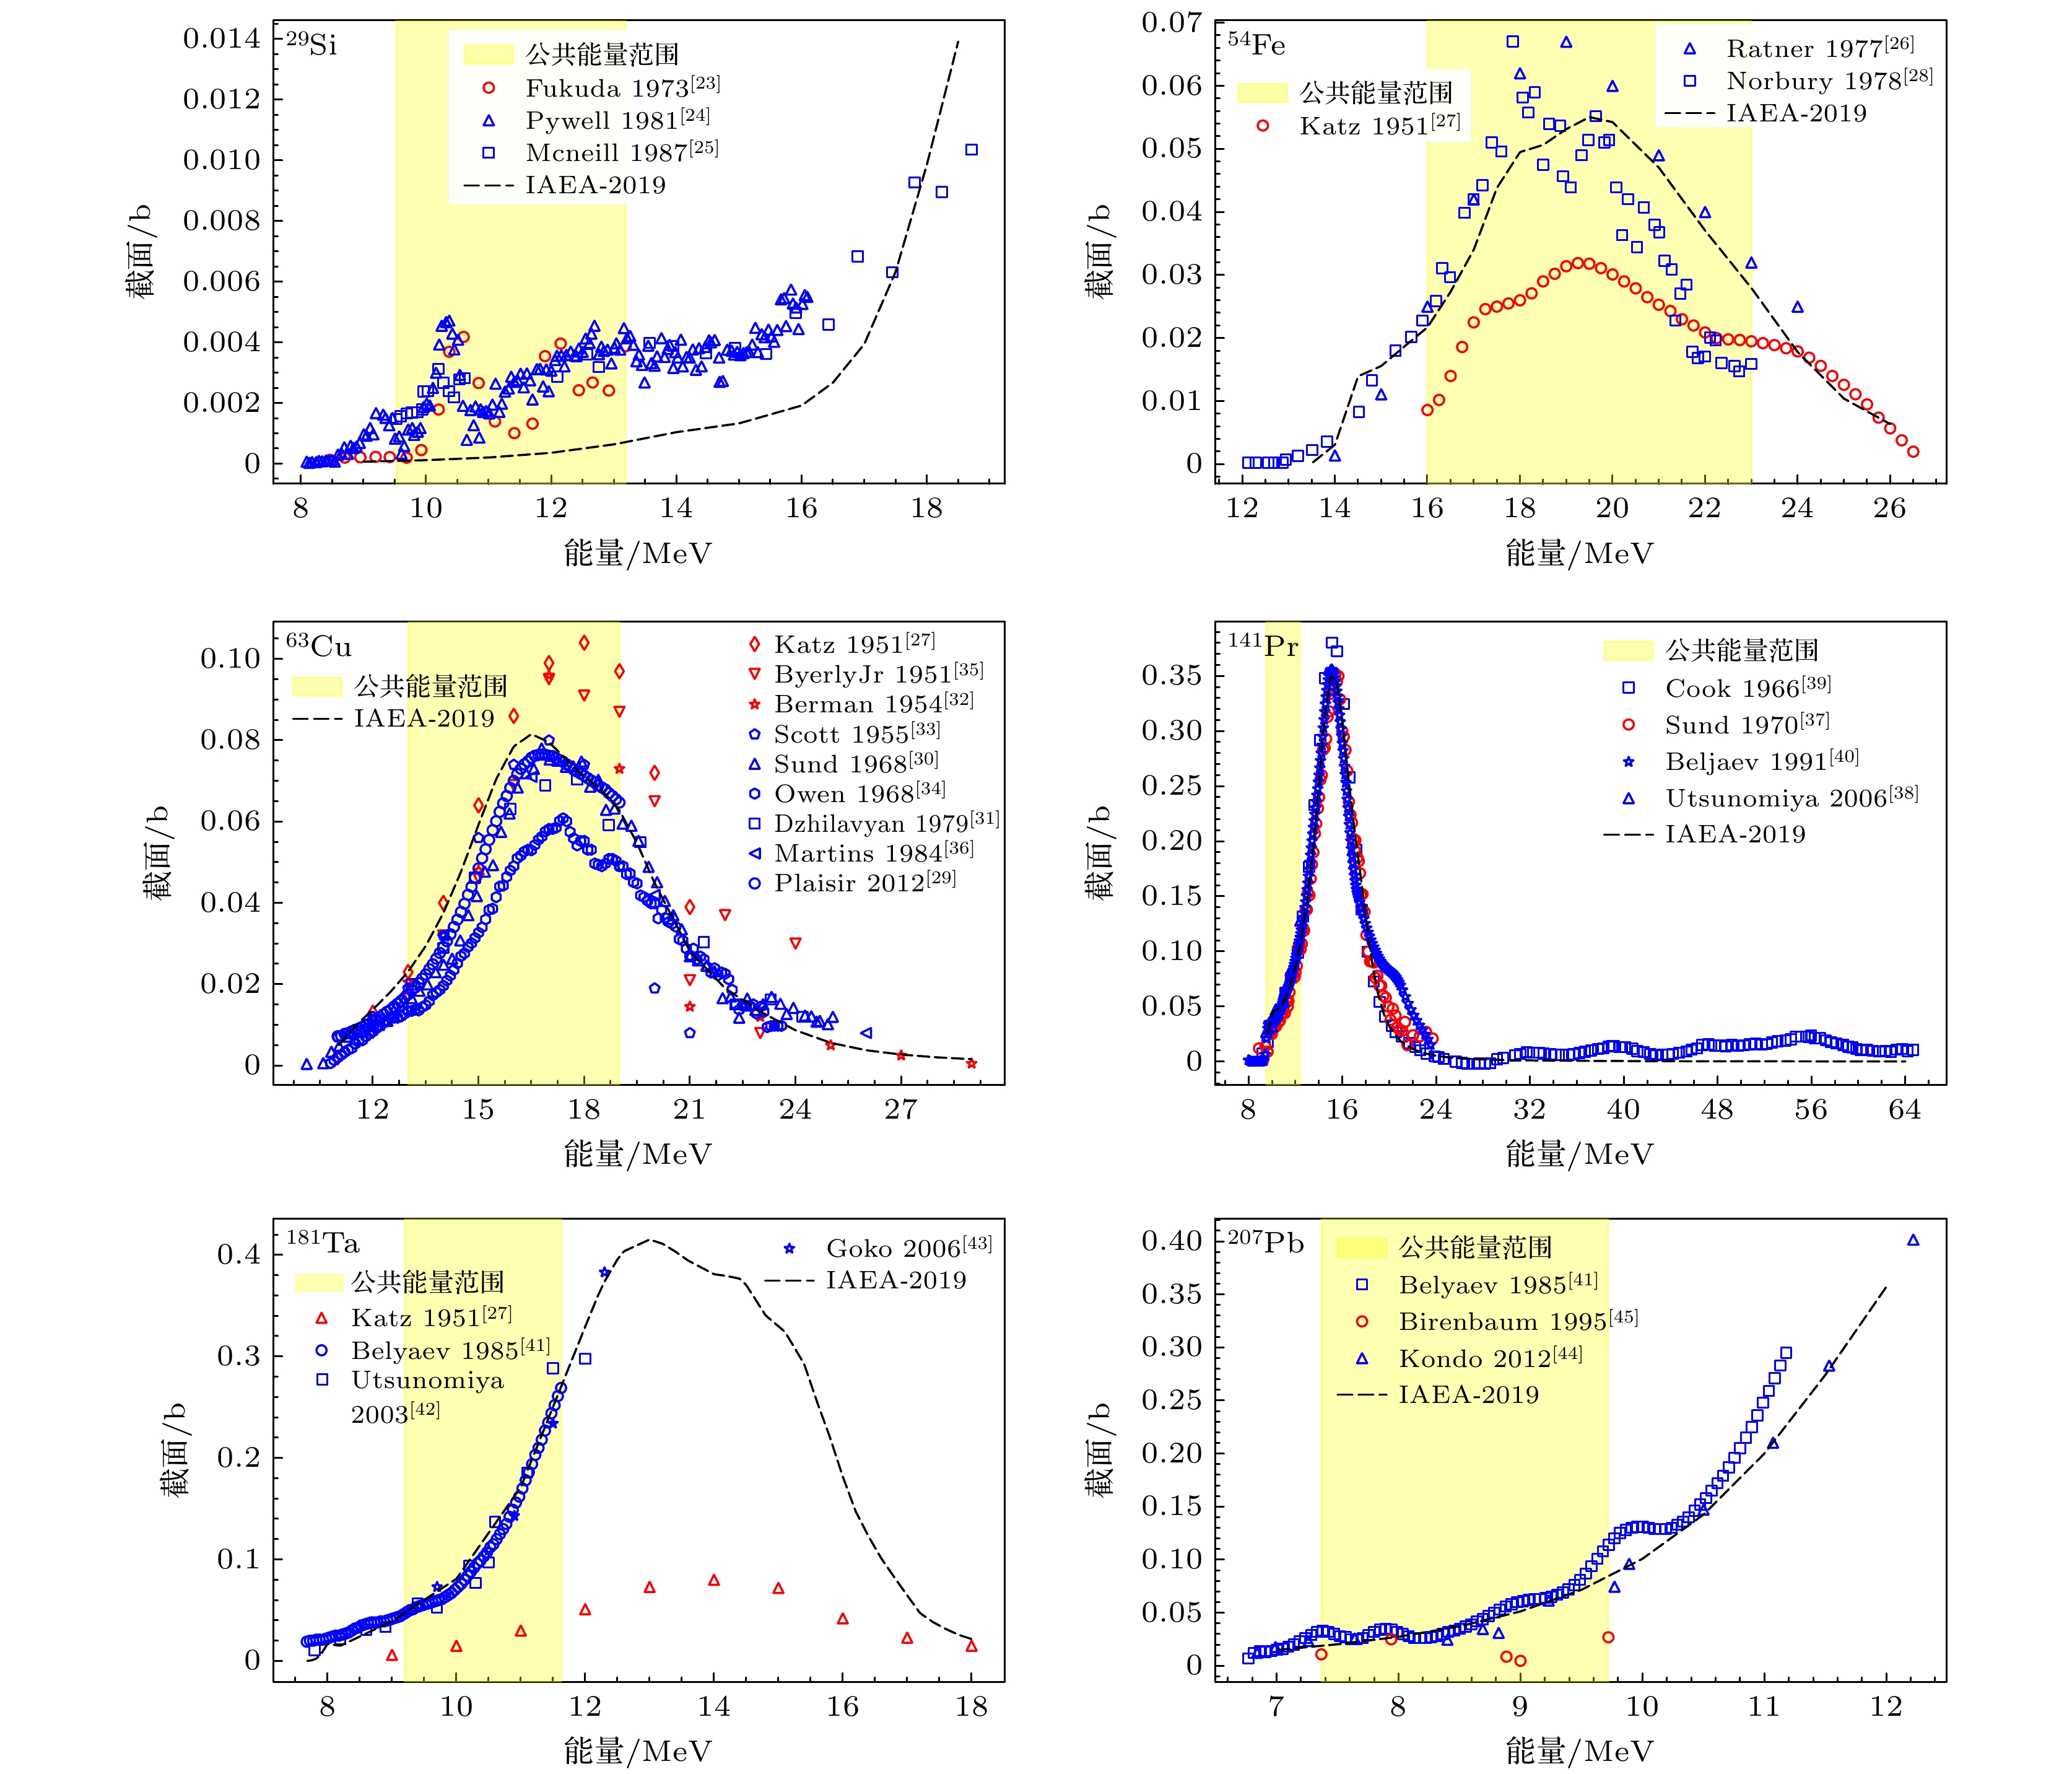
图 5 $ ^{29}\text{Si} $, $ ^{54}\text{Fe} $, $ ^{63}\text{Cu} $, $ ^{141}\text{Pr} $, $ ^{181}\text{Ta} $和$ ^{207}\text{Pb} $的光中子反应截面分布, 包括不同家实验数据(散点)和评价数据库IAEA-2019评估结果(黑色虚线). 黄色区域为所有实验测量的公共能量范围, 红色数据点属于最大成员簇之外的离群数据, 蓝色数据为最大成员簇之内的正常数据. 其中$ ^{141}\text{Pr} $给出了9—13 MeV的放大图
Fig. 5. Photoneutron reaction cross section distributions for $ ^{29}\text{Si} $, $ ^{54}\text{Fe} $, $ ^{63}\text{Cu} $, $ ^{141}\text{Pr} $, $ ^{181}\text{Ta} $, and $ ^{207}\text{Pb} $, including experimental data from different groups (scatter points) and the evaluated database IAEA-2019 results (black dashed line). The yellow region represents the common energy range of all experimental measurements. Red data points correspond to outliers outside the largest cluster, while blue data points belong to normal data within the largest cluster. A zoomed-in plot for $ ^{141}\text{Pr} $ is provided for the 9 MeV to 13 MeV range.
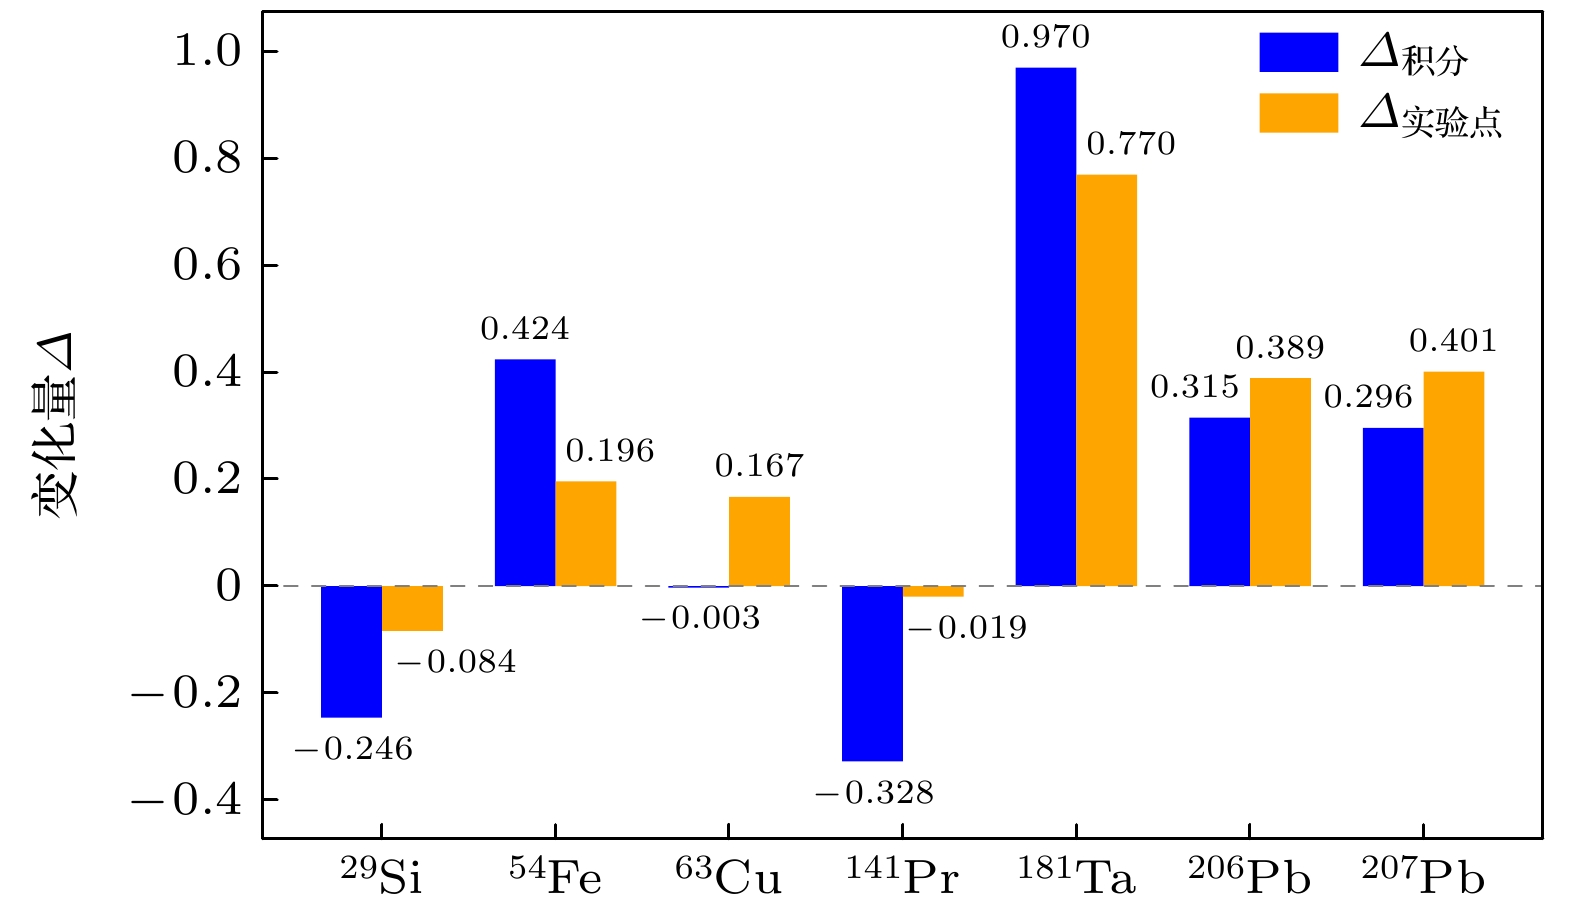
图 6 基于$^{29}\text{Si}$, $^{54}\text{Fe}$, $^{63}\text{Cu}$, $^{141}\text{Pr}$, $^{181}\text{Ta}$, $^{206}\text{Pb}$和$^{207}\text{Pb}$的伽马单中子反应道$\varDelta_\text{积分}$和$\varDelta_{\text{实验点}}$变化量图
Fig. 6. Graph of the amount of change in (γ, n) reaction channel $\varDelta_\text{积分}$ and $\varDelta_\text{实验点}$ based on $^{29}\text{Si}$, $^{54}\text{Fe}$, $^{63}\text{Cu}$, $^{141}\text{Pr}$, $^{181}\text{Ta}$, $^{206}\text{Pb}$, and $^{207}\text{Pb}$.
表 1 $^{29}\text{Si}$到$^{207}\text{Pb}$共7个核素的实验测量信息汇总表
Table 1. Summary table of experimental measurement information for 7 nuclides from $^{29}\text{Si}$ to $^{207}\text{Pb}$.
核素 年份 第一作者 机构所属
国家机构 光源 能量区间 能点数 参考文献 $^{29}\text{Si}$ 1973 K.Fukuda 日本 Radiation Centre of Osaka Prefecture Bremsstrahlung 8.46—13.19 20 [23] 1981 R.E.Pywell 澳大利亚 University of Melbourne Bremsstrahlung 8.09—16.09 162 [24] 1987 K.G.Mcneill 加拿大 University of Toronto Annihilation radiation 9.52—18.71 29 [25] $^{54}\text{Fe}$ 1977 B.S.Ratner 俄罗斯 Institute for Nuclear Research of the Russian Academy of Sciences Bremsstrahlung 16.00—26.50 43 [26] 1951 L.Katz 加拿大 University of Saskatchewan Bremsstrahlung 14.00—24.00 11 [27] 1978 J.W.Norbury 澳大利亚 University of Melbourne Bremsstrahlung 12.13—23.00 57 [28] $^{63}\text{Cu}$ 2012 C.Plaisir 法国 Centre d’Etudes Nucleaires de Bordeaux-Gradignan Bremsstrahlung 11.00—19.00 81 [29] 1968 R.E.Sund 美国 Gulf General Atomic Annihilation radiation 10.12—25.06 66 [30] 1979 L.Z.Dzhilavyan 俄罗斯 Institute for Nuclear Research of the Russian Academy of Sciences Annihilation radiation 12.10—24.20 14 [31] 1954 A.I.Berman 美国 Stanford University Bremsstrahlung 13.00—29.00 9 [32] 1951 L.Katz 加拿大 University of Saskatchewan Bremsstrahlung 11.00—21.00 11 [27] 1955 M.B.Scott 美国 University of Illinois Bremsstrahlung 11.00—21.00 11 [33] 1968 D.G.Owen 澳大利亚 University of Melbourne Bremsstrahlung 10.80—23.60 129 [34] 1951 P.R.Byerly Jr 美国 University of Pennsylvania Bremsstrahlung 12.00—24.00 13 [35] 1984 M.N.Martins 美国 National Institute of Standards and Technology Virtual photons 11.00—30.00 5 [36] $^{141}\text{Pr}$ 1970 R.E.Sund 美国 Gulf General Atomic — 8.89—23.69 100 [37] 2006 H.Utsunomiya 日本 Konan University Compton scattering 9.50—12.40 9 [38] 1966 B.C.Cook 美国 Iowa State University Bremsstrahlung 9.19—64.68 113 [39] 1991 S.N.Belyaev 俄罗斯 Saratov Gosudarstvennyi University Bremsstrahlung 7.98—23.52 185 [40] $^{181}\text{Ta}$ 1985 S.N.Belyaev 俄罗斯 Saratov Gosudarstvennyi University Bremsstrahlung 7.68—11.63 80 [41] 1951 L.Katz 加拿大 University of Saskatchewan Bremsstrahlung 9.00—18.00 10 [27] 2003 H.Utsunomiya 日本 Konan University Compton scattering 7.80—12.00 13 [42] 2006 S.Goko 日本 Konan University Laser Compton
Scattered Photons9.20—12.30 6 [43] $^{206}\text{Pb}$ 2012 T.Kondo 日本 Konan University Laser Compton
Scattered Photons8.14—12.24 11 [44] 1985 S.N.Belyaev 俄罗斯 Saratov Gosudarstvennyi University Bremsstrahlung 8.10—12.35 88 [41] 1995 Y.Birenbaum 以色列 Ben Gurion University
of the NegevMonoenergetic photons 8.88—11.39 4 [45] $^{207}\text{Pb}$ 1995 Y.Birenbaum 以色列 Ben Gurion University
of the NegevMonoenergetic photons 7.37—9.72 5 [45] 2012 T.Kondo 日本 Konan University Laser Compton
Scattered Photons6.84—12.22 14 [44] 1985 S.N.Belyaev 俄罗斯 Saratov Gosudarstvennyi University Bremsstrahlung 6.77—11.18 95 [41]  下载: 导出CSV
-
[1] International Atomic Energy Agency 2000 Handbook on Photonuclear Data for Applications: Cross-sections and Spectra (Vienna: IAEA) pp1–284
[2] Obložinskỳ P 2002 J. Nucl. Sci. Technol. 39 31
[3] Dietrich S S, Berman B L 1988 At. Data Nucl. Data Tables 38 199
Google Scholar
[4] Kawano T, Cho Y, Dimitriou P, et al. 2020 Nucl. Data Sheets 163 109
Google Scholar
[5] Carleo G, Cirac I, Cranmer K, Daudet L, Schuld M, Tishby N, Vogt-Maranto L, Zdeborová L 2019 Rev. Mod. Phys. 91 045002
Google Scholar
[6] He W, Li Q, Ma Y, Niu Z, Pei J, Zhang Y 2023 Sci. China Phys. Mech. Astron. 66 282001
Google Scholar
[7] He W B, Ma Y G, Pang L G, Song H C, Zhou K 2023 Nucl. Sci. Tech. 34 88
Google Scholar
[8] Bai J, Niu Z, Sun B, Niu Y 2021 Phys. Lett. B 815 136147
Google Scholar
[9] Xing K, Sun X J, Xu R R, Zou F L, Hu Z H, Wang J M, Tao X, Sun X D, Tian Y, Niu Z M 2024 Phys. Lett. B 855 138825
Google Scholar
[10] Li W, Liu L, Niu Z, Niu Y, Huang X 2024 Phys. Rev. C 109 044616
Google Scholar
[11] Bardhan J, Mandal T, Mitra S, Neeraj C, Patra M 2024 Eur. Phys. J. Spec. Top. 233 2559
Google Scholar
[12] Mitra S, Choi H, Liu S, Glatt R, Wendt K, Schunck N 2024 arXiv: 2404.02332 [nucl-th]
[13] Fox J M, Wendt K A 2024 arXiv: 2403.16389 [nucl-th]
[14] Kingma D P 2013 arXiv: 1312.6114 [stat.ML]
[15] Otuka N, Dupont E, Semkova V, et al. 2014 Nucl. Data Sheets 120 272
[16] Higgins I, Matthey L, Pal A, Burgess C P, Glorot X, Botvinick M M, Mohamed S, Lerchner A 2017 ICLR (Poster) 3
[17] Parzen E 1962 Ann. Math. Stat. 33 1065
Google Scholar
[18] Maas A L, Hannun A Y, Ng A Y, et al. 2013 Proc. ICML 30 3
[19] He K, Zhang X, Ren S, Sun J 2015 Proceedings of the IEEE International Conference on Computer Vision Santigago, Chile, December 13–16, 2015 p1026
[20] Kingma D P 2014 arXiv: 1412.6980 [cs.LG]
[21] MacQueen J 1967 Proc. Fifth Berkeley Symp. Math. Stat. Prob. 1 281
[22] Rousseeuw P J 1987 J. Comput. Appl. Math. 20 53
Google Scholar
[23] Fukuda K, Okabe S 1973 J. Phys. Soc. Jpn. 34 315
Google Scholar
[24] Pywell R, Berman B, Kean P, Thompson M 1981 Nucl. Phys. A 369 141
Google Scholar
[25] McNeill K, Pywell R, Berman B, Woodworth J, Thompson M, Jury J 1987 Phys. Rev. C 36 1621
Google Scholar
[26] Ratner B, Sergiyevsky A, Verbitsky S 1977 Nucl. Phys. A 285 71
Google Scholar
[27] Katz L, Cameron A 1951 Can. J. Phys. 29 518
Google Scholar
[28] Norbury J, Thompson M, Shoda K, Tsubota H 1978 Aust. J. Phys. 31 471
Google Scholar
[29] Plaisir C, Hannachi F, Gobet F, Tarisien M, Aléonard M, Méot V, Gosselin G, Morel P, Morillon B 2012 Eur. Phys. J. A 48 68
Google Scholar
[30] Sund R, Baker M, Kull L, Walton R 1968 Phys. Rev. 176 1366
Google Scholar
[31] Dzhilavyan L, Kucher N 1979 Sov. J. Nucl. Phys. 30 151
[32] Berman A, Brown K 1954 Phys. Rev. 96 83
[33] Scott M, Hanson A, Kerst D 1955 Phys. Rev. 100 209
Google Scholar
[34] Owen D, Muirhead E, Spicer B 1968 Nucl. Phys. A 122 177
Google Scholar
[35] Byerly Jr P R, Stephens W 1951 Phys. Rev. 83 54
Google Scholar
[36] Martins M, Hayward E, Lamaze G, Maruyama X, Schima F, Wolynec E 1984 Phys. Rev. C 30 1855
[37] Sund R, Verbinski V 1970 Phys. Rev. C 2 1129
[38] Utsunomiya H, Makinaga A, Goko S, et al. 2006 Phys. Rev. C 74 025806
Google Scholar
[39] Cook B, Hutchinson D, Waring R, Bradford J, Johnson R, Griffn J 1966 Phys. Rev. 143 730
Google Scholar
[40] Belyaev S, Semenov V 1991 Bull. Russ. Acad. Sci. Phys. 55 66
[41] Belyaev S, Kozin A, Nechkin A, Semenov S S, Semenko S 1985 Yad. Fiz. 42 1050
[42] Utsunomiya H, Akimune H, Goko S, et al 2003 Phys. Rev. C 67 015807
Google Scholar
[43] Goko S, Utsunomiya H, Goriely S, et al 2006 Phys. Rev. Lett. 96 192501
Google Scholar
[44] Kondo T, Utsunomiya H, Goriely S, et al 2012 Phys. Rev. C 86 014316
Google Scholar
[45] Birenbaum Y, Berant Z, Kahane S, Wolf A, Moreh R 1995 Phys. Rev. C 51 3496
Google Scholar

 下载:
下载:
计量
- 文章访问数: 2614
- PDF下载量: 63
- 被引次数: 0
