


-
Metal nanostructures have great potential for generating and regulating structural color. In this paper, an array structure based on silver nano asymmetric coaxial cavity is designed to study the influence of ring cavity on the generation and regulation of structural color. The ordered array of asymmetric coaxial cavity is simulated by the finite difference time domain method, and the influence of structural parameters on structural color is obtained. The results show that by adjusting the depth, opening size and thickness of coaxial cavity, the rich structural colors can be produced. The experimental results and the simulation results are basically consistent with each other. Compared with the coaxial cavity with symmetrical structure, the asymmetric metal nanostructure proposed in this work has good adjustability in color display, and has potential applications in color imaging, high-resolution imaging, anti-counterfeiting, and so on.
-
Keywords:
- isoionization element on cylindrical surface /
- structural color /
- asymmetric coaxial cavity
[1] Kolle M, Pedro M S, Maik R J S 2010 Nat. Nanotechnol. 5 511
 Google Scholar
[2] Noh H, Liew S F, Saranathan V 2010 Adv. Mater. 22 2871
Google Scholar
[3] Rassart M, Simonis P, Bay A 2009 Phys. Rev. E 80 031910
Google Scholar
[4] Parker A R, Welch V L, Driver D 2003 Nature 426 786
Google Scholar
[5] Roberts A S, Pors A, Albrektsen O, Bozhevolnyi S I 2014 Nano Lett. 14 783
Google Scholar
[6] VarPhilips R W, Bleikolm A F 1996 Appl. Opt. 35 5529
Google Scholar
[7] Liu X Y, Zhu S M, Zhang D 2010 Mater. Lett. 64 2745
Google Scholar
[8] Guo D Z, Hou S M, Xue Z Q 2002 Chin. Phys. Lett. 19 385
Google Scholar
[9] 成建新, 周 盈, 常建华, 倪海彬 2021 光通信研究与应用 47 41
Cheng J X, Zhou Y, Chang J H, Ni H B 2021 Study on Optical Communications 47 41
[10] Murphy A, Sonnefraud Y, Krasavin A V, Ginzburg P, Morgan F, McPhillips J, Wurtz G, Maier S A, Zayats A V, Pollard R 2013 Appl. Phys. Lett. 102 103103
Google Scholar
[11] Dong Z, Ho J, Yu Y F, Fu Y H, Paniagua-Dominguez R, Wang S, Kuznetsov A I, Yang J K W 2017 Nano Lett. 17 7620
Google Scholar
[12] Vandehaar M A, Maas R, Brenny B, Polman A 2016 New J. Phys. 18 043016
Google Scholar
[13] Ni H B, Wang M, Shen T, Zhou J 2015 ACS Nano 9 1913
Google Scholar
[14] 戴琦, 付娆, 邓联贵, 李嘉鑫, 郑国兴 2019 应用光学 40 1045
Google Scholar
Dai Q, Fu R, Deng L G, Li J X, Zheng G X 2019 Appl. Opt. 40 1045
Google Scholar
[15] 杨悦, 王珏玉, 赵敏, 崔岱宗 2019 化学进展 31 1007
Yang Y, Wang J Y, Zhao M, Cui D Z 2019 Prog Chem. 31 1007
[16] Karmakar S, Behera D 2019 Ceram. Int. 45 237
[17] Abdolahi M, Jiang H, Kaminska B 2019 Nat. Nanotechnol. 30 405301
Google Scholar
[18] 钟敏, 史先春 2020 红外与毫米波学报 39 576
Google Scholar
Zhong M, Shi X C 2020 J. Infrared Millimeter 39 576
Google Scholar
[19] 张浩驰, 何沛航, 牛凌云, 张乐鹏, 崔铁军 2021 光学学报 41 372
Zhang H C, He P H, Niu L Y, Zhang L P, Cui T J 2021 Acta Opt. Sin. 41 372
-
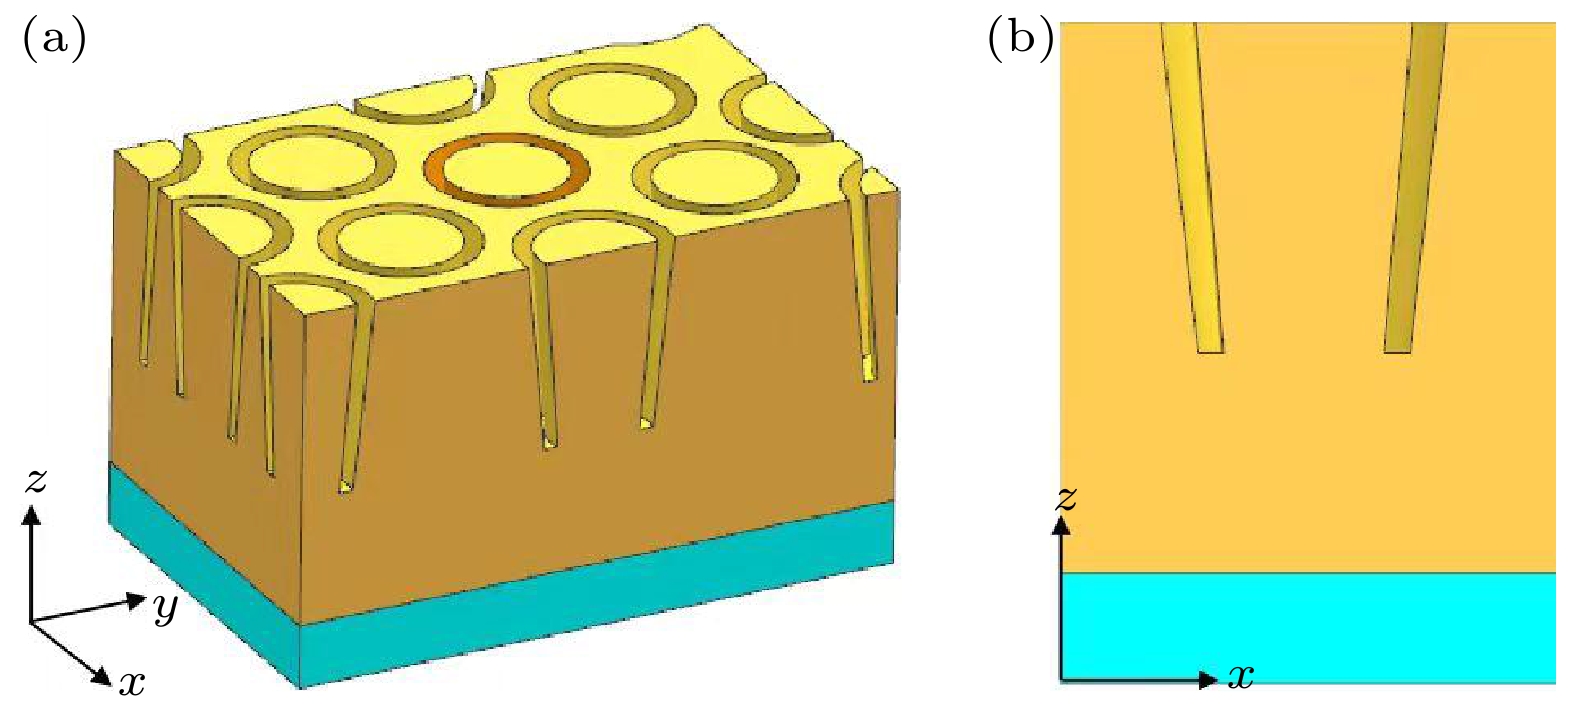
图 1 模型结构示意图 (a) 三维图; (b) 剖面图
Figure 1. Model structure diagram: (a) Three dimensional diagram; (b) section diagram.
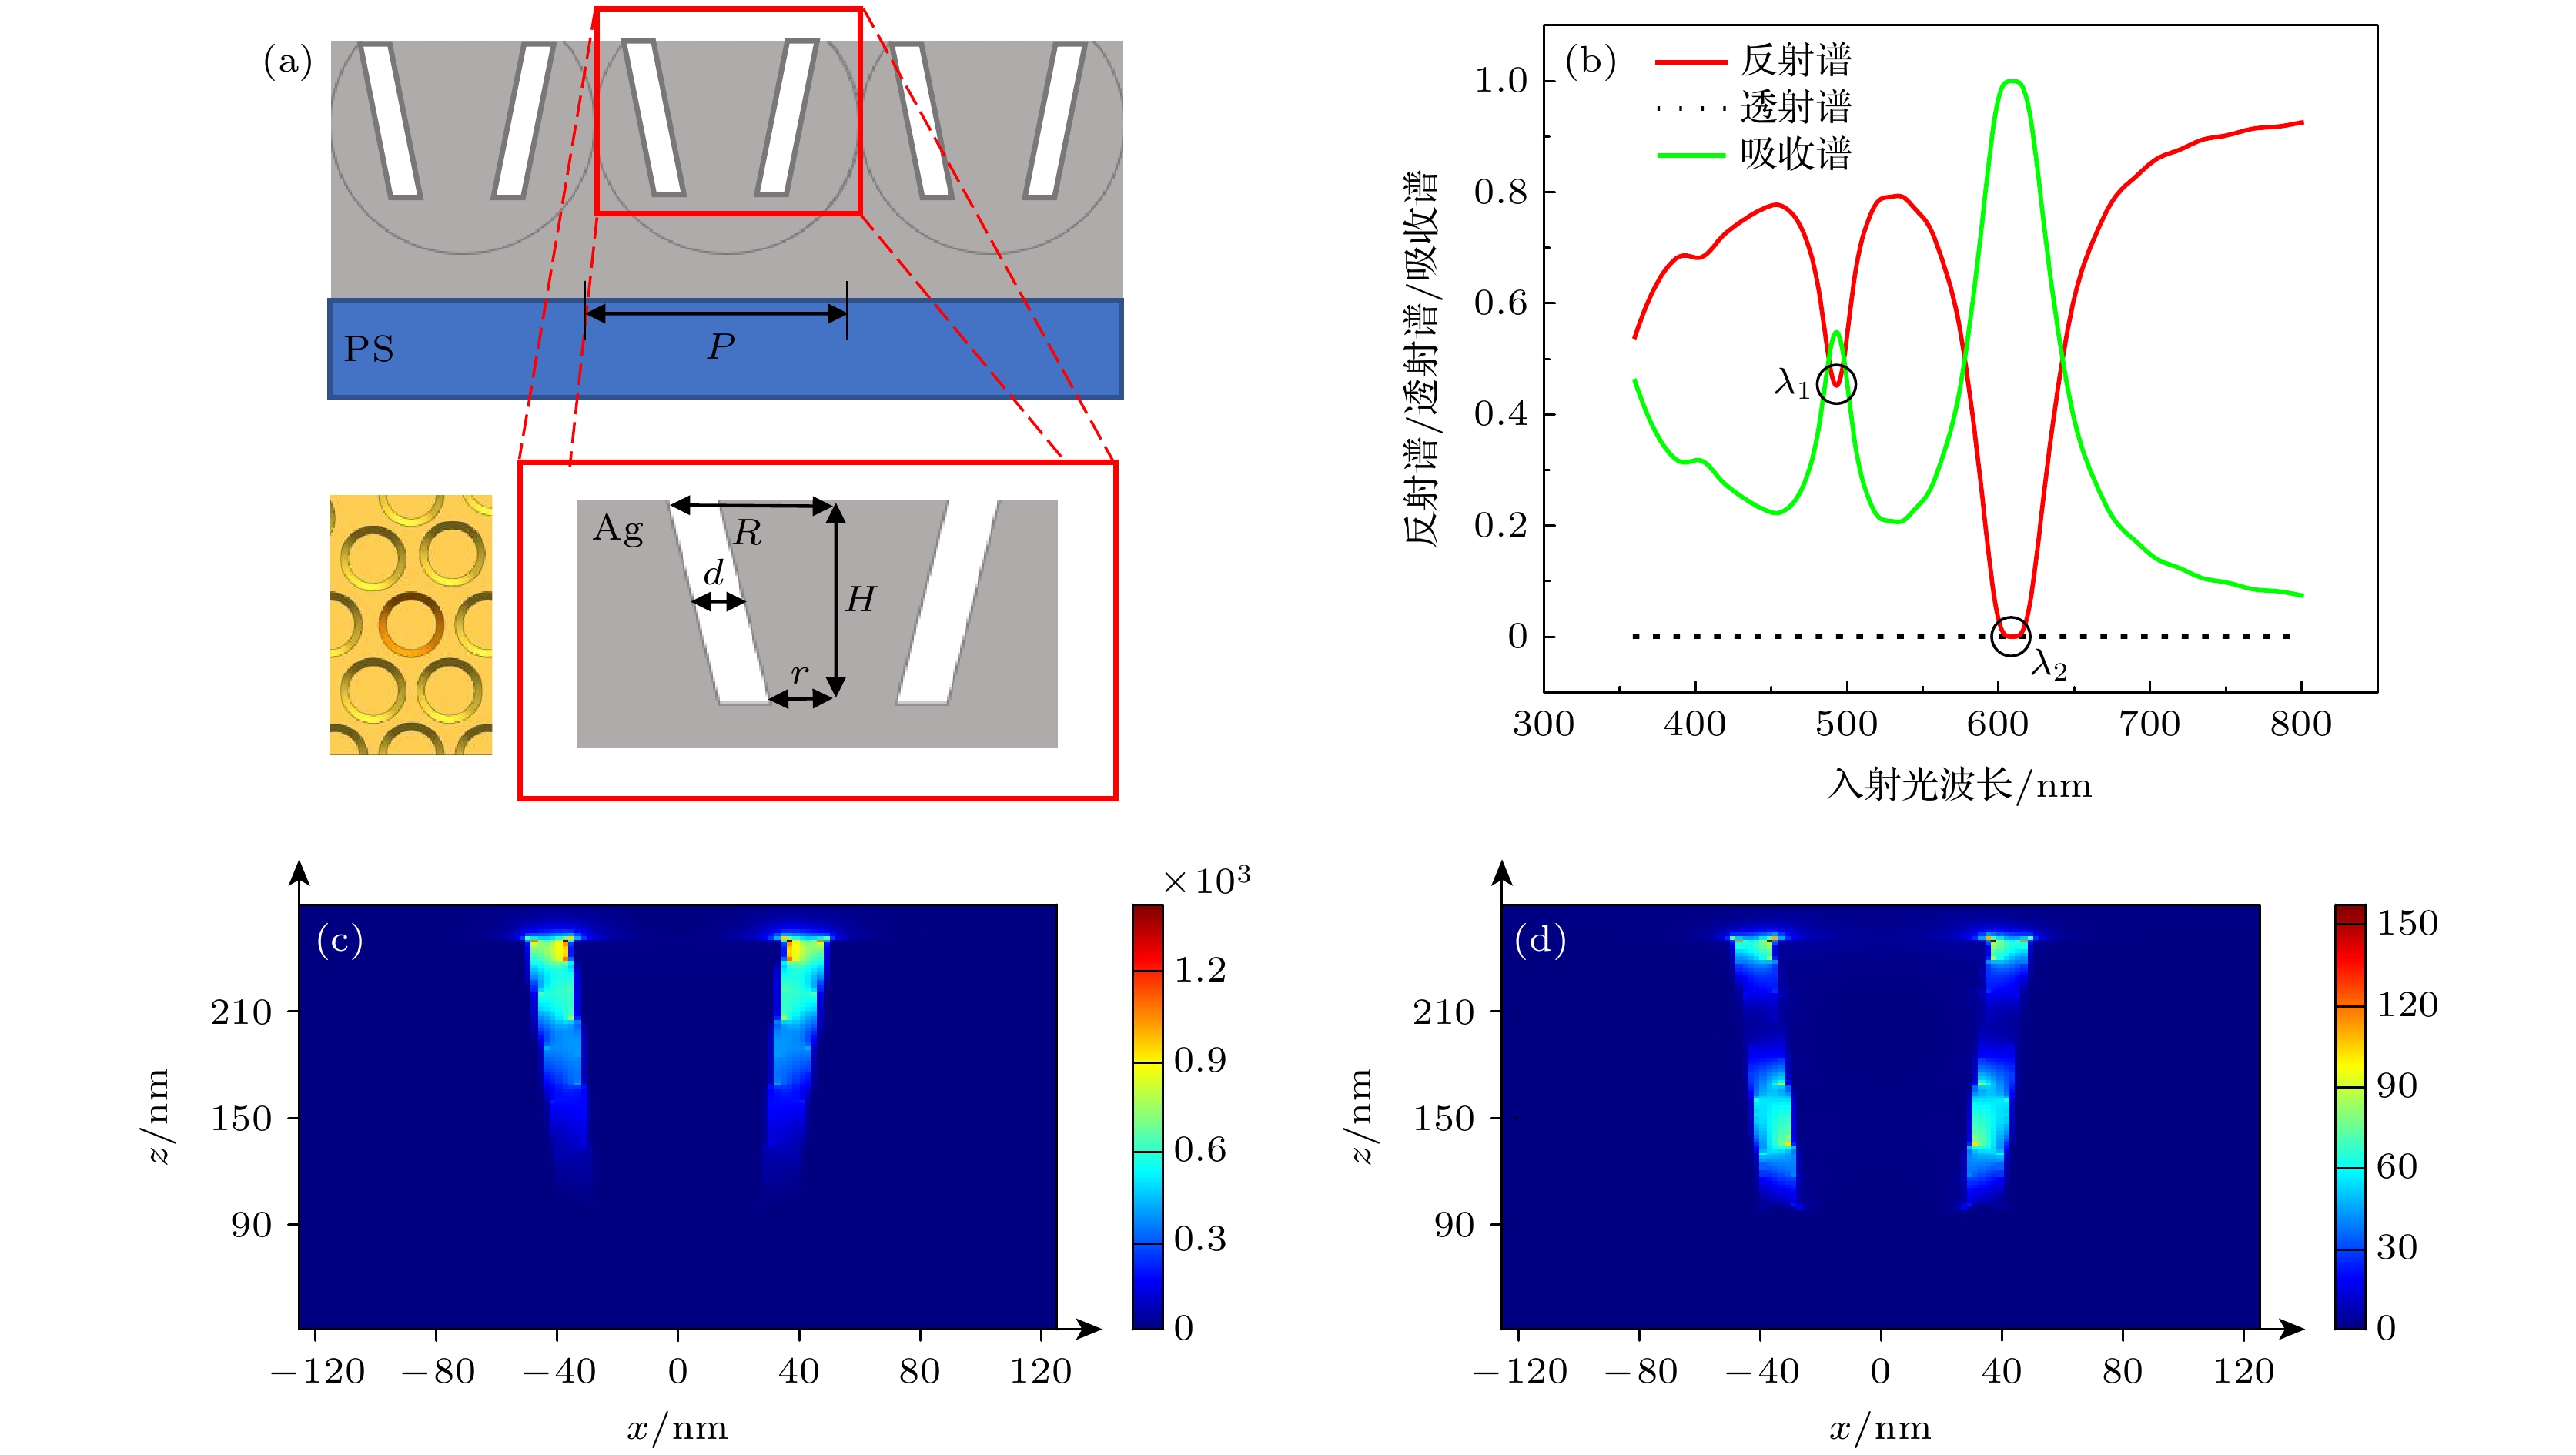
图 2 结构与仿真结果 (a) 具有指定几何参数的同轴纳米腔的结构参数示意图; (b) 当单个非对称共轴腔的结构参数为H = 150 nm, R = 55 nm, r = 35 nm, d = 10 nm, P = 250 nm的反射、透射、吸收谱光谱图; (c) λ1 = 490 nm和(d) λ2 = 610 nm共振波长处竖直截面的电场分布图
Figure 2. Structure and simulation: (a) Single interface diagram of coaxial nano-cavity with specified geometric parameters; (b) reflection, transmission and absorption spectra of a single asymmetric coaxial cavity with H = 150 nm, R = 55 nm, r = 35 nm, d = 10 nm, P = 250 nm; cross section electric field distributions at (c) λ1 = 490 and (d) λ2 = 610 nm resonance wavelengths.

图 3 实验图 (a)共轴腔结构SEM俯视图; (b)共轴腔结构截面SEM图; (c)结构色显微镜图; (d)—(f) 实验与仿真反射光谱对照图
Figure 3. SEM image of (a) coaxial cavity arrays and (b) cross section of coaxial cavities; (c) optical microscope image of coaxial cavi-ty arrays with different structure parameters; (d)–(f) comparison between experiments and simulation results.
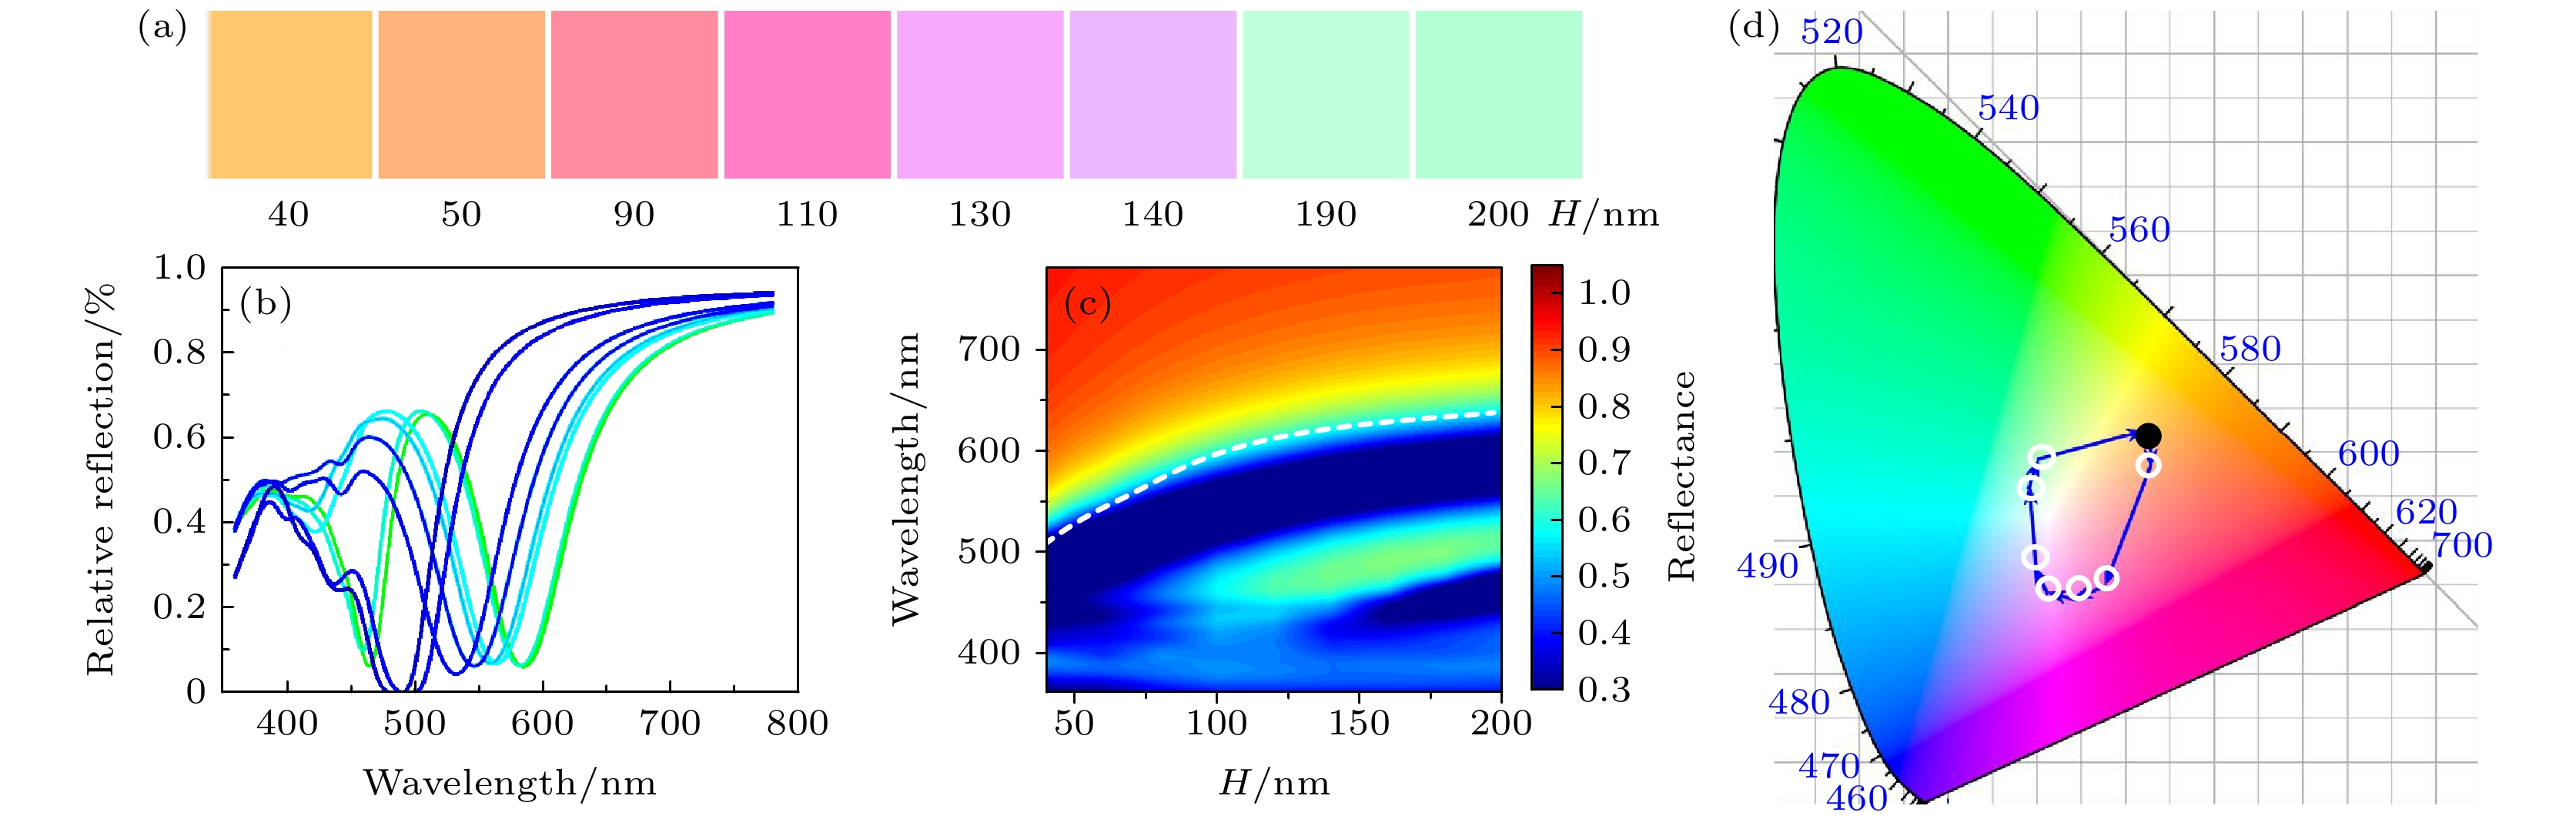
图 4 结构色及光谱图 (a) R = 75 nm, r = 35 nm, d = 30 nm, P = 250 nm时, 共轴腔深度H从40 nm增加到200 nm时结构色的变化; (b), (c)不同共轴腔深度H时的反射光谱; (d)与深度H变化对应的颜色变化路径图
Figure 4. Structural color and reflectance spectrum comparison diagram: (a) When R = 75 nm, r = 35 nm, d = 30 nm, P = 250 nm, the structural color changes when the coaxial cavity depth H increases from 40 nm to 200 nm; (b) , (c) reflection spectra at different coaxial cavity depths H
; (d) trace of displayed colors as H varies 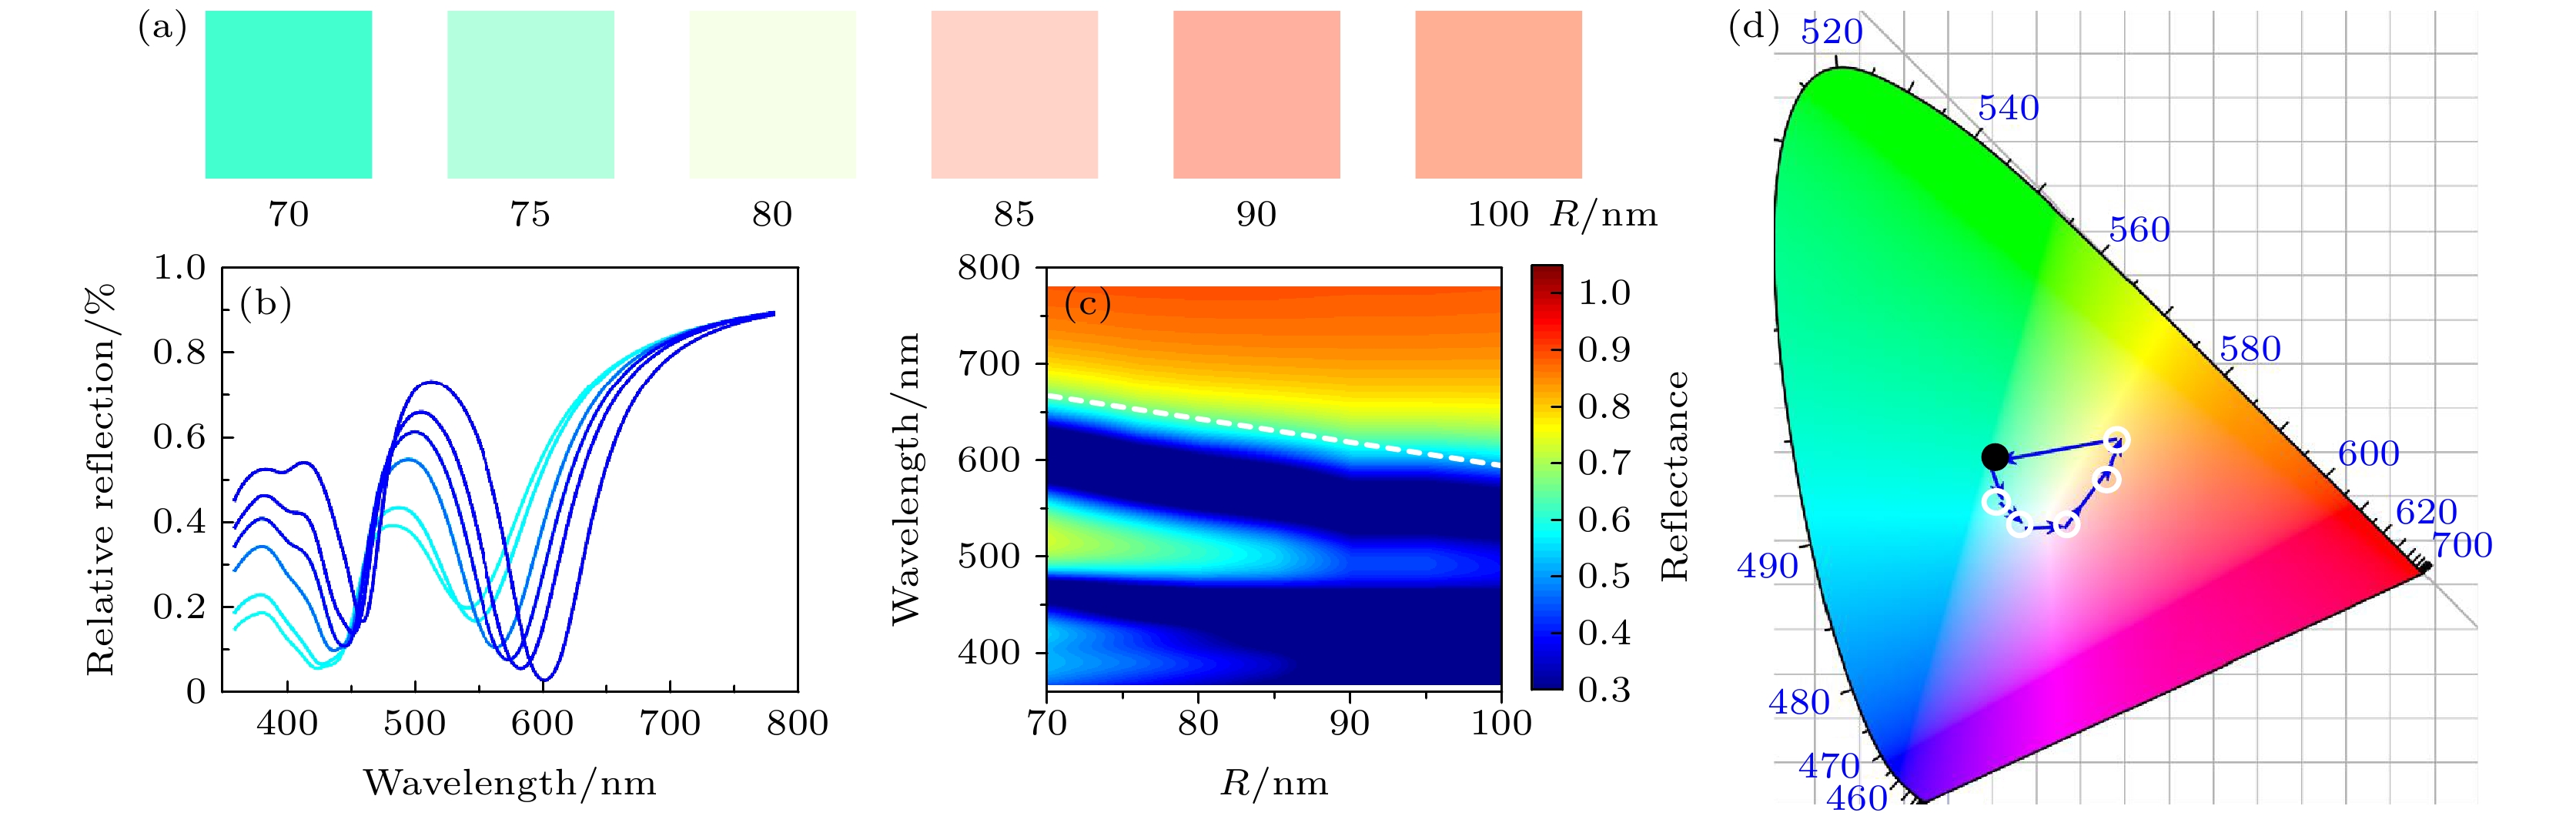
图 5 结构色及光谱对比图 (a) H = 150 nm, r = 35 nm, P = 250 nm时, 共轴腔上外半径R在70—100 nm范围内的结构色显示图; (b) 不同共轴腔上外半径的反射谱图; (c) 共轴腔上外半径R的对比反射光谱图; (d) 上外半径R对应的颜色路径图
Figure 5. Structural color and spectrum contrast diagram: (a) Structural color display diagram of coaxial cavity with outer radius R from 70 to 100 nm; (b) reflection spectrums of different coaxial cavity depths; (c) contrast reflection spectra of outer radius R in coaxial cavity; (d) color path corresponding to upper outer radius R.
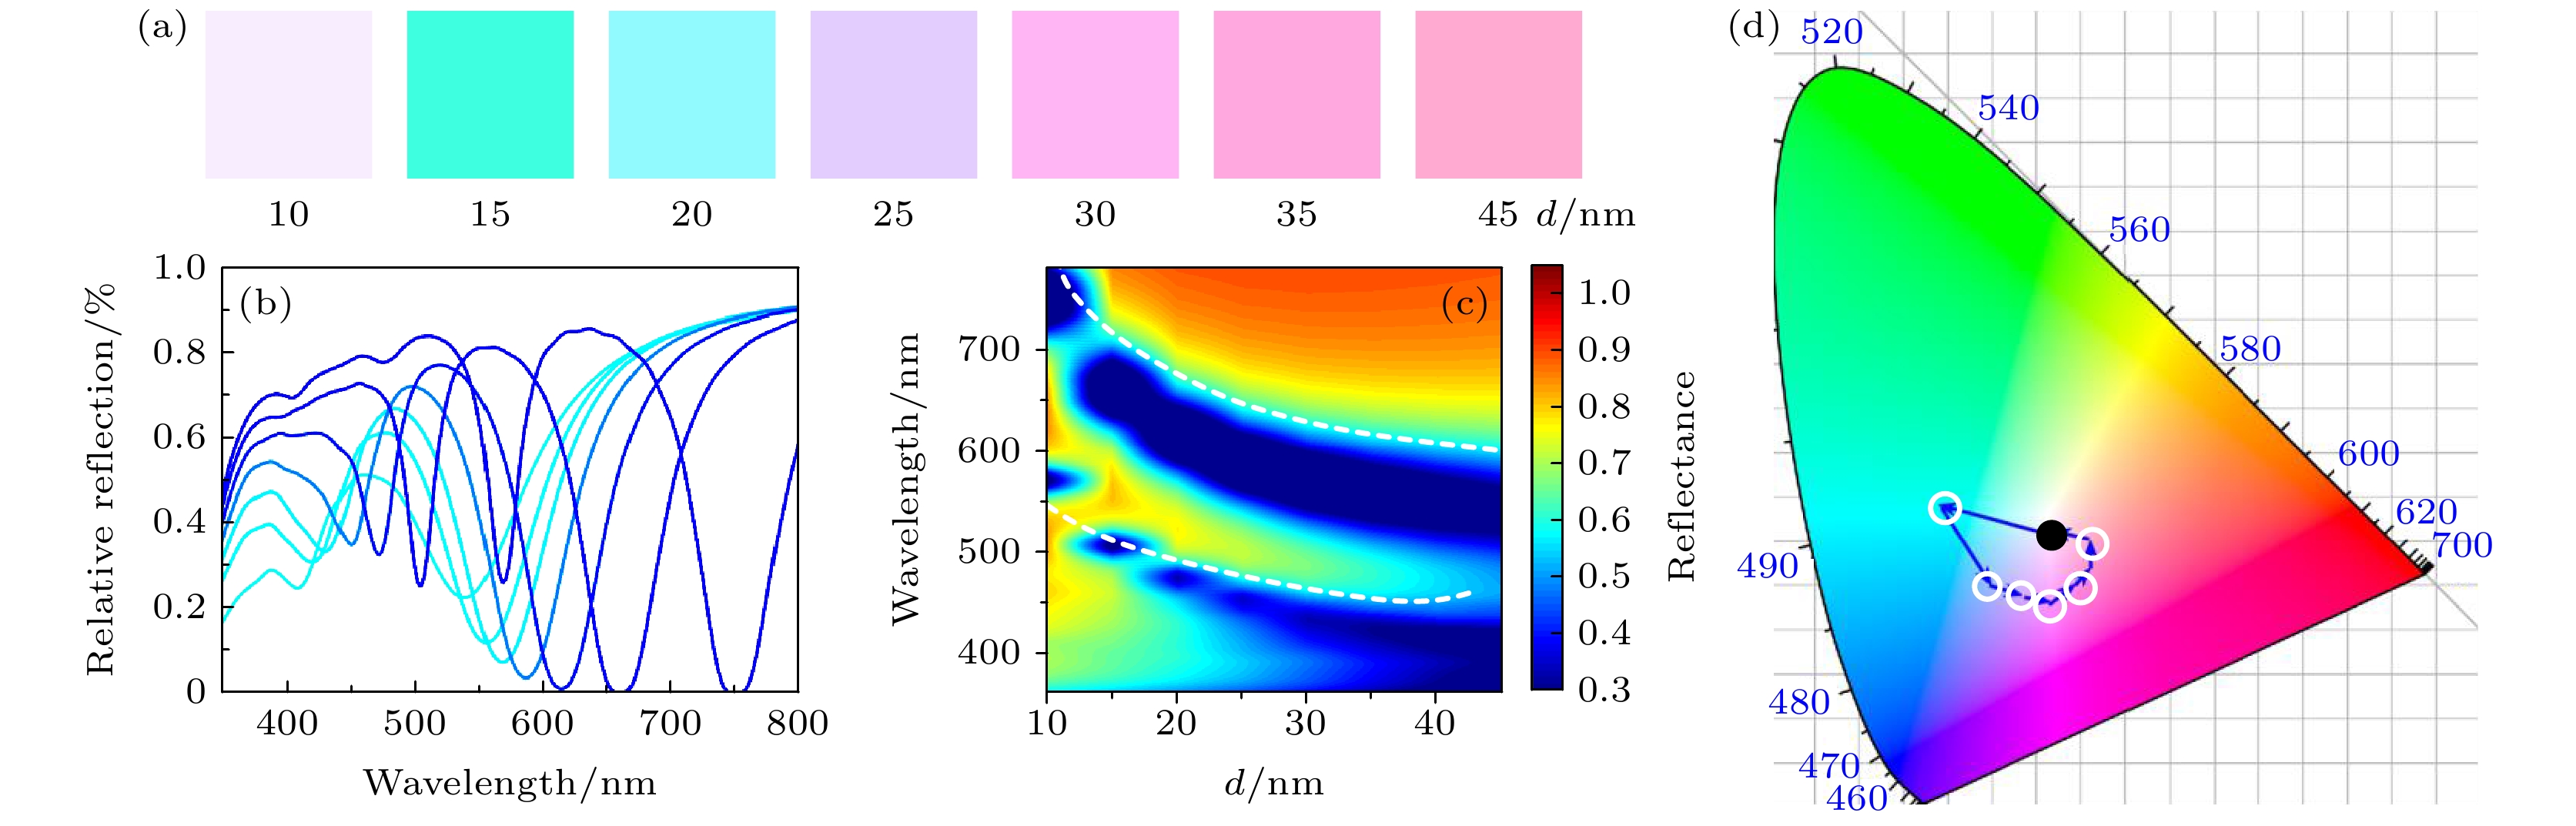
图 6 结构色及光谱对比图 (a) H = 150 nm, r = 35 nm, P = 250 nm时, 共轴腔厚度d在10—45 nm范围内的结构色显示图; (b) 不同共轴腔厚度的反射谱图; (c) 共轴腔厚度d的对比反射光谱图; (d) 厚度d对应的颜色路径图
Figure 6. Structural color and spectrum comparison diagram: (a) When H = 150 nm, R= 55 nm, r = 35 nm, P = 250 nm, the structure color display diagram of coaxial cavity thickness d from 10–45 nm; (b) reflection spectrums of different coaxial cavity depths; (d) color path corresponding to thickness d.
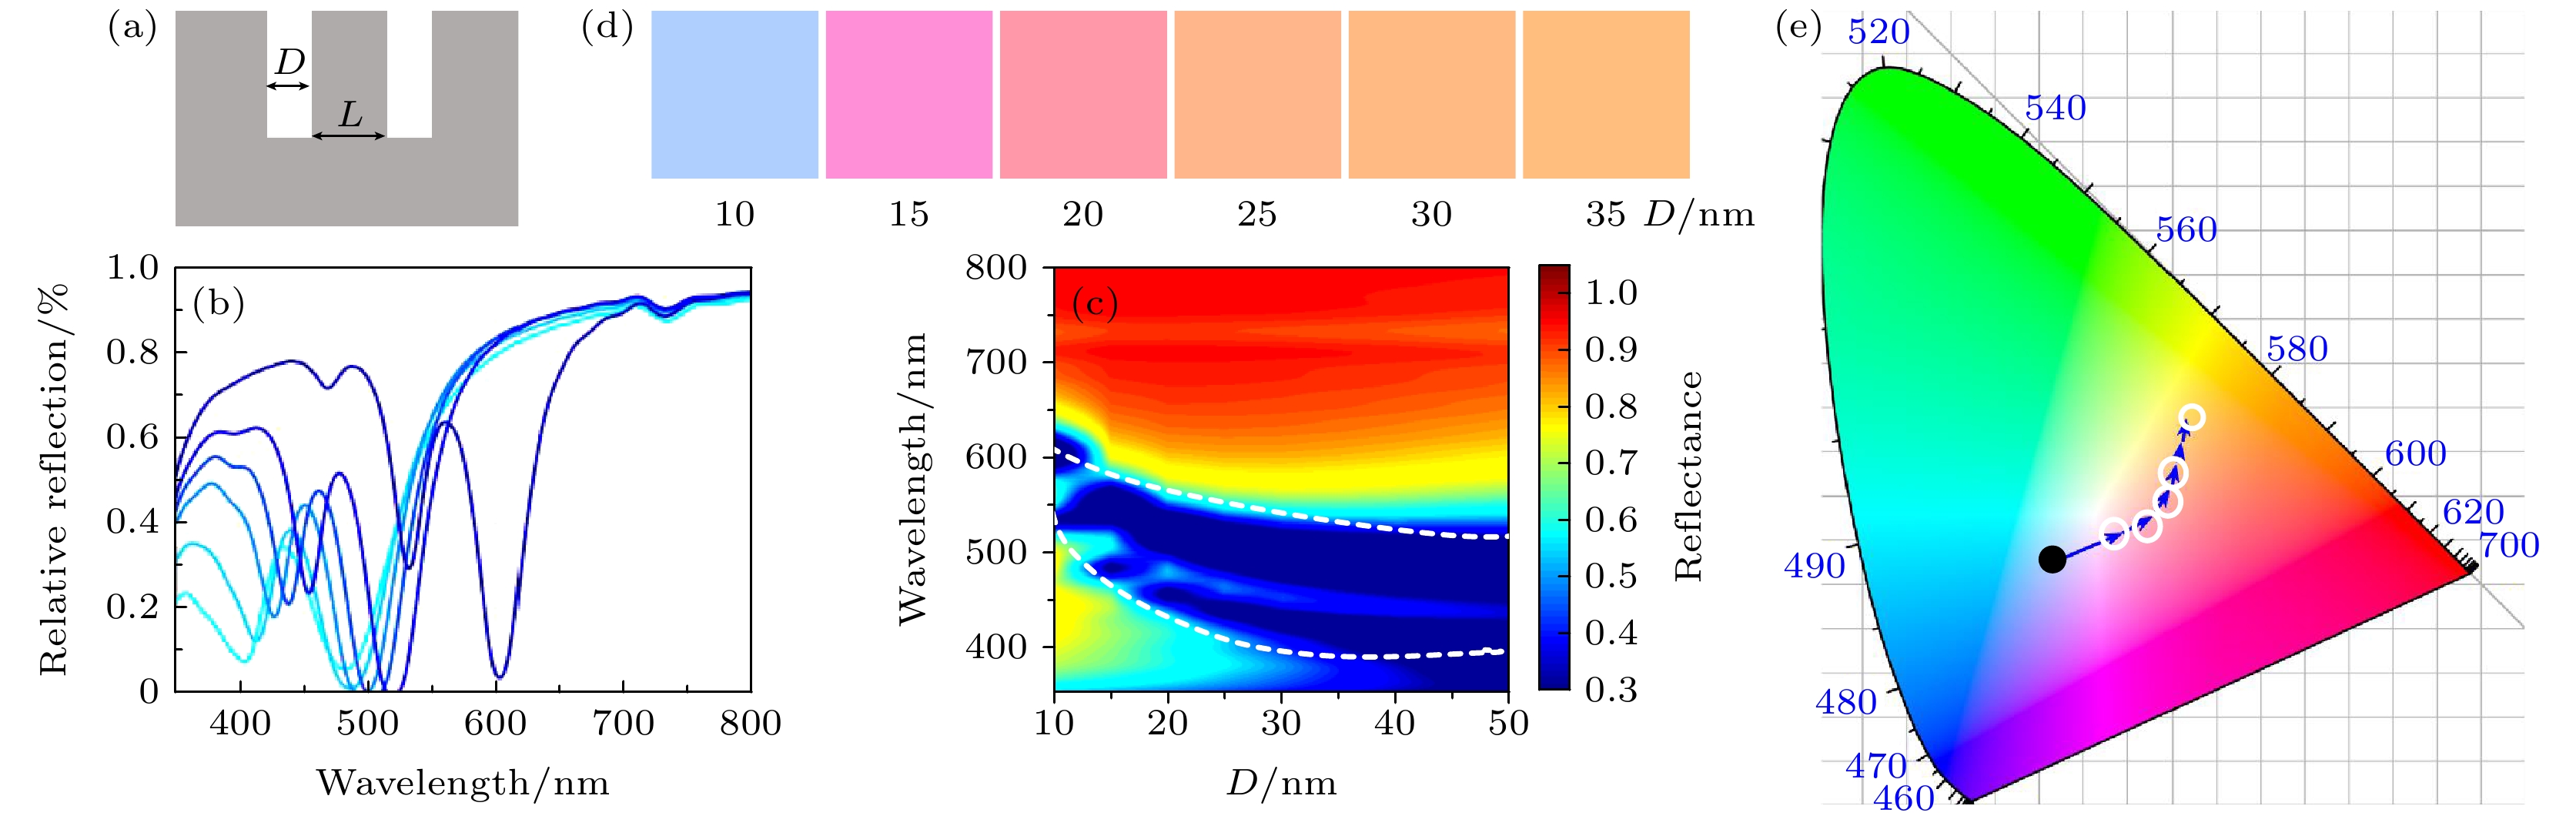
图 7 结构色及光谱对比图 (a)对称结构截面图; (b) H = 200 nm, L = 60 nm, P = 250 nm时, 共轴腔厚度D从10—35 nm的结构色显示图; (c) 不同共轴腔厚度的反射谱图; (d) 共轴腔厚度D的对比反射光谱图; (e) 厚度D对应的颜色路径图
Figure 7. Structural color and spectrum comparison diagram: (a) When H = 200 nm, L = 60 nm, P = 250 nm, the structure color display diagram of coaxial cavity thickness d from 10 ~ 35 nm; (b) structural color display diagram of coaxial cavity thickness D from 10 to 35 nm; (c) reflection spectrums of different coaxial cavity depths; (d) contrast reflection spectrogram of coaxial cavity thickness D; (e) color path corresponding to thickness D
-
[1] Kolle M, Pedro M S, Maik R J S 2010 Nat. Nanotechnol. 5 511
Google Scholar
[2] Noh H, Liew S F, Saranathan V 2010 Adv. Mater. 22 2871
Google Scholar
[3] Rassart M, Simonis P, Bay A 2009 Phys. Rev. E 80 031910
Google Scholar
[4] Parker A R, Welch V L, Driver D 2003 Nature 426 786
Google Scholar
[5] Roberts A S, Pors A, Albrektsen O, Bozhevolnyi S I 2014 Nano Lett. 14 783
Google Scholar
[6] VarPhilips R W, Bleikolm A F 1996 Appl. Opt. 35 5529
Google Scholar
[7] Liu X Y, Zhu S M, Zhang D 2010 Mater. Lett. 64 2745
Google Scholar
[8] Guo D Z, Hou S M, Xue Z Q 2002 Chin. Phys. Lett. 19 385
Google Scholar
[9] 成建新, 周 盈, 常建华, 倪海彬 2021 光通信研究与应用 47 41
Cheng J X, Zhou Y, Chang J H, Ni H B 2021 Study on Optical Communications 47 41
[10] Murphy A, Sonnefraud Y, Krasavin A V, Ginzburg P, Morgan F, McPhillips J, Wurtz G, Maier S A, Zayats A V, Pollard R 2013 Appl. Phys. Lett. 102 103103
Google Scholar
[11] Dong Z, Ho J, Yu Y F, Fu Y H, Paniagua-Dominguez R, Wang S, Kuznetsov A I, Yang J K W 2017 Nano Lett. 17 7620
Google Scholar
[12] Vandehaar M A, Maas R, Brenny B, Polman A 2016 New J. Phys. 18 043016
Google Scholar
[13] Ni H B, Wang M, Shen T, Zhou J 2015 ACS Nano 9 1913
Google Scholar
[14] 戴琦, 付娆, 邓联贵, 李嘉鑫, 郑国兴 2019 应用光学 40 1045
Google Scholar
Dai Q, Fu R, Deng L G, Li J X, Zheng G X 2019 Appl. Opt. 40 1045
Google Scholar
[15] 杨悦, 王珏玉, 赵敏, 崔岱宗 2019 化学进展 31 1007
Yang Y, Wang J Y, Zhao M, Cui D Z 2019 Prog Chem. 31 1007
[16] Karmakar S, Behera D 2019 Ceram. Int. 45 237
[17] Abdolahi M, Jiang H, Kaminska B 2019 Nat. Nanotechnol. 30 405301
Google Scholar
[18] 钟敏, 史先春 2020 红外与毫米波学报 39 576
Google Scholar
Zhong M, Shi X C 2020 J. Infrared Millimeter 39 576
Google Scholar
[19] 张浩驰, 何沛航, 牛凌云, 张乐鹏, 崔铁军 2021 光学学报 41 372
Zhang H C, He P H, Niu L Y, Zhang L P, Cui T J 2021 Acta Opt. Sin. 41 372

 DownLoad:
Catalog
Metrics
- Abstract views: 6204
- PDF Downloads: 66
- Cited By: 0
