


-
Underwater acoustics has wide applications in underwater communication, underwater positioning, underwater navigation, and so on. Inspired by the concept of topological physics, the study of topological states in waterborne phononic crystals provides a brand-new way for innovatively controlling underwater waves, which has both basic research value and important application prospects. In this work, we design a one-dimensional bilayer iron grid waterborne phononic crystal to realize a synthetic two-dimensional Dirac point by considering the relative lateral translation between the two layers as a synthetic dimension. Through changing the relative lateral translation, the double degenerate band opens a gap, which is characterized by the valley Chern number. As the band gap opens, closes and reopens, the bulk band undergoes a band inversion, that is, a topological phase transition from one valley topological phase to another. At the interface formed by two phononic crystals with distinct valley topological phases, the valley Chen number ensures the deterministic existence of the interface state. Experimental measurements are in good agreement with numerical simulations, both showing the bulk bands of waterborne phononic crystals at different valley topological phases and the interface state dispersion between them. The waterborne phononic crystal proposed in this work has a simple structure. With the help of the concept of synthetic dimension, it provides an effective way to study the topological properties of high-dimensional systems in low-dimensional real space systems, and gives new ideas for designing topological functional underwater acoustic devices. In addition, we can expand the real space system to two or even three dimensions, and introduce more synthetic dimensions to study the topological states and associated transport characteristics of higher-dimensional systems.
-
Keywords:
- waterborne phononic crystal /
- synthetic dimension /
- Dirac point /
- interface state
[1] Sigalas M M, Economou E N 1992 J. Sound Vib. 158 377
 Google Scholar
[2] Kushwaha M S, Halevi P, Dobrzynski L, Djafari-Rouhani B 1993 Phys. Rev. Lett. 71 2022
Google Scholar
[3] Yang S, Page J H, Liu Z, Cowan M L, Chan C T, Sheng P 2004 Phys. Rev. Lett. 93 024301
Google Scholar
[4] Zhang X, Liu Z Y 2004 Appl. Phys. Lett. 85 341
Google Scholar
[5] Zhang S, Xia C G, Fang N 2011 Phys. Rev. Lett. 106 024301
Google Scholar
[6] Mei J, Ma G C, Yang M Y, Yang Z Y, Wen W J, Sheng P 2012 Nat. Commun. 3 756
Google Scholar
[7] Hasan M Z, Kane C L 2010 Rev. Mod. Phys. 82 3045
Google Scholar
[8] Qi X L, Zhang S C 2011 Rev. Mod. Phys. 83 1057
Google Scholar
[9] Wieder B J, Bradlyn B, Cano J, Wang Z, Vergniory M G, Elcoro L, Soluyanov A A, Felser C, Neupert T, Regnault N, Bernevig B A 2021 Nat. Rev. Mater. 7 196
Google Scholar
[10] Lodge M S, Yang S A, Mukherjee S, Weber B 2021 Adv. Mater. 33 2008029
Google Scholar
[11] Gilbert M J 2021 Commun. Phys. 4 70
Google Scholar
[12] Bernevig B A, Felser C, Beidenkopf H 2022 Nature 603 41
Google Scholar
[13] Chang C Z, Liu C X, MacDonald A H 2023 Rev. Mod. Phys. 95 011002
Google Scholar
[14] He Q L, Hughes T L, Armitage N P, Tokura Y, Wang K L 2022 Nat. Mater. 21 15
Google Scholar
[15] Zhang X, Xiao M, Cheng Y, Lu M H, Christensen J 2018 Commun. Phys. 1 97
Google Scholar
[16] Ma G C, Xiao M, Chan C T 2019 Nat. Rev. Phys. 1 281
Google Scholar
[17] Xue H R, Yang Y, Zhang B L 2022 Nat. Rev. Mater. 7 974
Google Scholar
[18] Yves S, Ni X, Alu A 2022 Ann. New York Acad. Sci. 1517 63
Google Scholar
[19] Lu J Y, Qiu C Y, Ke M Z, Liu Z Y 2016 Phys. Rev. Lett. 116 093901
Google Scholar
[20] Lu J Y, Qiu C Y, Ye L P, Fan X Y, Ke M Z, Zhang F, Liu Z Y 2017 Nat. Phys. 13 369
Google Scholar
[21] Gao F, Xue H R, Yang Z Y, Lai K F, Yu Y, Lin X, Chong Y D, Shvets G, Zhang B L 2018 Nat. Phys. 14 140
Google Scholar
[22] Zhang Z W, Tian Y, Wang Y H, Gao S X, Cheng Y, Liu X J, Christensen J 2018 Adv. Mater. 30 1803229
Google Scholar
[23] Yan M, Lu J Y, Li F, Deng W Y, Huang X Q, Ma J H, Liu Z Y 2018 Nat. Mater. 17 993
Google Scholar
[24] Zhu Z, Huang X Q, Lu J Y, Yan M, Li F, Deng W Y, Liu Z Y 2019 Phys. Rev. Appl. 12 024007
Google Scholar
[25] Wu S, Wu Y, Mei J 2018 New J. Phys. 20 023051
Google Scholar
[26] Wu X X, Fan H Y, Liu T, Gu Z M, Zhang R Y, Zhu J, Zhang X 2022 Nat. Commun. 13 6120
Google Scholar
[27] Shen Y, Qiu C, Cai X, Ye L, Lu J Y, Ke M, Liu Z Y 2019 Appl. Phys. Lett. 114 023501
Google Scholar
[28] Wang W, Chen Z G, Ma G C 2021 Phys. Rev. Lett. 127 214302
Google Scholar
[29] Liu J J, Li Z W, Chen Z G, Tang W Y, Chen A, Liang B, Ma G C, Cheng J C 2022 Phys. Rev. Lett. 129 084301
Google Scholar
[30] Chen H, Zhang H K, Wu Q, Huang Y, Nguyen H, Prodan E, Zhou X M, Huang G L 2021 Nat. Commun. 12 5028
Google Scholar
-
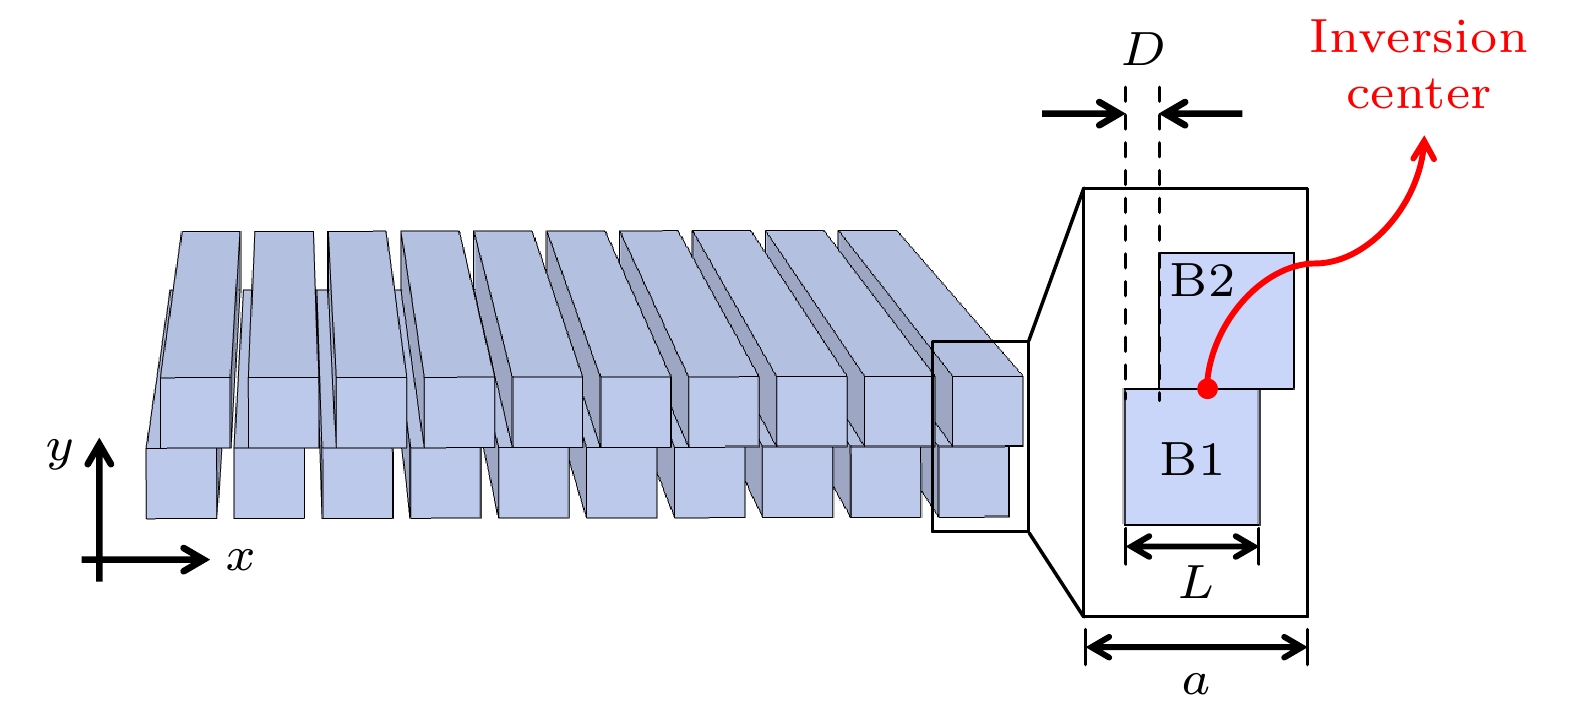
图 1 一维水基声子晶体的结构示意图
Figure 1. Schematic of the one-dimensional waterborne phononic crystal.
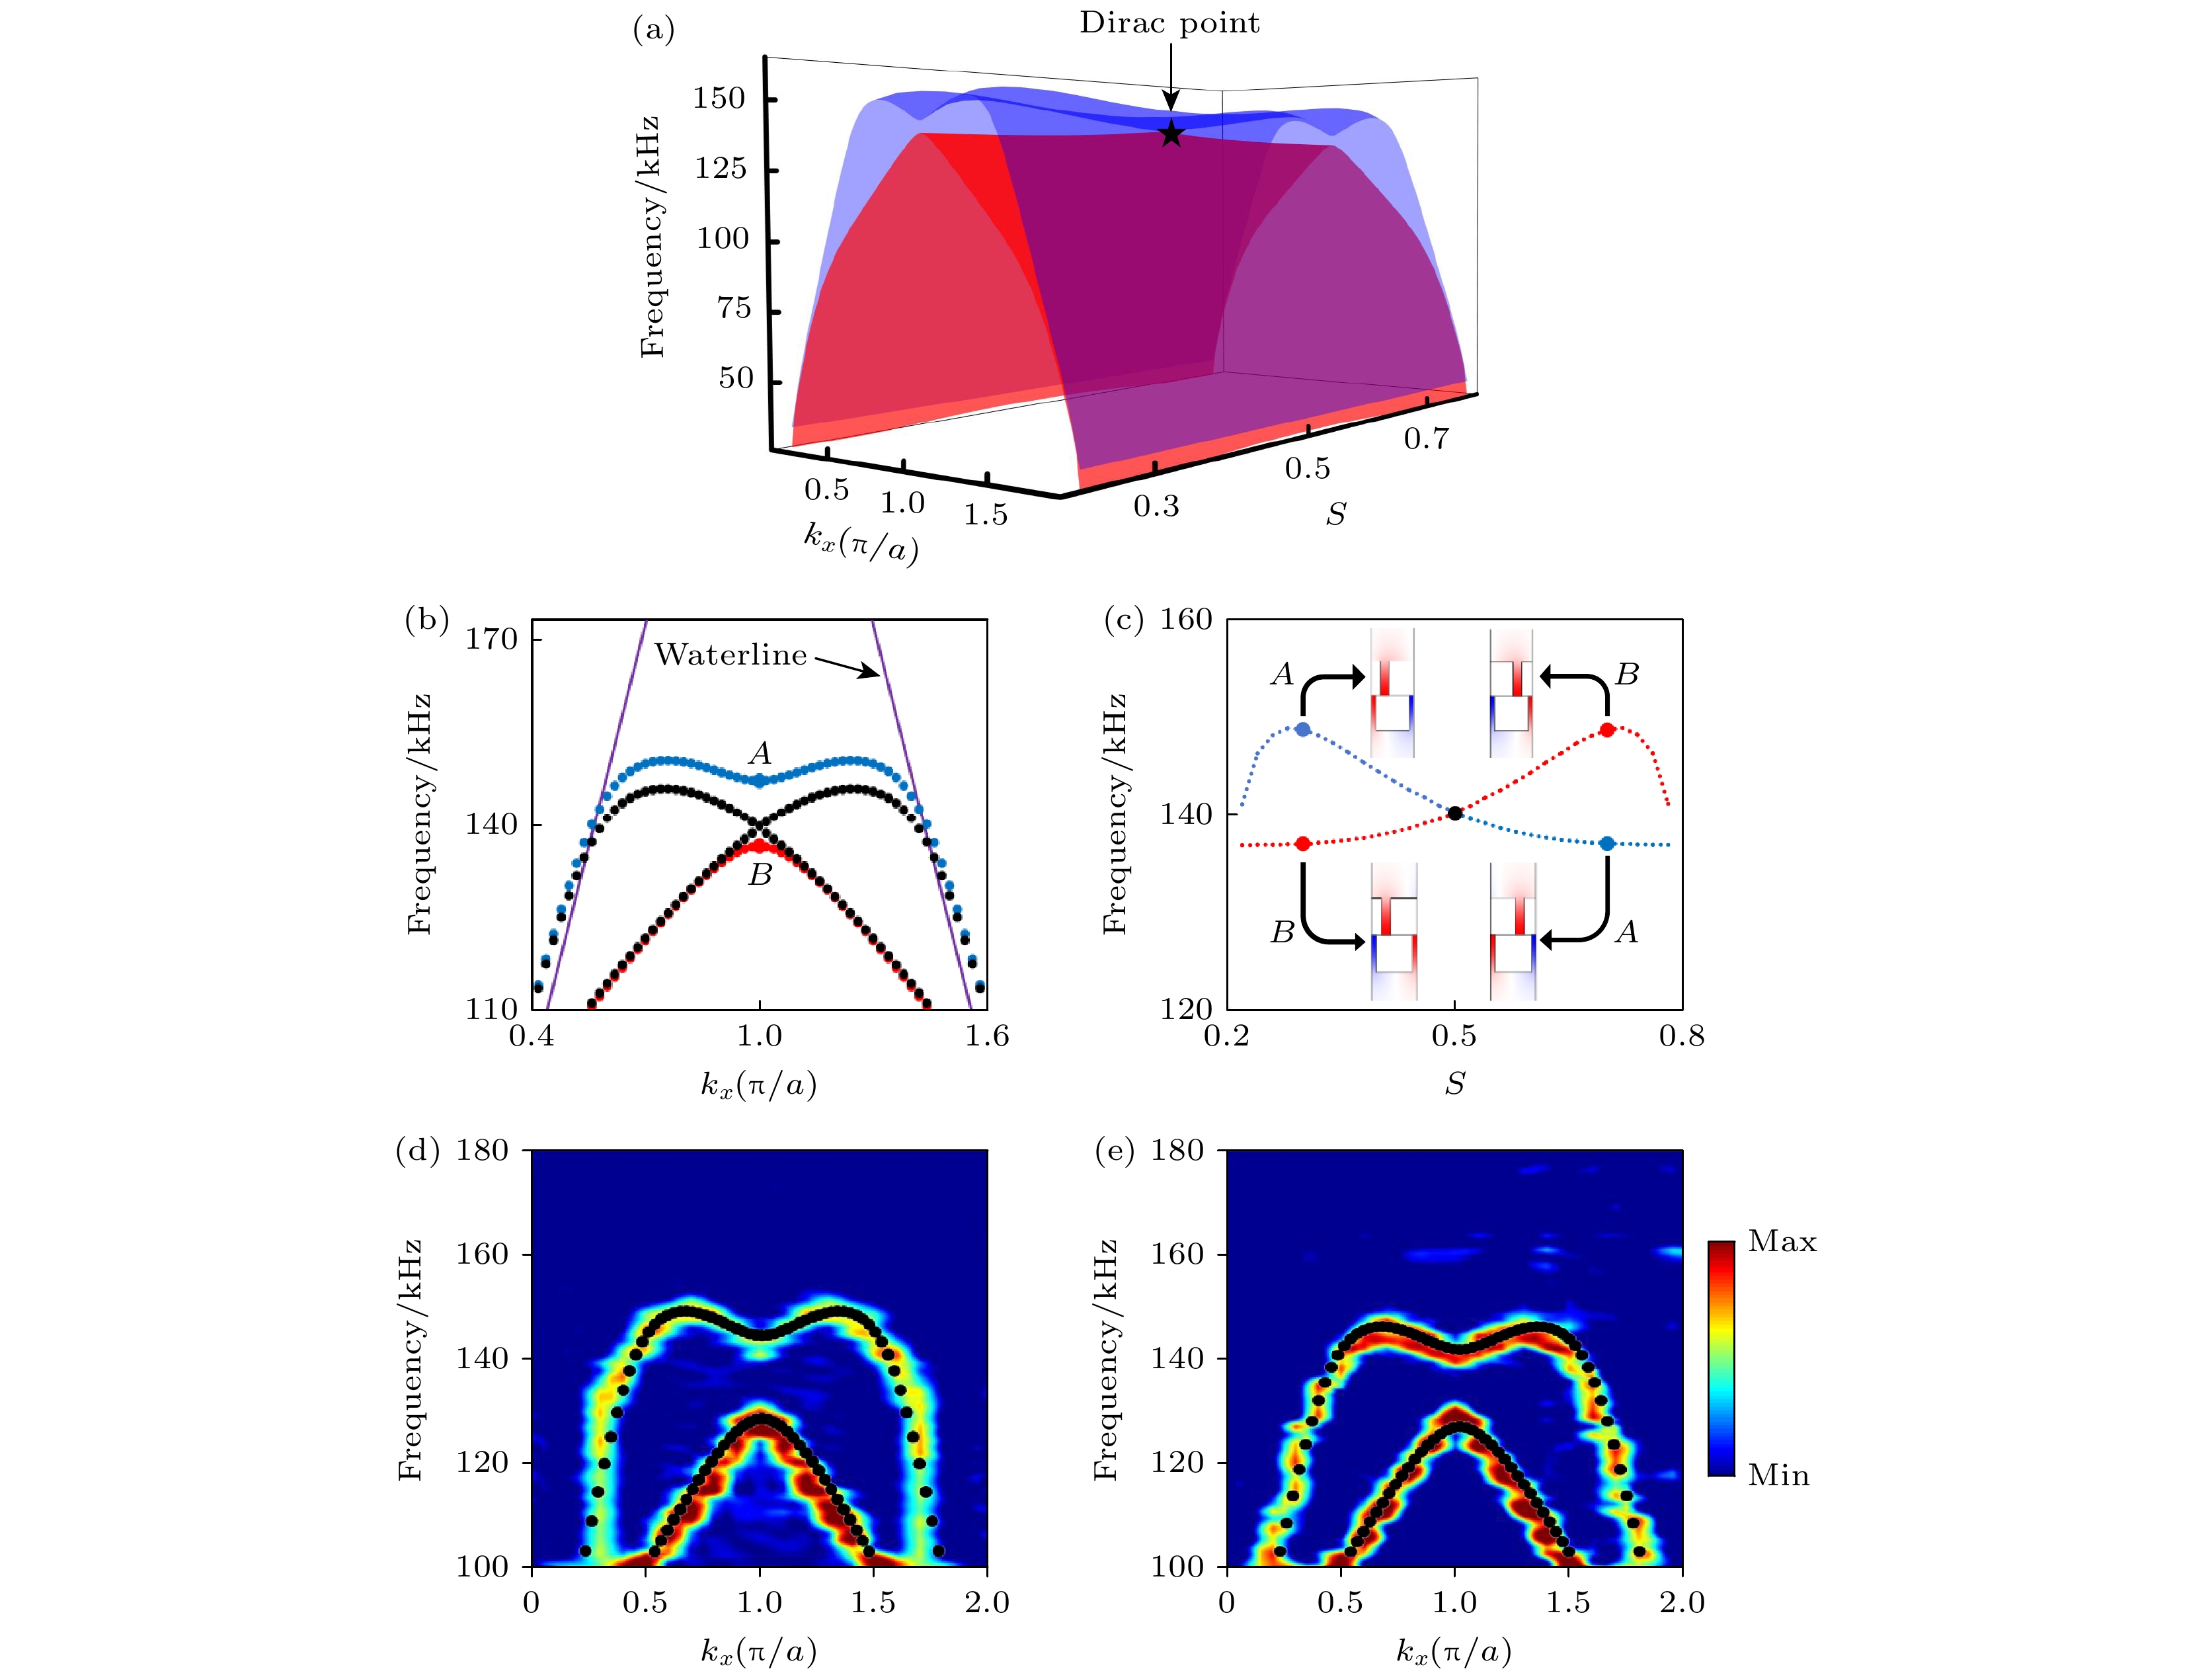
图 2 一维合成维度水基声子晶体的体能带 (a)三维能带结构, 黑色五角星表示狄拉克点; (b)不同的$ S $下能带结构随$ {k}_{x} $的变化, 蓝色和红色点表示$ S=0.3 $, 黑色点表示$ S=0.5 $, 紫色实线表示水线, A和B分别表示$ {k}_{x}={\mathrm{\pi }}/a $时上下两条能带的本征态; (c)态A, B关于$ S $的拓扑相图; (d), (e) $ S=0.3 $和$ S=0.7 $时的实验测量(彩色图)和数值仿真(黑色点)体能带
Figure 2. Bulk band structure of the one-dimensional waterborne phononic crystal: (a) Three-dimensional band structure, black star represents the Dirac point; (b) bulk band structure as a function of $ {k}_{x} $ for different $ S $, blue and red dots indicate the case of $ S=0.3 $, while the black dots are for $ S=0.5 $, the purple solid line represents the water line, A and B denote the eigen states in the upper and lower bands at $ {k}_{x}={\mathrm{\pi }}/a $; (c) phase diagram of states A and B; (d), (e) measured and simulated bulk band structures for the cases of $ S=0.3 $ and $ S=0.7 $, respectively.
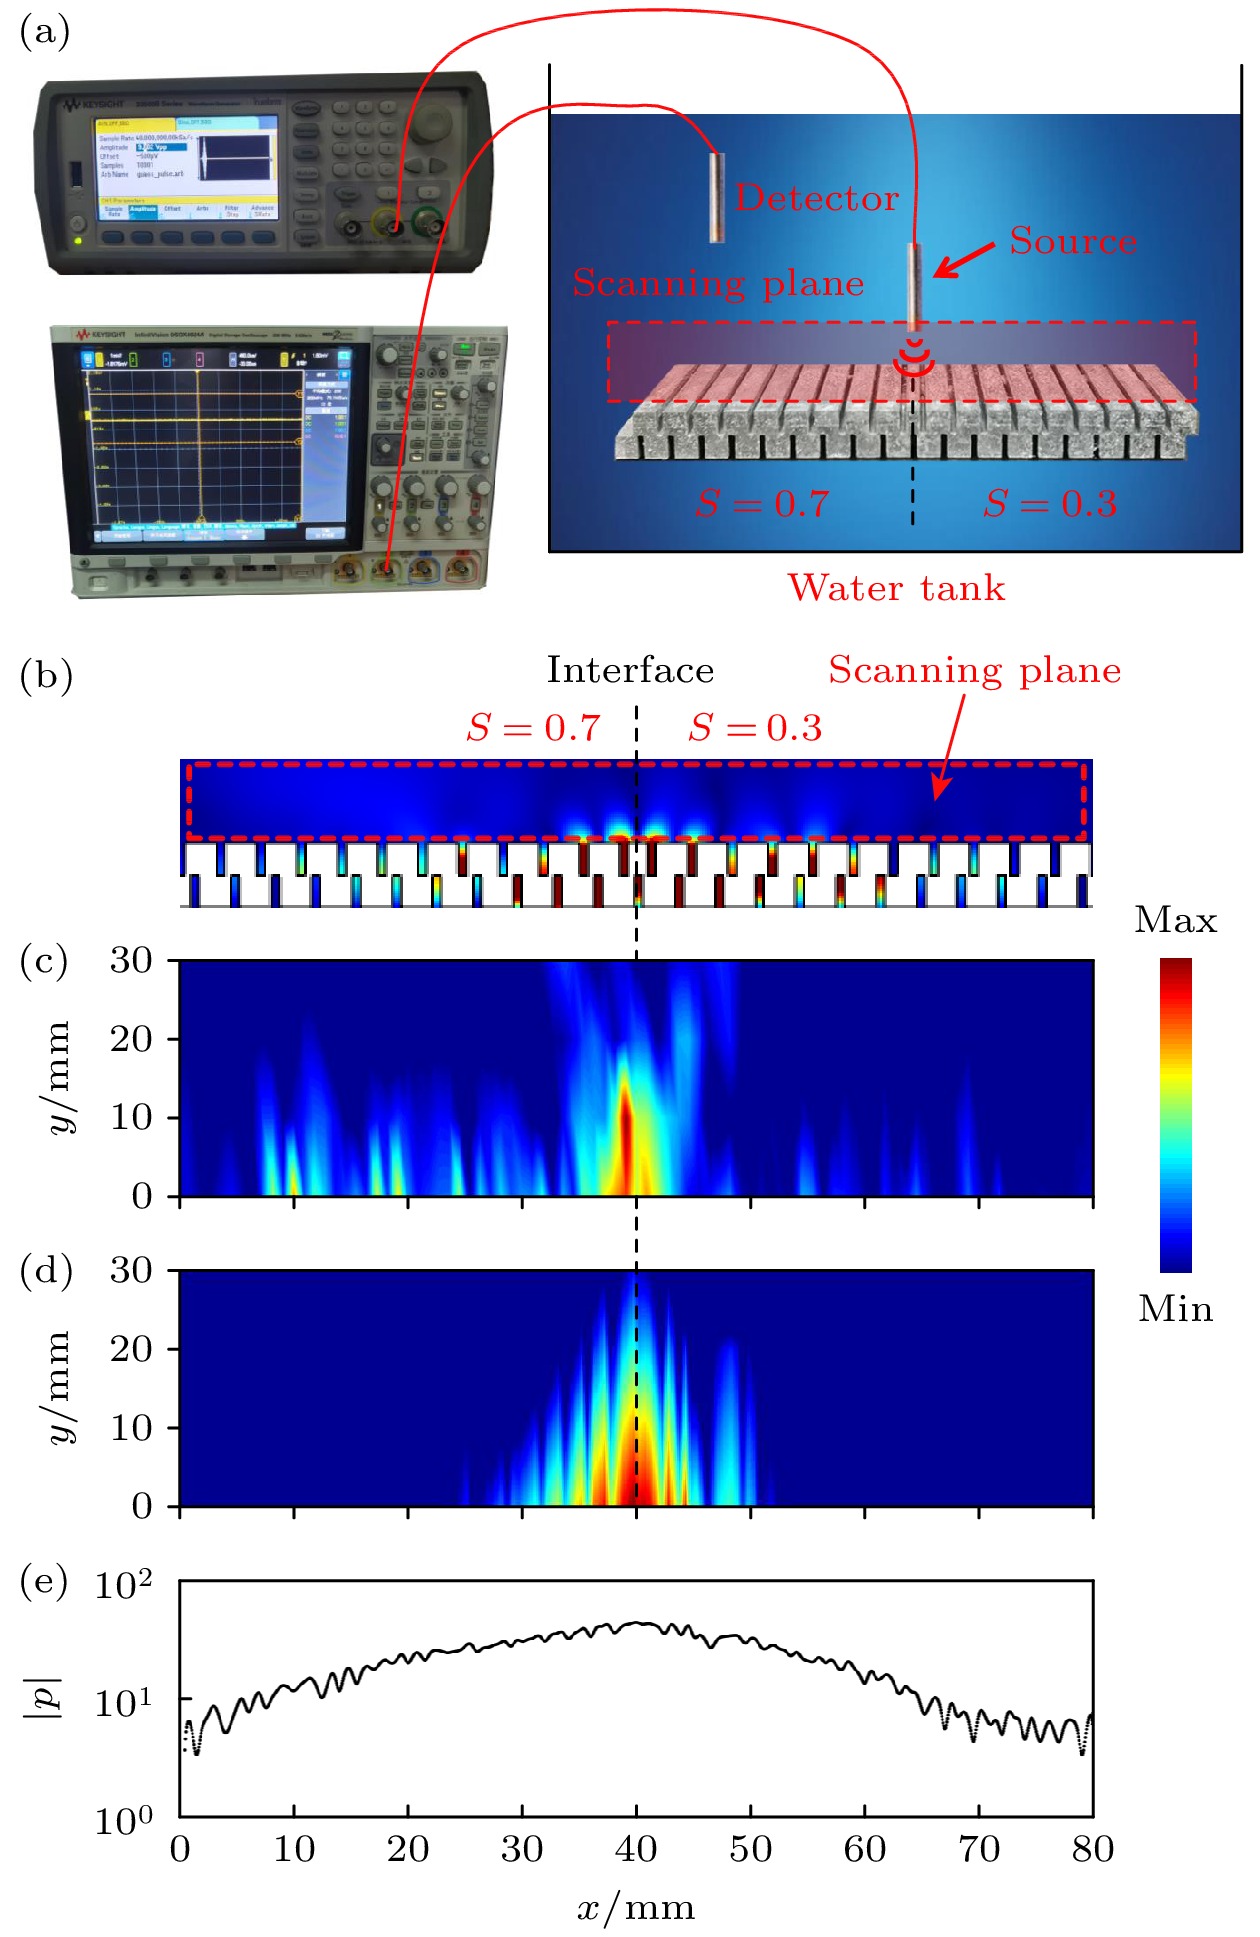
图 3 由两个不同能谷拓扑相水基声子晶体构成的界面处的界面态 (a)水下超声近场扫描实验平台示意图; (b)二维数值仿真得到的界面态本征声压场分布图; (c)三维有限大小结构数值仿真得到的界面态声压强分布图; (d)实验测量的界面态声压场分布图; (e)实验声压场在$ y=0 $沿着x方向的分布图. 图中声压场的频率均为142 kHz
Figure 3. Interface states at the interface constructed by two waterborne phononic crystals with distinct valley topological phases: (a) Schematic diagram of the underwater ultrasonic near field scanning experimental platform; (b) simulated eigen pressure field distribution of the interface state in a pure two-dimensional structure; (c) simulated pressure field distribution of the interface state in a finite-size three-dimensional structure; (d) measured pressure field distribution of the interface state; (e) pressure field distribution along the x direction for $ y=0 $. All the frequencies of the pressure fields in this figure are 142 kHz.
-
[1] Sigalas M M, Economou E N 1992 J. Sound Vib. 158 377
Google Scholar
[2] Kushwaha M S, Halevi P, Dobrzynski L, Djafari-Rouhani B 1993 Phys. Rev. Lett. 71 2022
Google Scholar
[3] Yang S, Page J H, Liu Z, Cowan M L, Chan C T, Sheng P 2004 Phys. Rev. Lett. 93 024301
Google Scholar
[4] Zhang X, Liu Z Y 2004 Appl. Phys. Lett. 85 341
Google Scholar
[5] Zhang S, Xia C G, Fang N 2011 Phys. Rev. Lett. 106 024301
Google Scholar
[6] Mei J, Ma G C, Yang M Y, Yang Z Y, Wen W J, Sheng P 2012 Nat. Commun. 3 756
Google Scholar
[7] Hasan M Z, Kane C L 2010 Rev. Mod. Phys. 82 3045
Google Scholar
[8] Qi X L, Zhang S C 2011 Rev. Mod. Phys. 83 1057
Google Scholar
[9] Wieder B J, Bradlyn B, Cano J, Wang Z, Vergniory M G, Elcoro L, Soluyanov A A, Felser C, Neupert T, Regnault N, Bernevig B A 2021 Nat. Rev. Mater. 7 196
Google Scholar
[10] Lodge M S, Yang S A, Mukherjee S, Weber B 2021 Adv. Mater. 33 2008029
Google Scholar
[11] Gilbert M J 2021 Commun. Phys. 4 70
Google Scholar
[12] Bernevig B A, Felser C, Beidenkopf H 2022 Nature 603 41
Google Scholar
[13] Chang C Z, Liu C X, MacDonald A H 2023 Rev. Mod. Phys. 95 011002
Google Scholar
[14] He Q L, Hughes T L, Armitage N P, Tokura Y, Wang K L 2022 Nat. Mater. 21 15
Google Scholar
[15] Zhang X, Xiao M, Cheng Y, Lu M H, Christensen J 2018 Commun. Phys. 1 97
Google Scholar
[16] Ma G C, Xiao M, Chan C T 2019 Nat. Rev. Phys. 1 281
Google Scholar
[17] Xue H R, Yang Y, Zhang B L 2022 Nat. Rev. Mater. 7 974
Google Scholar
[18] Yves S, Ni X, Alu A 2022 Ann. New York Acad. Sci. 1517 63
Google Scholar
[19] Lu J Y, Qiu C Y, Ke M Z, Liu Z Y 2016 Phys. Rev. Lett. 116 093901
Google Scholar
[20] Lu J Y, Qiu C Y, Ye L P, Fan X Y, Ke M Z, Zhang F, Liu Z Y 2017 Nat. Phys. 13 369
Google Scholar
[21] Gao F, Xue H R, Yang Z Y, Lai K F, Yu Y, Lin X, Chong Y D, Shvets G, Zhang B L 2018 Nat. Phys. 14 140
Google Scholar
[22] Zhang Z W, Tian Y, Wang Y H, Gao S X, Cheng Y, Liu X J, Christensen J 2018 Adv. Mater. 30 1803229
Google Scholar
[23] Yan M, Lu J Y, Li F, Deng W Y, Huang X Q, Ma J H, Liu Z Y 2018 Nat. Mater. 17 993
Google Scholar
[24] Zhu Z, Huang X Q, Lu J Y, Yan M, Li F, Deng W Y, Liu Z Y 2019 Phys. Rev. Appl. 12 024007
Google Scholar
[25] Wu S, Wu Y, Mei J 2018 New J. Phys. 20 023051
Google Scholar
[26] Wu X X, Fan H Y, Liu T, Gu Z M, Zhang R Y, Zhu J, Zhang X 2022 Nat. Commun. 13 6120
Google Scholar
[27] Shen Y, Qiu C, Cai X, Ye L, Lu J Y, Ke M, Liu Z Y 2019 Appl. Phys. Lett. 114 023501
Google Scholar
[28] Wang W, Chen Z G, Ma G C 2021 Phys. Rev. Lett. 127 214302
Google Scholar
[29] Liu J J, Li Z W, Chen Z G, Tang W Y, Chen A, Liang B, Ma G C, Cheng J C 2022 Phys. Rev. Lett. 129 084301
Google Scholar
[30] Chen H, Zhang H K, Wu Q, Huang Y, Nguyen H, Prodan E, Zhou X M, Huang G L 2021 Nat. Commun. 12 5028
Google Scholar

 DownLoad:
Catalog
Metrics
- Abstract views: 5796
- PDF Downloads: 290
- Cited By: 0
